
ByteTree Quarterly Investor Letter - Q2 2026

Since 2016, our mission has been to help people invest more effectively. We do this by delivering actionable, high-quality investment guidance at an affordable price.
With all the information out there, we help investors by distilling our advice into model portfolios, explaining every new investment recommendation in real time. In this Q2 2026 update, I shall review our flagship product, The Multi-Asset Investor. I will also touch on the ByteTree Quality Portfolio, as well as our ongoing project to upgrade ByteTrend.io.
Letter from Charlie Morris, CEO
The quarter began with yet another sharp recovery, following the sell-off related to the War in Iran. This follows the tariff crash in 2025, which also proved short-lived. Sooner or later, investors won’t be so lucky, and a bear market will follow. The long-term signs of excesses are clear to all, and it is a matter of time before the bubble bursts.
That does not mean investors should hide from the stockmarkets, but they should stick to the basics. Many good and cheap companies have been ignored in the latest phase of the tech rally. The focus on semiconductors to drive AI has sucked capital away from the lower-risk areas of the market.
This rally has distorted the market indices, just as it did in 1999, and the concentration has once again become extreme. A simple way to illustrate this is with the S&P 500 Equal Weight Index, measured against the S&P 500 Index. The Equal Weight Index (SPW) holds 0.2% in each stock, rebalancing quarterly. In contrast, the S&P 500 (SPX) has 33.3% in the top ten. SPW is more diversified, and the quarterly rebalancing acts as a long-term value strategy by repeatedly buying low and selling high.
S&P 500 Equal Weight vs S&P 500
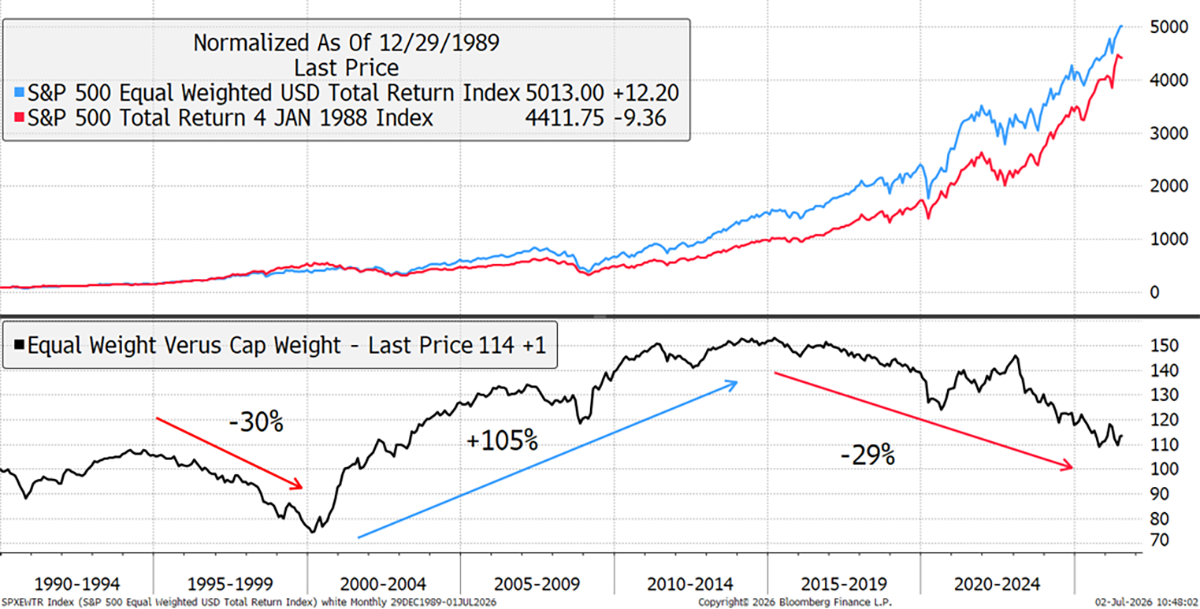
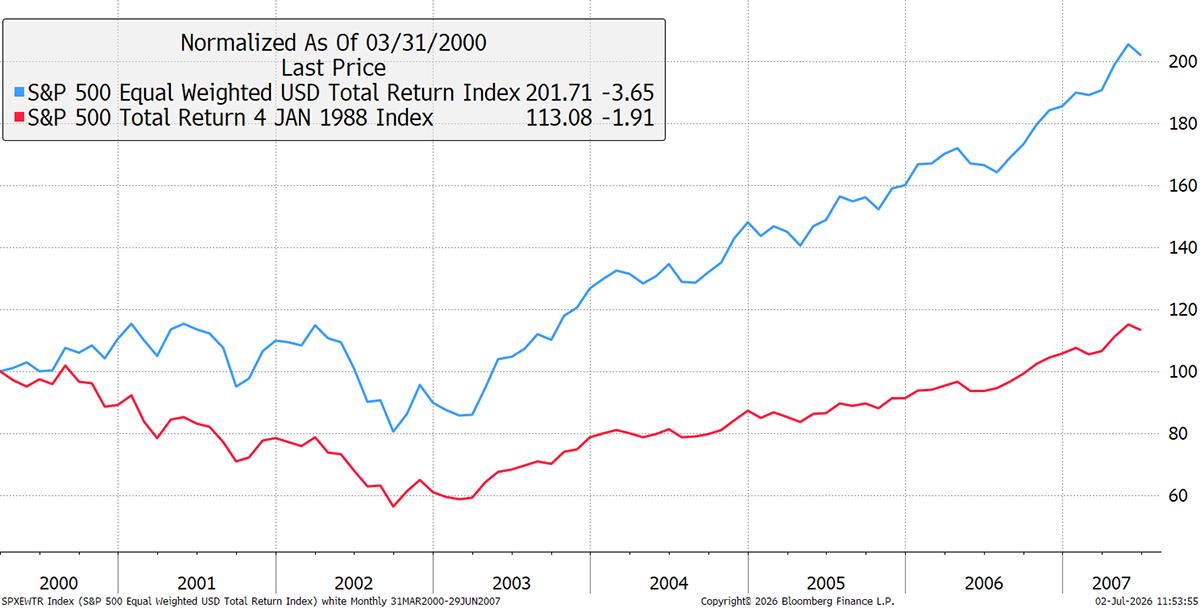
SPW has beaten SPX since 1990, with most of the excess return coming between the dotcom bubble in 1999 and the peak in 2015, when the tech rally really got going. During the tech rallies in the 1990s and recently, SPW lagged by around 30%. Yet, when the music stopped, SPW outperformed significantly, as its lower exposure to the bubble meant there was less damage from the heavy losses in large-cap companies. Zooming in since the tech bubble peak in March 2000, the SPW has only faced a mild setback compared to the SPX and has gone on to do well in the subsequent bull market.
S&P 500 Equal Weight vs S&P 500 – Post-1999 Tech Bubble
This exercise demonstrates the extremes in today’s markets and that investors will come out on top by pursuing a more conservative investment strategy.
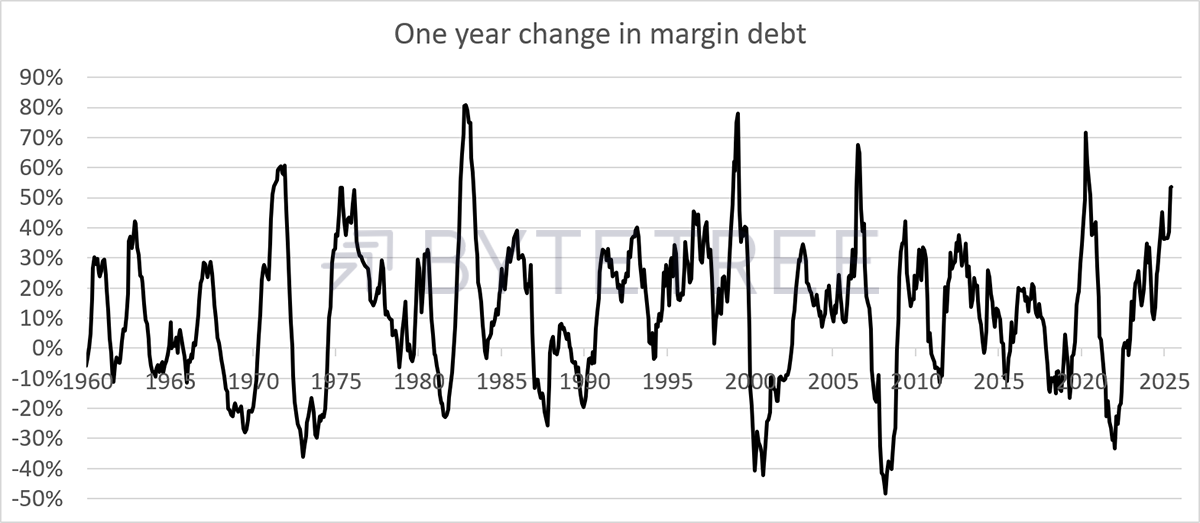
Another way to show the levels of exuberance comes from margin debt data. Investors have been running hard and leveraging up their trading accounts. The current reading shows data for May, and with June included, it would no doubt be even higher. Extremes in margin debt have preceded market downturns. Examples include 1972, 1976, 1987, 2000, 2007, and 2021. All of these were subsequently described as market bubbles, resulting in bear markets.
Margin Debt
Over the past year, the US semiconductor Index (SOX) has added $10 trillion of market cap and is now worth $16 trillion. To put that into perspective, that is the same as the total value of the EuroStoxx 600 Index, which includes the UK.
This reiterates our investment strategy: to be prepared for the worst because the cautious approach always wins in the end, just like the hare and the tortoise. Our ethos is value and momentum (early trends), which means identifying stocks and strategies that will prove resilient, combined with diversification.
A diversified portfolio is a robust portfolio. That doesn’t simply mean holding lots of assets, but different types of assets. The most important macro factor that drives portfolio performance comes from the behaviour of money itself. The Money Map illustrates this.
The ByteTree Money Map
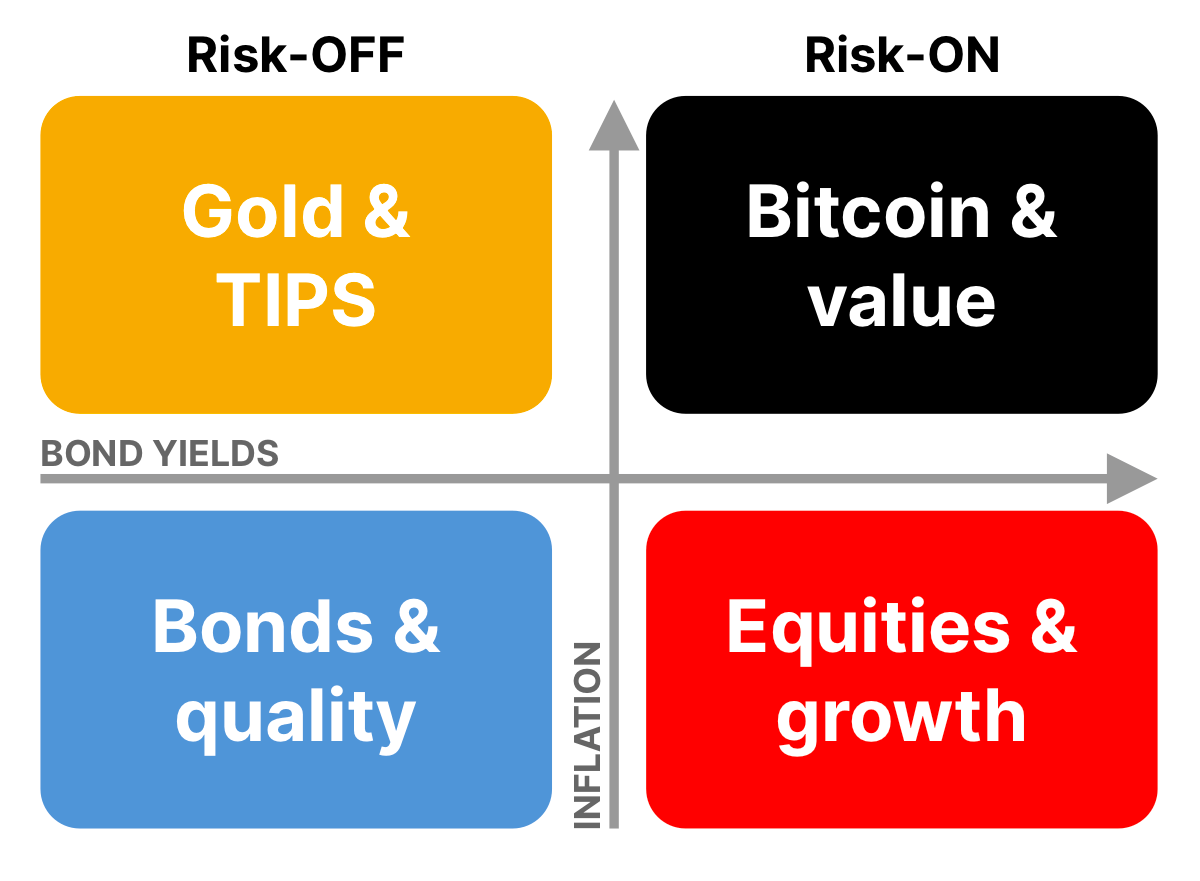
Hard assets (Bitcoin, gold, value) do best during times of inflation, and financial assets (equities and bonds) do best when inflation is under control. Safe assets, such as gold, quality and bonds, do best when the economy is slowing, while value and growth benefit more from a growing economy. By holding a little of everything, generally skewed according to the prevailing winds, our portfolios are well diversified.
A useful proxy comes from market indices that track value, momentum, quality and gold. I show this over 10 years relative to the market. Gold was strong until January, when it reversed. Growth has been strong over the past three months, while quality has lagged. For those with a financial sense of humour, you’d be surprised that value has done so well.
Equity Factor Groups Relative to the World Index
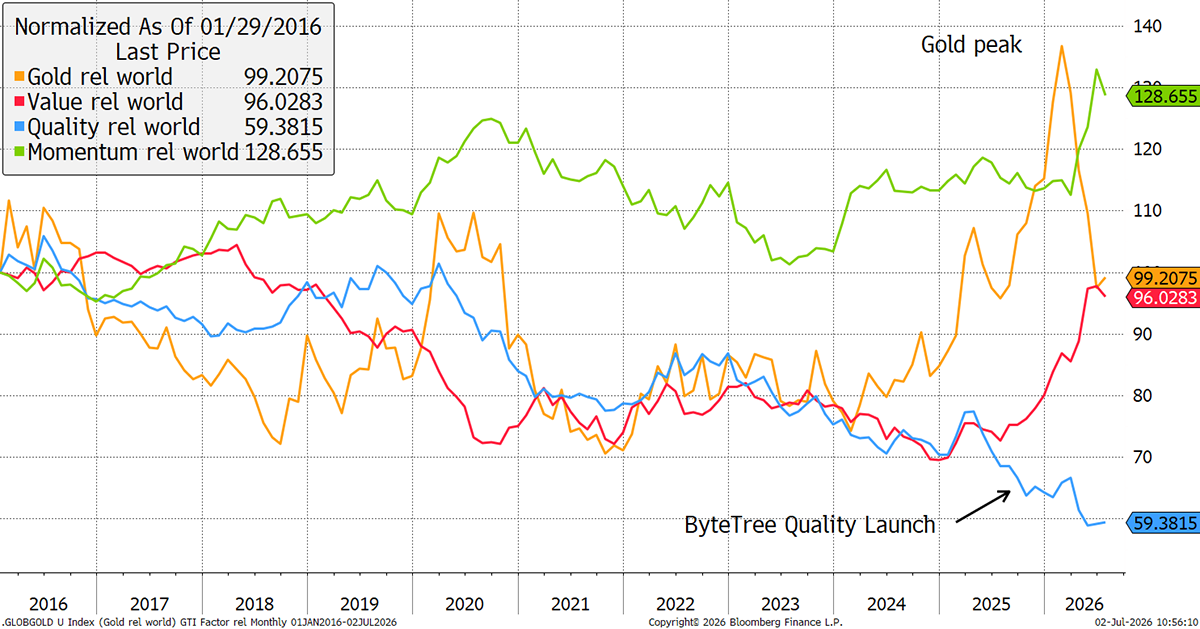
That is because semiconductors were classified as value stocks, as historically, they have been considered high-dividend-paying cyclical stocks. Of course, the market has repriced them as growth stocks. The last time that happened was in 1999, and we know what happened next.
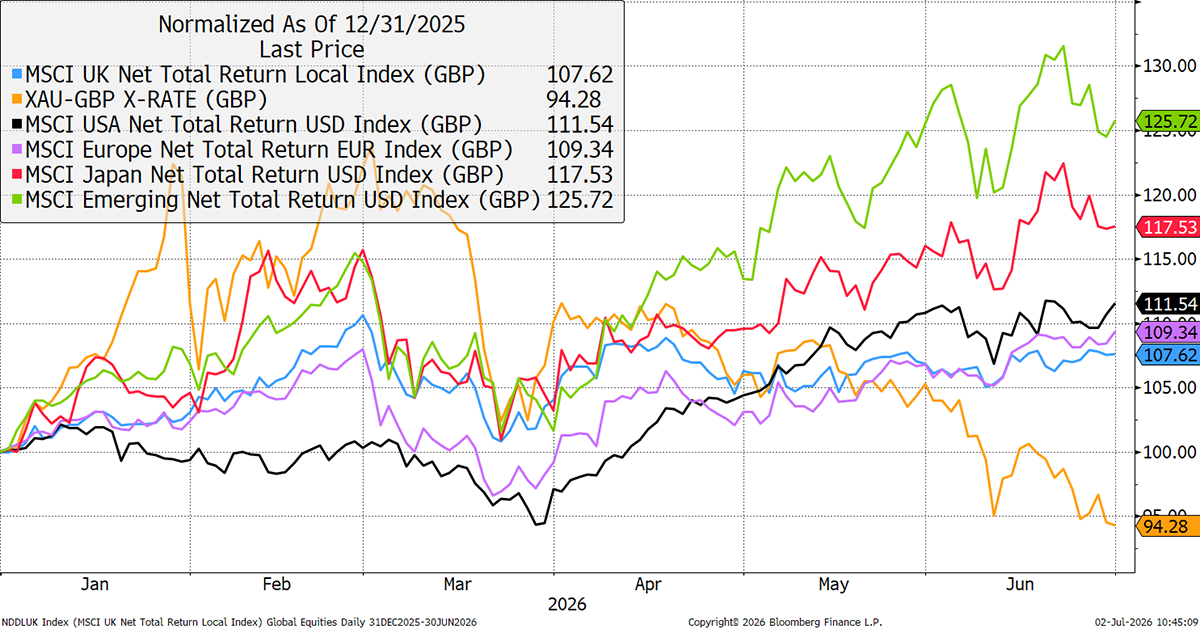
In 2026, emerging markets have done well because the index is heavily exposed to the chip sector through Taiwan and Korea. Japan has also had some exposure to the semiconductor trade. The US has led Europe and the UK since April, but not materially, while gold has slumped following a two-year surge.
Global Equities and Gold in 2026
I have recently embraced commodities, even more than normal, since the War began. Since last October, I have been reducing exposure to gold, gold miners, and silver following a strong run, but have held on to a core gold position in the Soda Portfolio.
I set out my long-term continued bullish reasoning for gold in last week’s Atlas Pulse. I have been writing Atlas Pulse on the gold market since 2012. What has kept me going are the common misconceptions.
In essence, gold acts as a reserve asset, and so long as the central banks are growing their reserves, demand for gold follows. This has picked up in recent years, and, on top of that, central banks have increased gold’s share of their reserves and reduced US treasuries. This pickup in reserve growth, combined with a higher share, has been a double whammy for gold.
Gold and Reserves
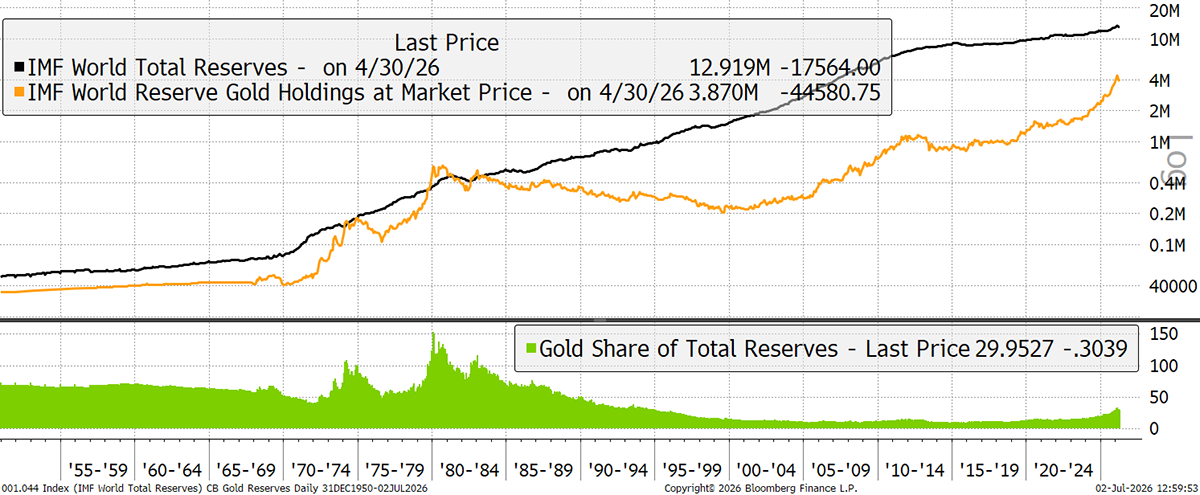
Reserve growth surged in the 1970s during the gold boom and cooled in the 1980s and 1990s during the bust. Reserves growth ran hard from 2000 to 2212, only to cool off and reaccelerate post-2018.
Yet, since the war in Iran, reserves have decreased, albeit slightly. This is likely from the Middle East, where there has been a short-term need for cash as tax revenues have fallen. With gold so strong, this became a reason for caution. But whatever the short-term factors, the long-term will always see reserve growth, which in turn drives gold. When we see the market stabilise, I am much more likely to add from here.
Commodities were expected to be a good diversifier away from gold and to have considerable relative value, while the war in Iran was expected to lead to supply shortages. Remarkably, despite a lifetime of hearing that it was the world’s chokepoint, it hasn’t. Inventories around the world have been used to fill the gap, while exports have risen from Russia, Nigeria, the USA, and others.
US inventories have been diminished to 1986 levels, but one observation is that their rate of decline has been between 1.5% and 2.2% per week since April. Yet these past two weeks have seen a decline from 2.2% to 2% to 1.2%. In other words, the rate of decline is declining.
US Oil Inventories inc. Strategic Reserve
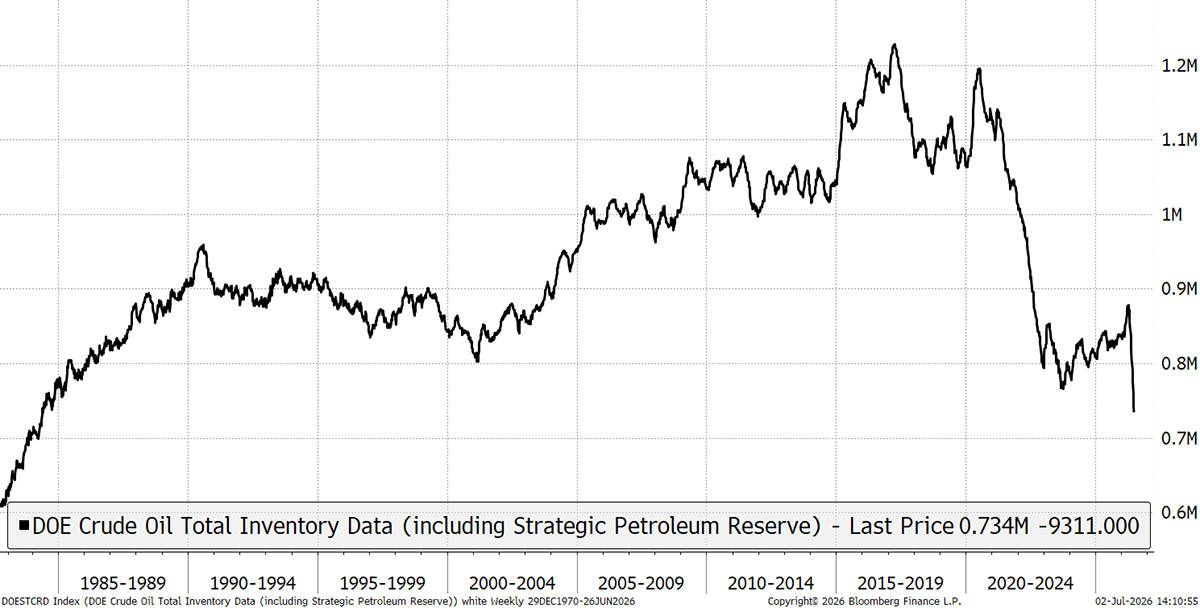
Perhaps this means we have just witnessed the greatest supply miracle in the history of capitalism. In just a few months, the global supply chains have adapted. More supply, diverted supply, while bridging the gap with inventories. Add to that a fall in demand as consumers have embraced electrification, alternative supplies, and other workarounds.
It could be that oil exposure should return to zero in the portfolio, and I will address that over the coming weeks. I would like to see the ships moving not just out of the Strait but returning as well. Then we will know the risk of an oil crisis is behind us.
Webinar: Q2 2026 Review
In this webinar, Charlie and Kit will review the second quarter of 2026 for the Whisky and Soda portfolios, as well as an update on the semiconductor surge, oil, Bitcoin, Gold, and Quality stocks. They will also give an overview of Q2 and an update on markets as they see them.
Join us for this live webinar on Wednesday, 8 July, at 12 PM BST by signing up using the link below.
The Multi-Asset Investor
The Multi-Asset Investor is a commentary and two portfolios, Whisky and Soda, that cover traditional assets. The portfolios are designed to be easy to replicate for investors managing their own money. Soda is low turnover and medium risk. Whisky is more dynamic and medium-high risk. It is written by Charlie Morris and updated weekly, with additional Flash Notes when immediate action is required.
The Whisky Portfolio
Whisky was doing well until late January, but has cooled off since. It is now 3.4% behind the FTSE 100 this year. That is not a great place to be, but I like our stocks and continue to change them when I no longer do. Most of the weakness has come from commodities, including gold stocks, grains, and oil. The quality stocks, which were a drag in Q1, are showing signs of strength. I am optimistic about this segment of the portfolio. The real problem has been not owning semiconductors and related AI investments, which drove the market higher.
After a 39% year in 2025, I suppose it was inevitable that 2026 would be challenging. That was rather like the spectacular 2020, which was followed by a soft 2021. That was another bubble year where I chose not to participate, and the underperformance followed. I need to learn to fall in love with bubbles rather than giving them a wide berth. But I don’t avoid them entirely, just lightly.
Whisky vs FTSE 100
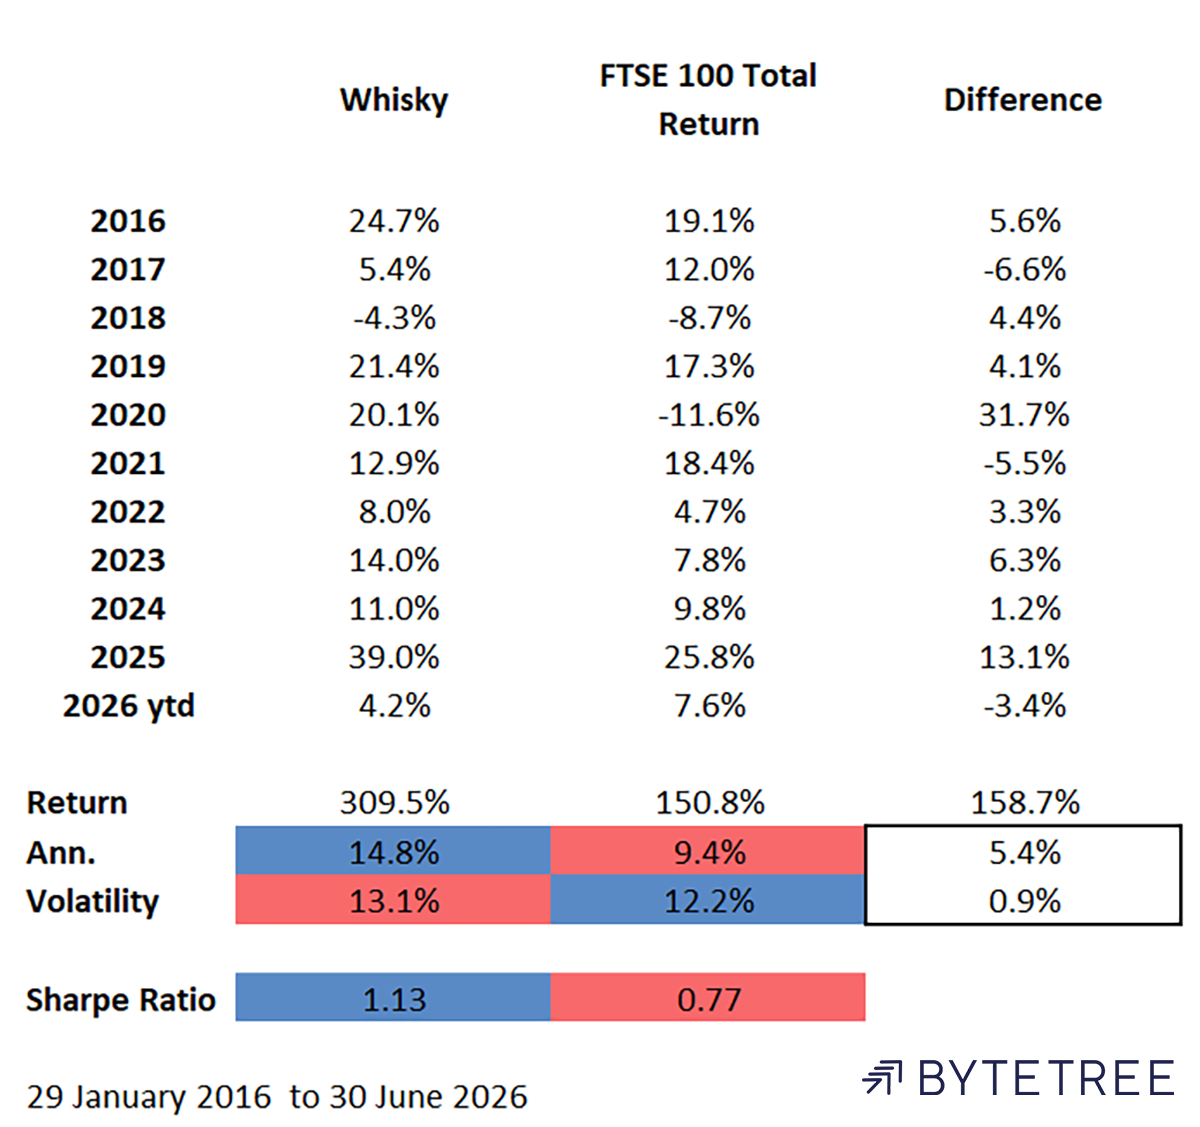
Still, the longer-term record remains robust, with higher returns and higher risk-adjusted returns.
In Q2, there were sales in Glencore, Hiscox, Harbour Energy, and blockchain equities. These had done well, especially Glencore. There were many more purchases, including Berkshire Hathaway, two banks, an airline, and other value situations.
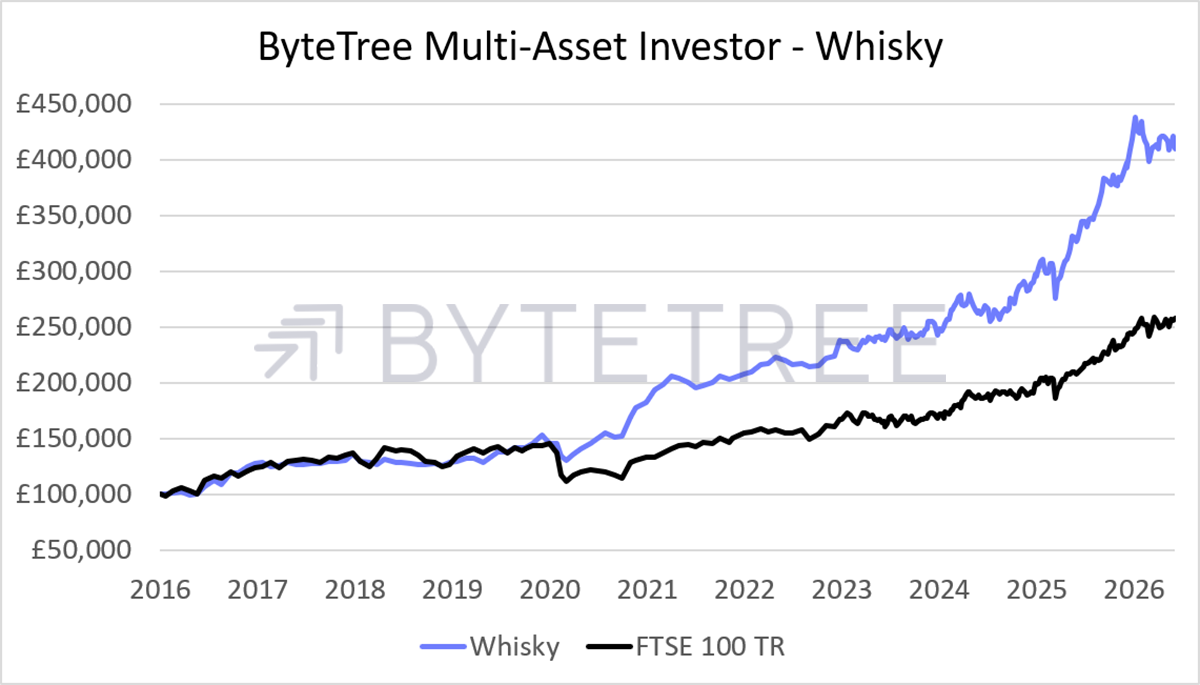
That performance comes to life in the chart below. The best year relative to the market was 2020, when Whisky rose and the FTSE slumped. It is during these darkest periods when a capital-preservation-first approach can have the best long-term payoff.
Whisky Portfolio Performance
The Soda Portfolio
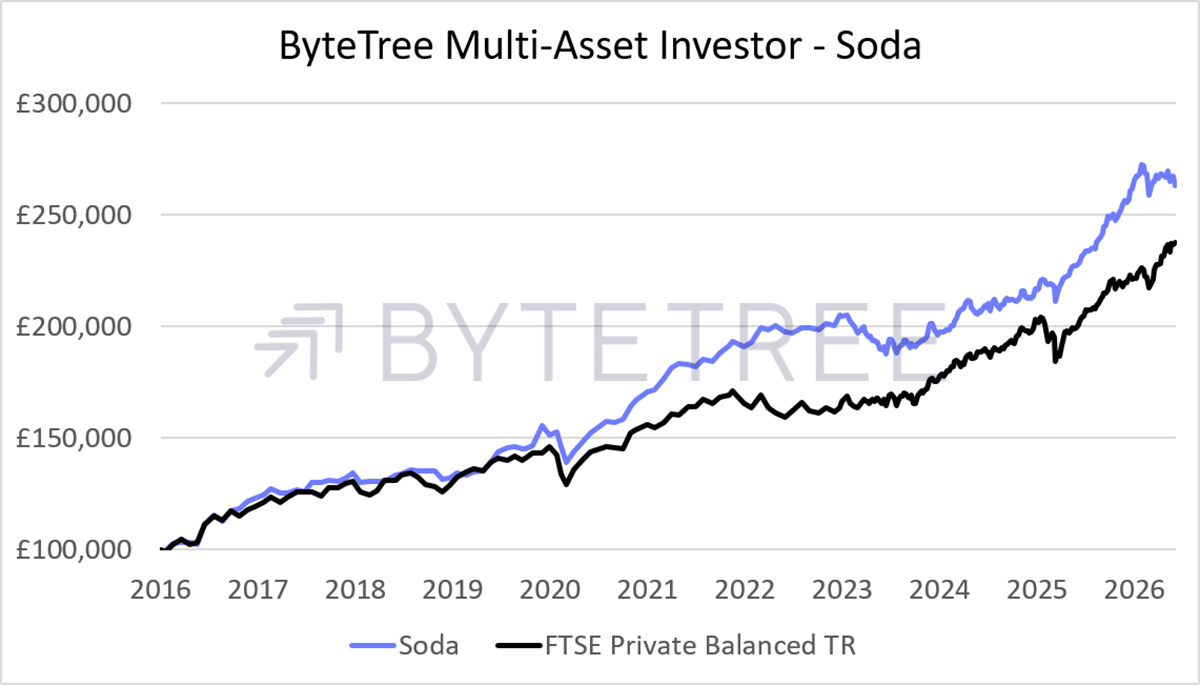
Soda has also lagged this year, once again by holding conservative assets, such as commodities and gold. It is 5% behind the balanced index, which is quite depressing. The index is heavily skewed towards US equities, which has made it difficult to beat in some years and easier in others.
Soda vs FTSE Private Balanced Index
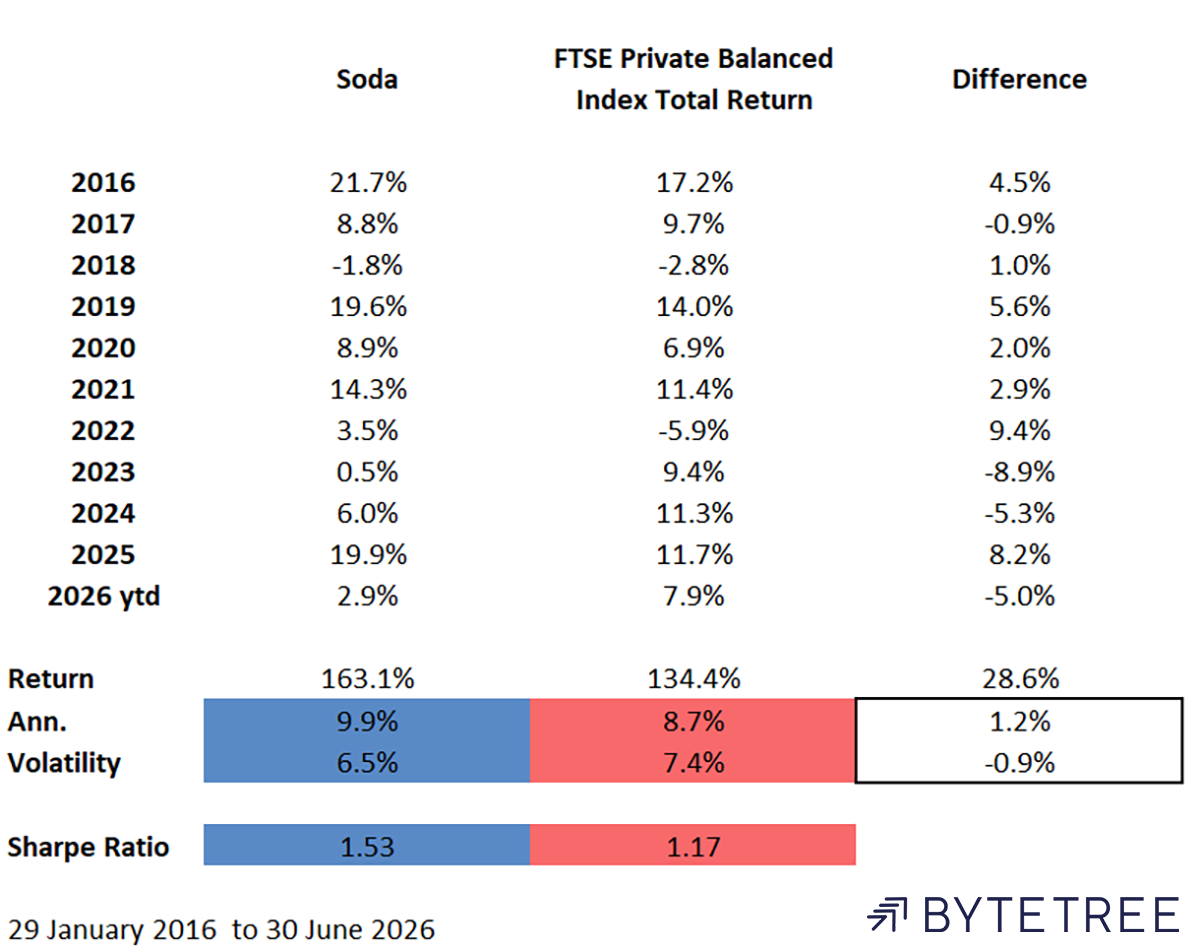
The shift towards quality investing hasn’t helped, but I am confident that it will. Gold and commodities have proved to be a drag. I also added Emerging Markets internet stocks in April, as a candidate to match the tech rally. Emerging Markets flew, but it was hardware rather than software or the internet that was fruitful. Furthermore, the value strategies were slow, as were the diversified funds, except RIT Capital. Thanks to them, at least we owned some SpaceX.
The longer-term performance is still good, but will really come to life when the US equity bull finally ends. It keeps on nearly happening, but each time it gets another shot in the arm.
Soda Portfolio Performance
I have always prioritised capital preservation over investment gains and will continue to do so. I have no doubt that when the market froth cools, good old-fashioned value investing will drive returns.
Visit our website to learn more about The Multi-Asset Investor and how to become a client.
ByteTree Quality
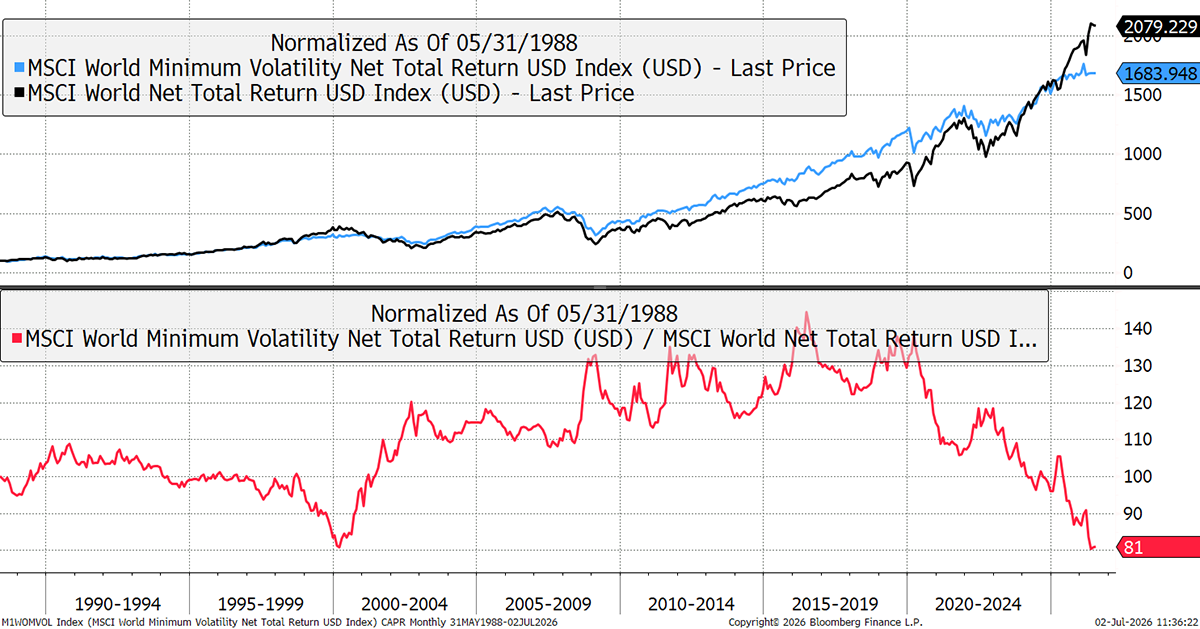
Last September, Kit Winder and I launched the ByteTree Quality Portfolio. The idea was to buy great large companies with strong market positions, stability, and high returns. These are the things long-term investors desire, because with the best companies, you can buy and hold.
Using low-volatility stocks as a proxy, you can see how much these have lagged the market since 2015, which is the same signal given between SPW and SPX earlier. In just six years, the world’s greatest and most established companies have fallen behind, just as they did in 1999.
Quality Proxy (Low Volatility Stocks) vs the World
Starting the Quality Portfolio last October might look early, but it has taken these last 10 months to build it. I am delighted to say that ByteTree Quality is now 94% invested, holding 24 stocks with one more to go. Kit does most of the hard work on Quality, while I provide the strenuous role of oversight. He has written detailed notes on each company, explaining why they have a long-term competitive advantage. As he has gained experience, the notes have gotten better and better.
The Whisky Portfolio focuses on value and momentum, meaning our companies aren’t necessarily the greatest, but they are undervalued. The Venture Portfolio is similar. As the cheap companies return to fair value, the hope is that investors make outsized gains.
In contrast, the Quality Portfolio buys companies that will hopefully beat the market by compounding at a higher rate – Buffett style. It has been a fabulous journey, and we only have one more stock to go. Some might say we started too early, but we are skating to where the puck will be, rather than where it is, and given it takes nearly a year to get going, I feel our timing has been perfect.
There has been some overlap between Whisky and Quality in a few stocks, but this is unlikely to remain the case over time. However, in the short term, these are the stocks that I am very happy to own. From Q3 2026 onwards, we will have a separate quarterly review for the Quality Portfolio, with transparent performance measurement.
Visit our website to learn more about ByteTree Quality and how to become a client.
ByteTrend
Another project that will soon come to fruition at ByteTree is the upgraded ByteTrend. We have built a global stock database, which shows the trends for over 2,500 companies. It is a significant improvement to the previous site, ByteTrend.io, and will be launched in the late summer.
It can be used to find semiconductor stocks and other stocks racing ahead, just as it can be used to find value stocks and new trends and investment themes in the market. In that sense, it is a powerful market intelligence tool. I am looking forward to sharing it with you as soon as it has passed rigorous testing.
Outlook
The quarter hasn’t been one of my finest, but nothing has changed. I still like gold and hunting for undervalued stocks. Sometimes, that doesn’t work, but fortunately for ByteTree clients, most of the time it does.
Please let me know your thoughts by emailing me at charlie.morris@bytetree.com or tweeting me @AtlasPulse.
Many thanks,
Charlie Morris
Editor, The Multi-Asset Investor
General - Your capital is at risk when you invest, never risk more than you can afford to lose. Past performance and forecasts are not reliable indicators of future results. Bid/offer spreads, commissions, fees and other charges can reduce returns from investments. There is no guarantee dividends will be paid. Overseas shares - Some recommendations may be denominated in a currency other than sterling. The return from these may increase or decrease as a result of currency fluctuations. Any dividends will be taxed at source in the country of issue.
Funds - Fund performance relies on the performance of the underlying investments, and there is counterparty default risk which could result in a loss not represented by the underlying investment. Exchange Traded Funds (ETFs) with derivative exposure (leveraged or inverted ETFs) are highly speculative and are not suitable for risk-averse investors.
Bonds - Investing in bonds carries interest rate risk. A bondholder has committed to receiving a fixed rate of return for a fixed period. If the market interest rate rises from the date of the bond's purchase, the bond's price will fall. There is also the risk that the bond issuer could default on their obligations to pay interest as scheduled, or to repay capital at the maturity of the bond.
Taxation - Profits from investments, and any profits from converting cryptocurrency back into fiat currency is subject to capital gains tax. Tax treatment depends on individual circumstances and may be subject to change.
Investment Director: Charlie Morris. Editors or contributors may have an interest in recommendations. Information and opinions expressed do not necessarily reflect the views of other editors/contributors of ByteTree Group Ltd. ByteTree Asset Management (FRN 933150) is an Appointed Representative of Strata Global Ltd (FRN 563834), which is regulated by the Financial Conduct Authority.
© 2026 ByteTree Group Ltd