


Gold Super Bull Resumes

Atlas Pulse Gold Report - Issue 116;
The recent price action of the gold super bull thesis has gotten me very excited about this issue. Gold measured in the long bond has turned the corner.
The gold price correction from January can be attributed to several things, not least, the market was overdone. Yet the ByteTrend Score for gold in bonds has turned up. Gold is doing its job but is proving resilient in the face of another bond crisis.
What happened to Trump’s expected rate cuts? When bond yields are below interest rates, we can expect cuts, but when they are above, hikes become more likely.
Gold and the US Dollar
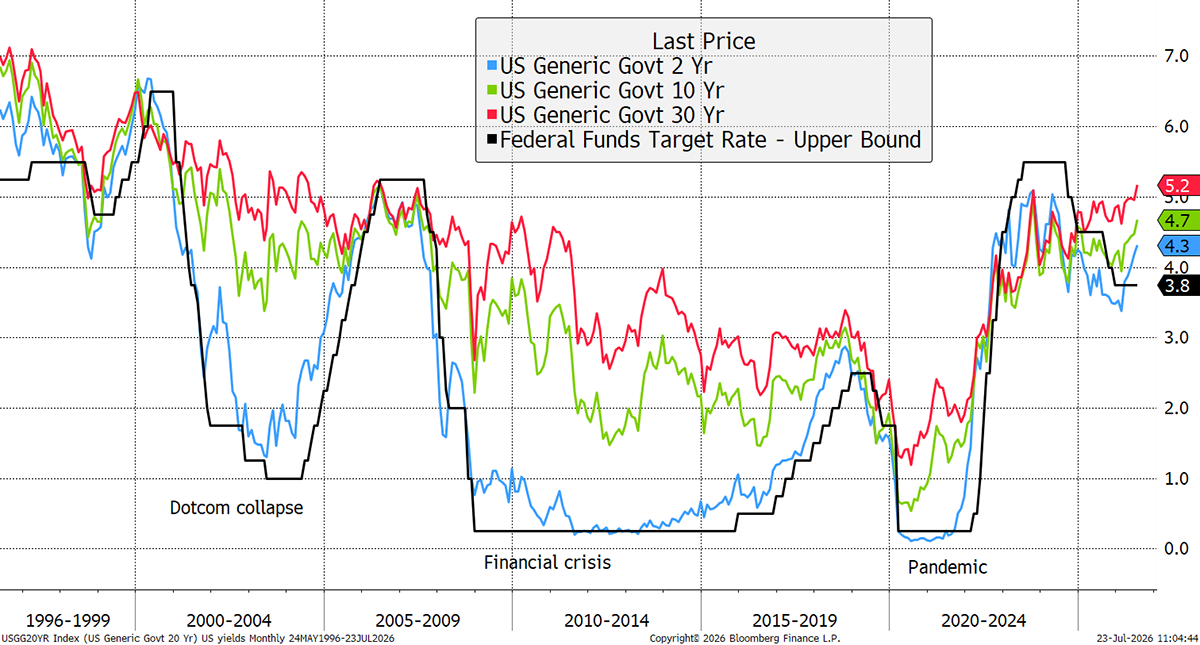
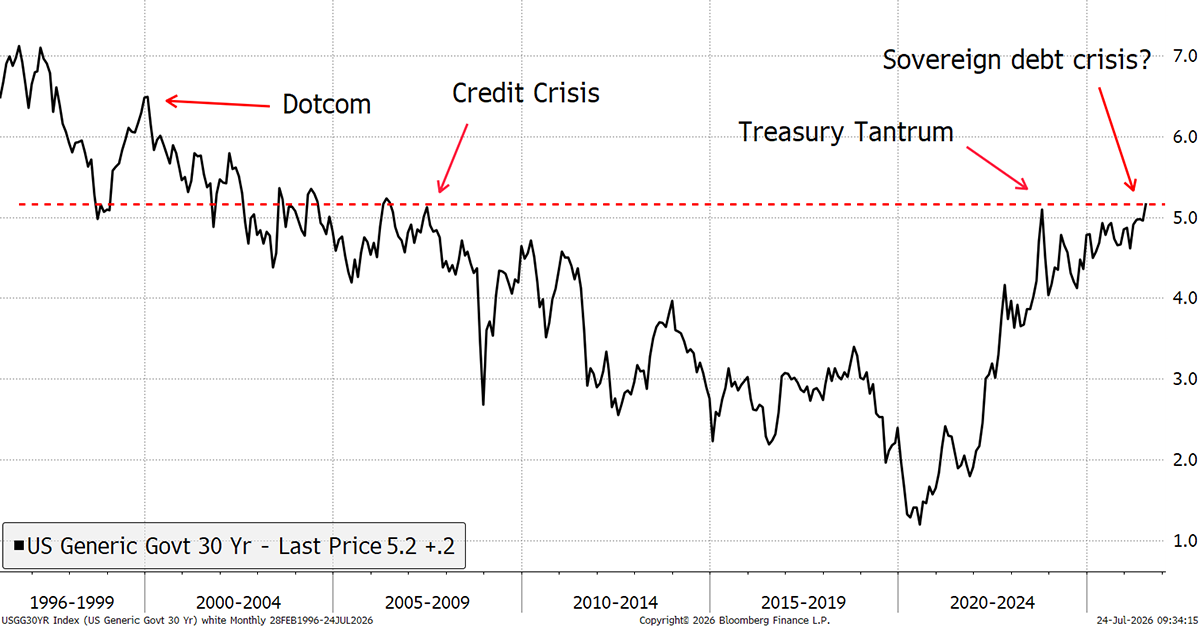
The long bond is leading yields higher, and back to 2006 levels. Easy money tends to cure all ills in financial markets, in contrast to tight money, which becomes a wrecking ball. The stockmarket peaked in 2000 and 2007, and both peaks came after a surge in bond yields. There was another tantrum in October 2023, and you can’t blame the UK PM, Liz Truss, for that because she came a year earlier. The equity bull market did not resume until yields turned down. Then today, even after lower inflation data and promises of rate cuts, the long bond yield trades at the highest level since 2006.
The US Long Bond Yield
Little wonder that savvy investors and the central banks are reducing exposure to bonds in favour of gold. In terms of asset allocation, I have always considered gold an alternative to bonds because it is a form of money. That is a resilient form of money which is at its best when all else comes into question.
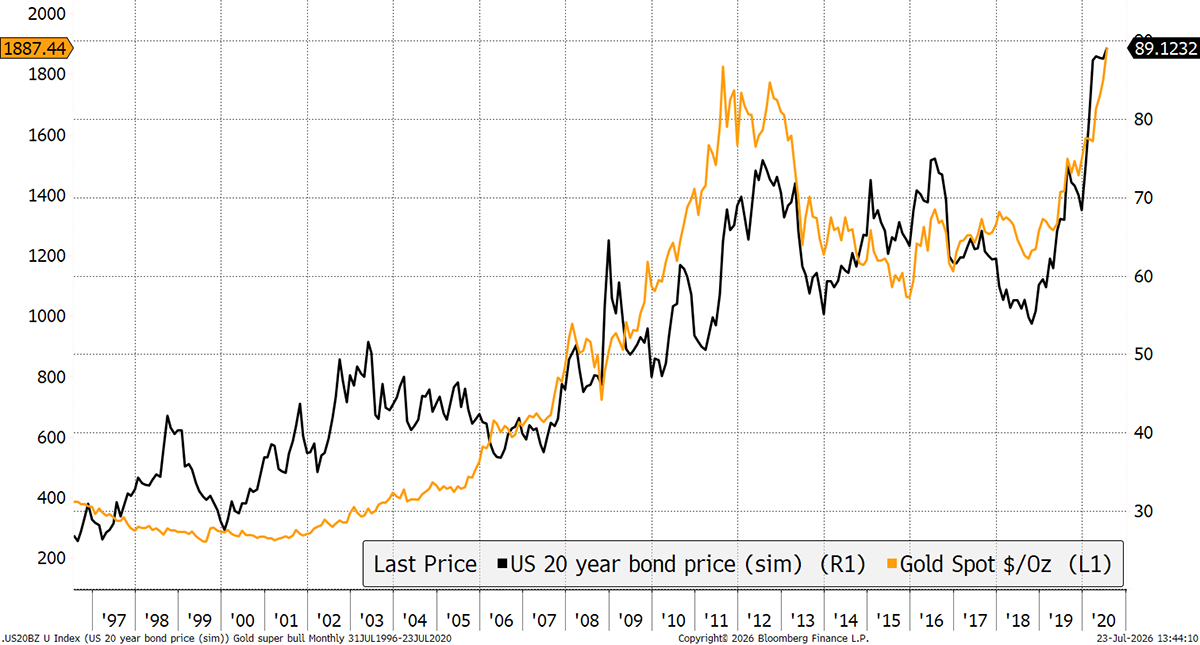
In January 2015, I coined the term “super bull” to describe gold’s new regime. The thesis was that gold has tended to perform very well when the bond market goes wrong. This is despite the fact that when the bond market is well behaved, the gold price tends to mimic it. I show the long bond and gold between 1996 and 2020.
Gold and the Long Bond – 1996 to 2020
You could be mistaken in thinking that gold always trades like a bond. Going back to the 1970s and adding the past five years tells a different story. Bonds collapsed in the 1970s, when gold roared, and again in the 2020s. On both occasions, gold didn’t simply have a bull market that followed a bond bull market, but a super bull, which countered a bond market collapse.
Gold and the Long Bond – 1970s to 2026
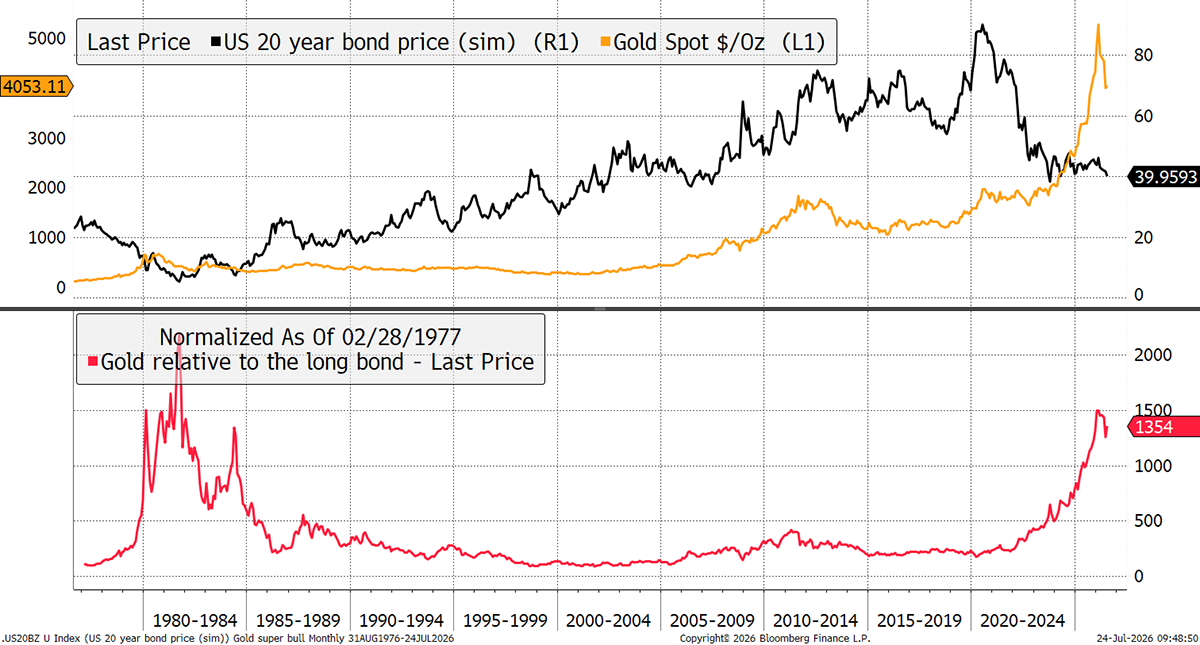
The super bull shows up in the red line, which shows the price of gold measured in the long bond. On this basis, the 2000 to 2011 bull market was not nearly as notable as the super bulls in the 1970s and recently.
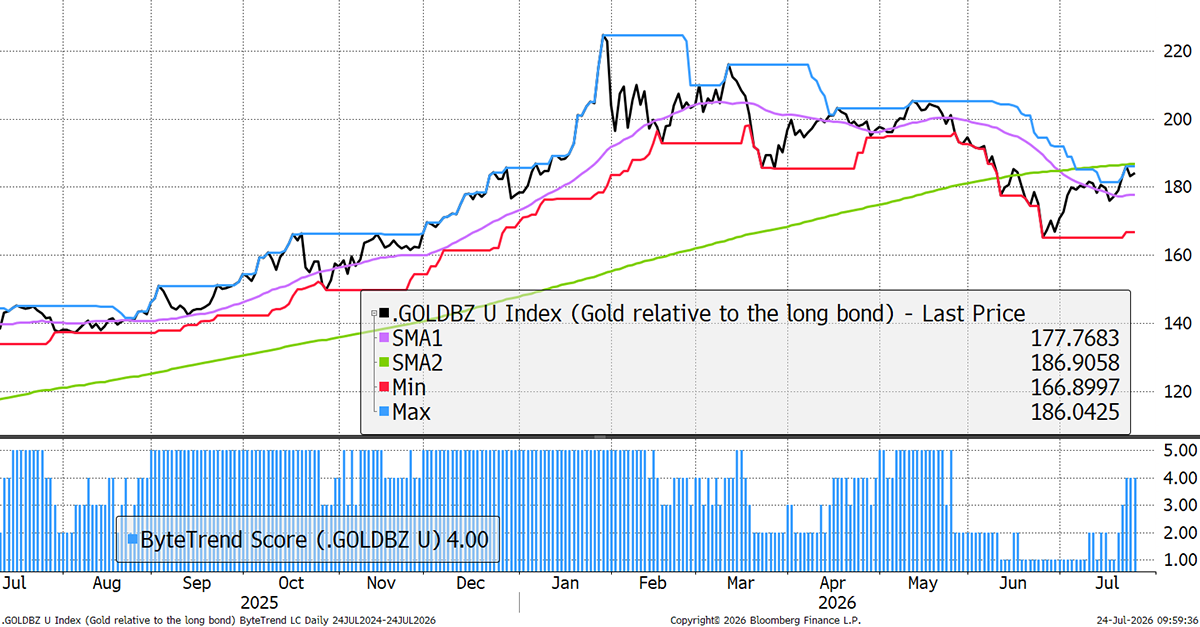
The recent price action of the gold super bull thesis is what has gotten me so excited for this issue. Gold measured in the long bond has turned the corner. The gold price correction since January can be attributed to several things, not least, the market was overdone. Yet the ByteTrend Score for gold in bonds has turned up. Gold is doing its job but proving resilient in the face of another bond crisis.
Gold vs the Long Bond
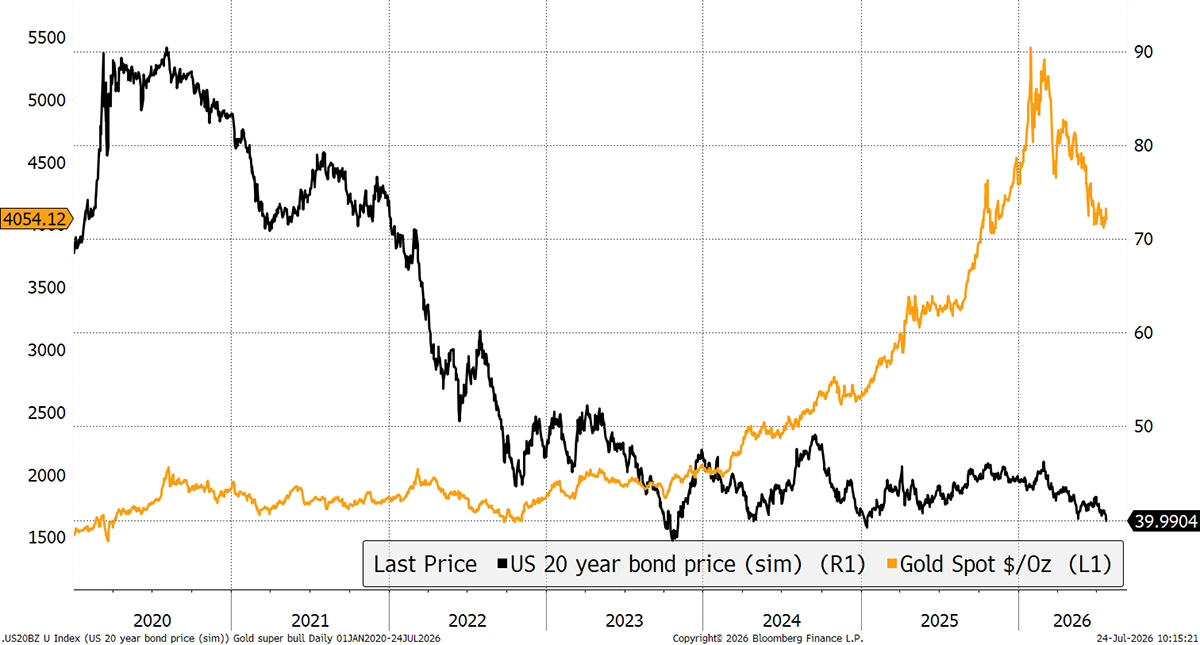
My last chart on this theme looks closely at the post-pandemic bond bust. Bonds peaked on 4 August 2020, two days ahead of gold. The long bond then fell by 58% into the 2023 Treasury Tantrum while gold eased back just 7%. The gold bull took off once bonds stabilised, and not before. Indeed, in 2026, we have seen bonds turn down from late February, and already, gold is starting to stabilise.
Gold vs the Long Bond – from the Bond Peak in 2020
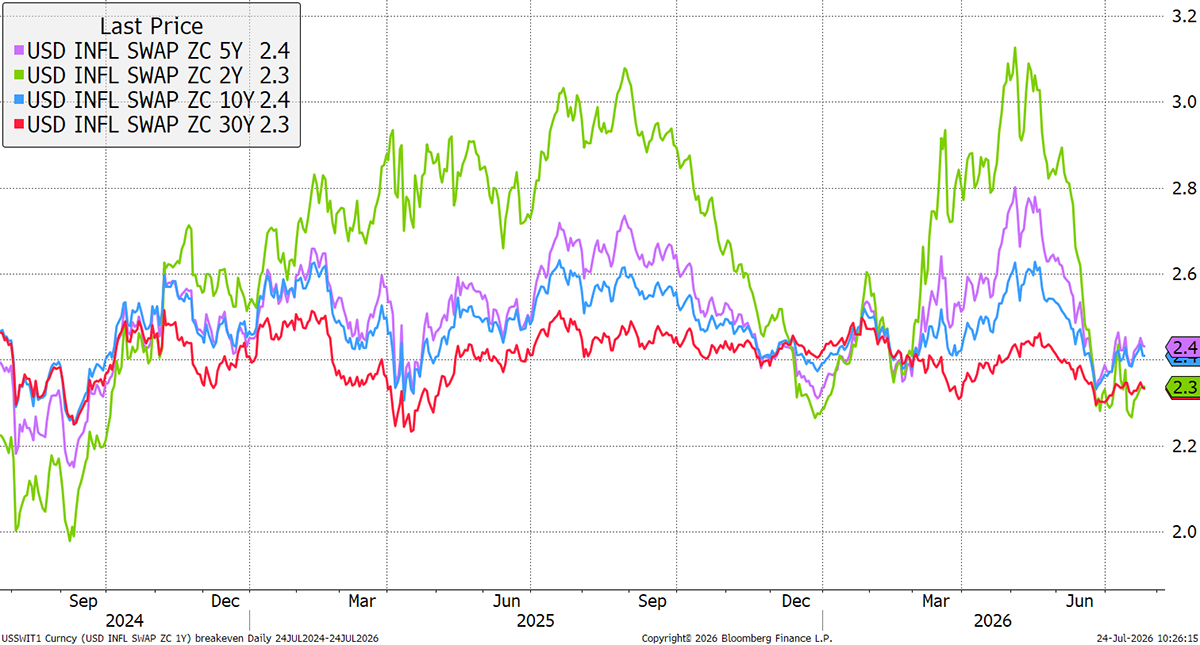
It could be that the bond market smells inflation, but as usual, it isn’t showing up in breakevens, which show expected future inflation derived from the price of TIPS. No doubt it will one day, but we have been waiting for several years, and it never seems to happen.
US Inflation Expectations
This time the latest CPI print came in soft, as oil slipped back to $70. But in just a few weeks, it’s already back at $100, so don’t expect soft CPI data to last. It is harder to imagine the next few years without an inflation shock than with one. After all, electricity demand is set to soar, well ahead of supply, just as supply chains, tariffs, and conflict continue to disrupt.
The 1970s Inflation Analogue
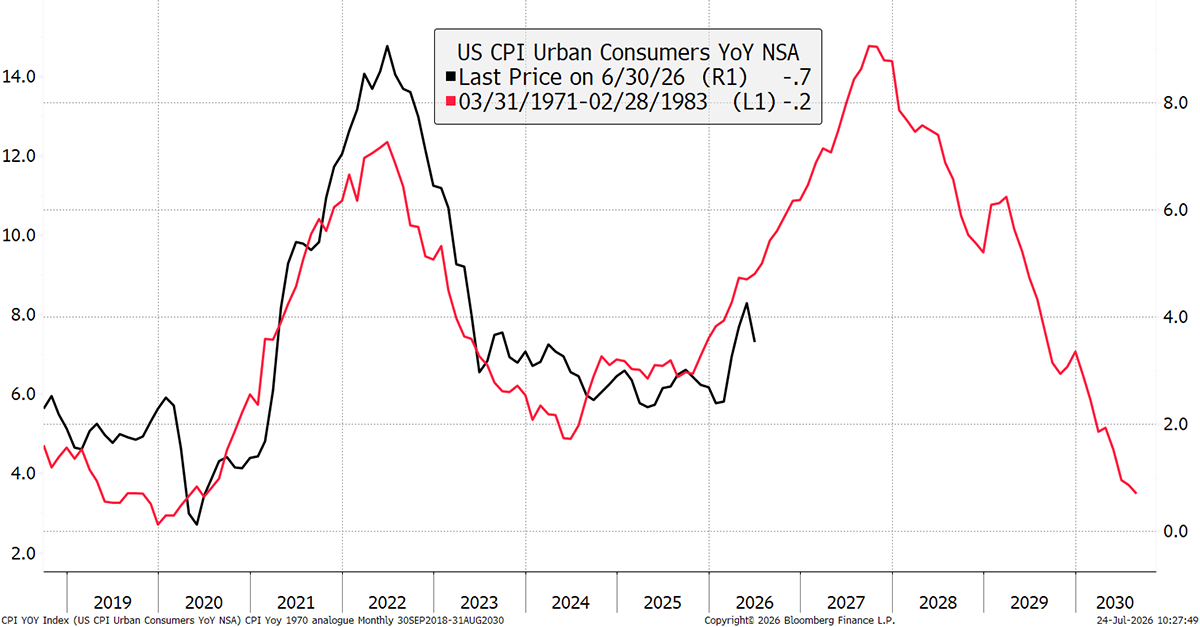
And of course, the US public debt is on the verge of reaching $40 trillion. The interest bill is around $1 trillion in 2026. This crowds out other public spending, puts upward pressure on taxes, and makes the economy unstable. There is no end in sight. No politician will do anything about this until there is a full-blown crisis.
USA Government Debt and Nominal GDP
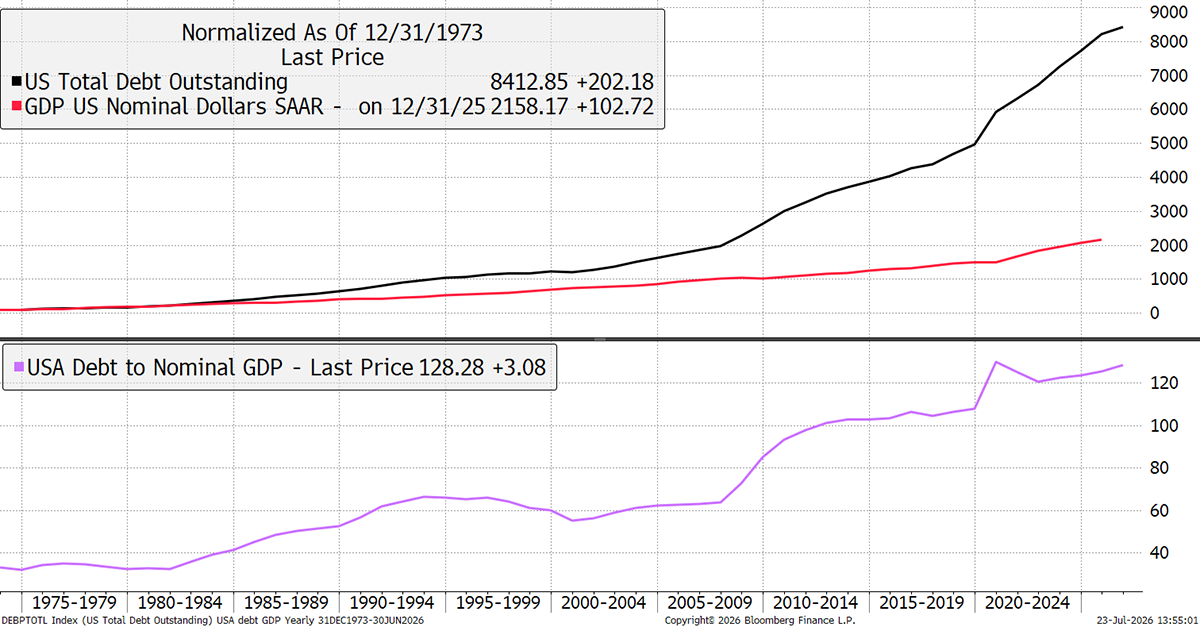
The answer is to own gold and perhaps top up the next time the bond market stabilises. That could be imminent, or this latest selloff may have further to go. The point is to buy the dips in this bond crash. Don’t buy bonds on the bond dips; buy gold.
Bitcoin
Alternatively, hold some Bitcoin alongside your gold. Bitcoin has had a rough year, but the worst appears to be over. There is some sort of four-year cycle in Bitcoin, and that ought to be turning up soon, and probably already has.
Bitcoin vs Gold
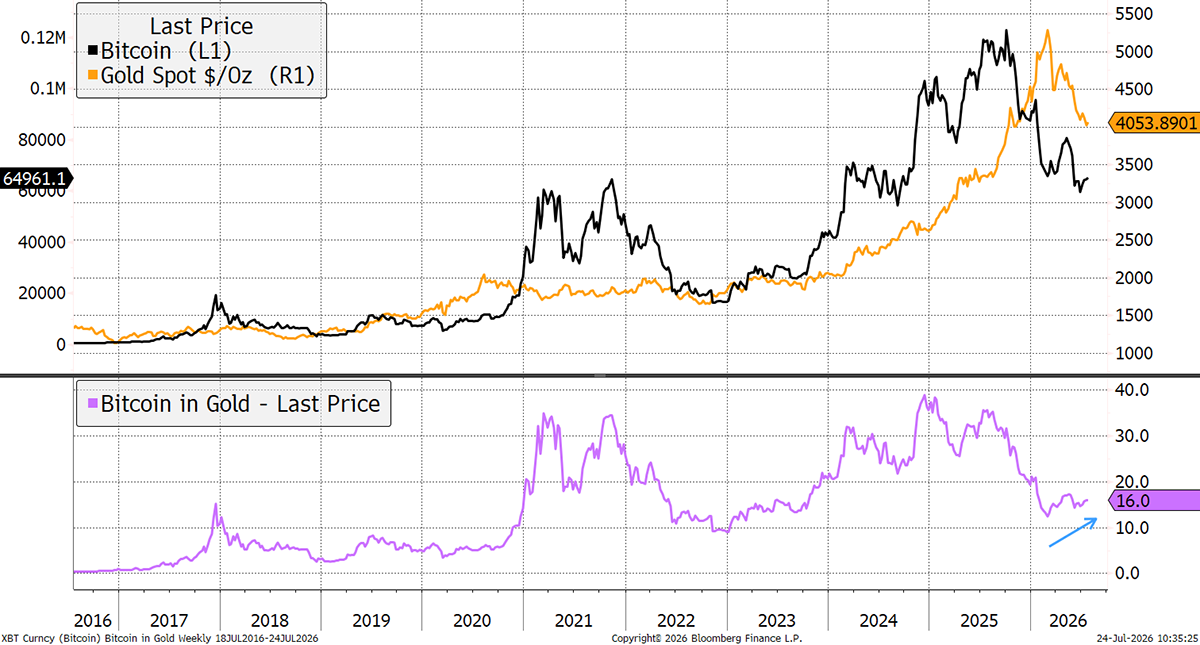
Both assets lie at the heart of the debasement trade, and that is why I created the BOLD strategy. Over five years, gold is up 126.3%, and Bitcoin is up 83%. Both are ahead of global equities, which have managed 68.8%, including dividends. Remarkably, BOLD towers above all despite only holding Bitcoin and gold with no leverage. This demonstrates the power of risk weightings and regular portfolio rebalancing. BOLD was made for this era.
Bitcoin, Gold, Equities, and BOLD – Five Years
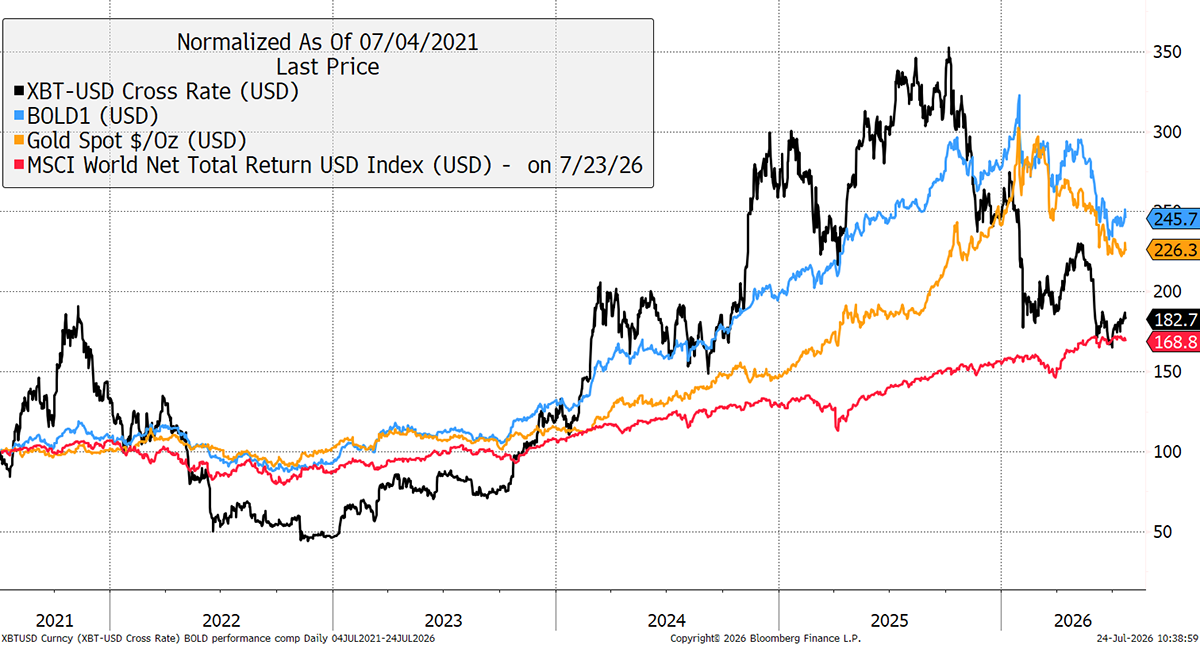
You can follow BOLD’s Bitcoin and Gold weights for free on our website, BOLDETF.com. For BOLD product details on the 21Shares Bitcoin Gold ETP (ticker BOLD in Europe), please visit 21Shares, and for our strategy information, please see our latest presentation.
Summary
The gold super bull is alive and well, and the low may even be in. The key is that gold will protect investors from the worst of the bond turmoil, but the big money in gold will be made whenever bonds stabilise.
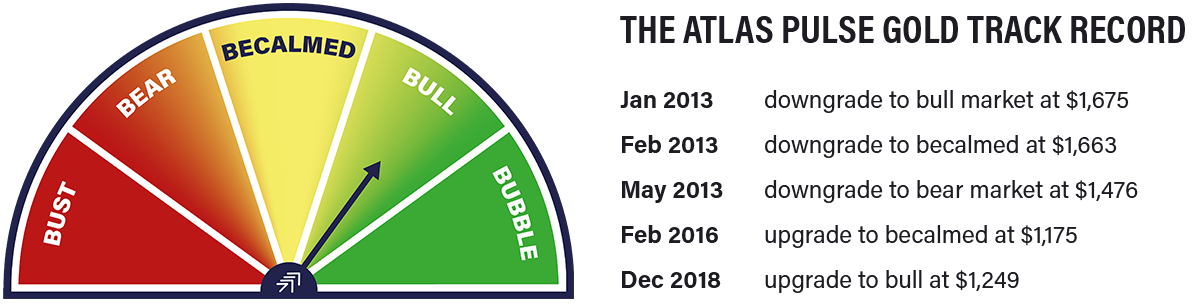
Thank you for reading Atlas Pulse. The Gold Dial remains in Bull Market.
Charlie Morris is the Founder and Editor of the Atlas Pulse Gold Report, established in 2012. His pioneering gold valuation model, developed in 2012, was published by the London Bullion Market Association (LBMA) and the World Gold Council (WGC). It is widely regarded as a major contribution to understanding the behaviour of the gold price.
Please email charlie.morris@bytetree.com with your thoughts.


