


A Technical Look at Gold

Atlas Pulse Gold Report - Issue 114;
It’s anyone’s guess what happens next, but the technical picture remains constructive. A fall below the 200-day MA would be unhelpful, but there is strong underlying support for gold during these uncertain times.
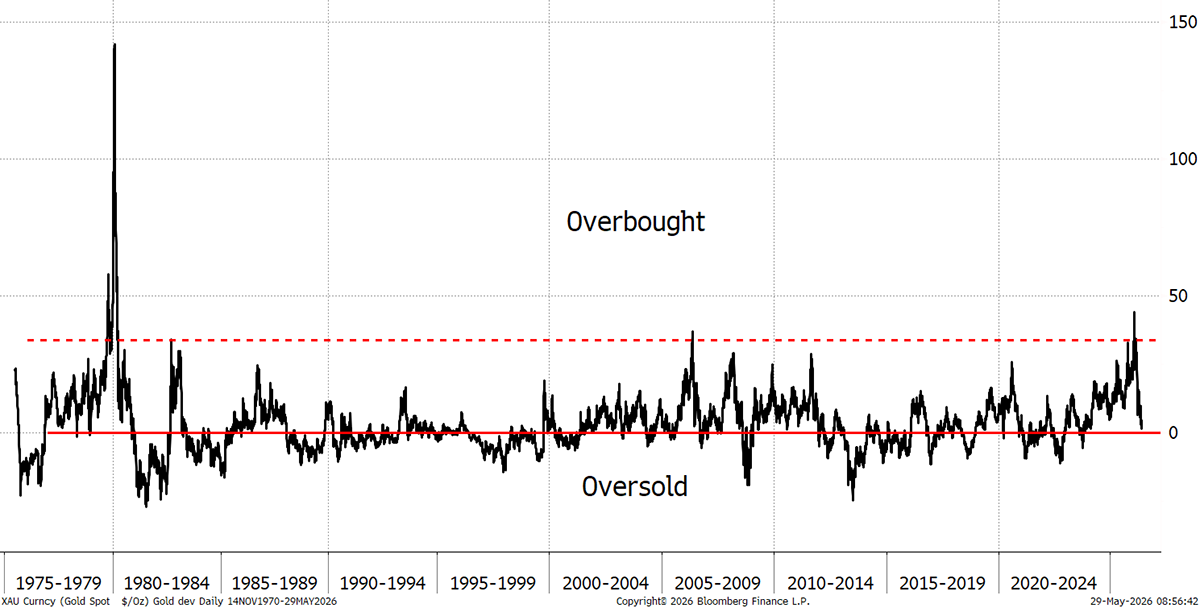
Having been significantly overbought in January, the price of gold recently revisited its 200-day moving average (MA), meaning the market has cooled. This hit the headlines in the financial press this week, but curiously, the price didn’t close below that key level and promptly bounced.
Gold Deviation from Trend
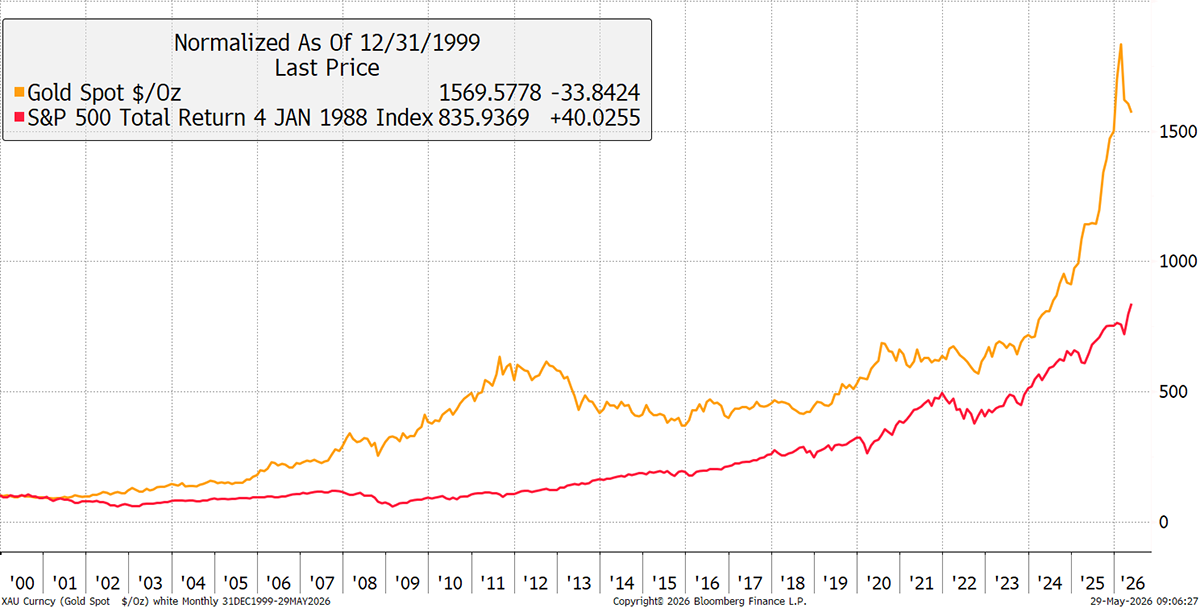
A simple point that few seem to acknowledge is that the price of gold has done twice as well as the S&P 500 in the 21st century, even when including dividends.
Gold vs the S&P 500 Total Return (inc. dividends)
In this issue, I will explore the technicals behind the gold price, which are far from normal, using our ByteTrend charts to illustrate the short-, medium- and long-term trends. If you are unfamiliar with the ByteTrend 0-5 scoring system, ByteTrend scores a point if:
- The price is above the long-term moving average (200-week).
- The price is above the short-term moving average (30-week).
- The long-term moving average is rising.
- The short-term moving average is rising.
- The price last touched max on the 20-week max/min lines.
The higher the score, the stronger the trend.
For a more in-depth explainer on ByteTrend, please take a look at our user guide.
The Short-Term Trend
The intraday chart would indeed show the gold price moving below the 200-day MA (green), but not the close. That MA is still positively sloping. The price is settling around the $4,500 zone, first tested late last year. Notice how the 20-day min/max lines (blue, red) are close together, having previously been far apart, as volatility is cooling. The 30-day MA (purple) is negatively sloping.
Gold’s Daily ByteTrend Score – Past Year
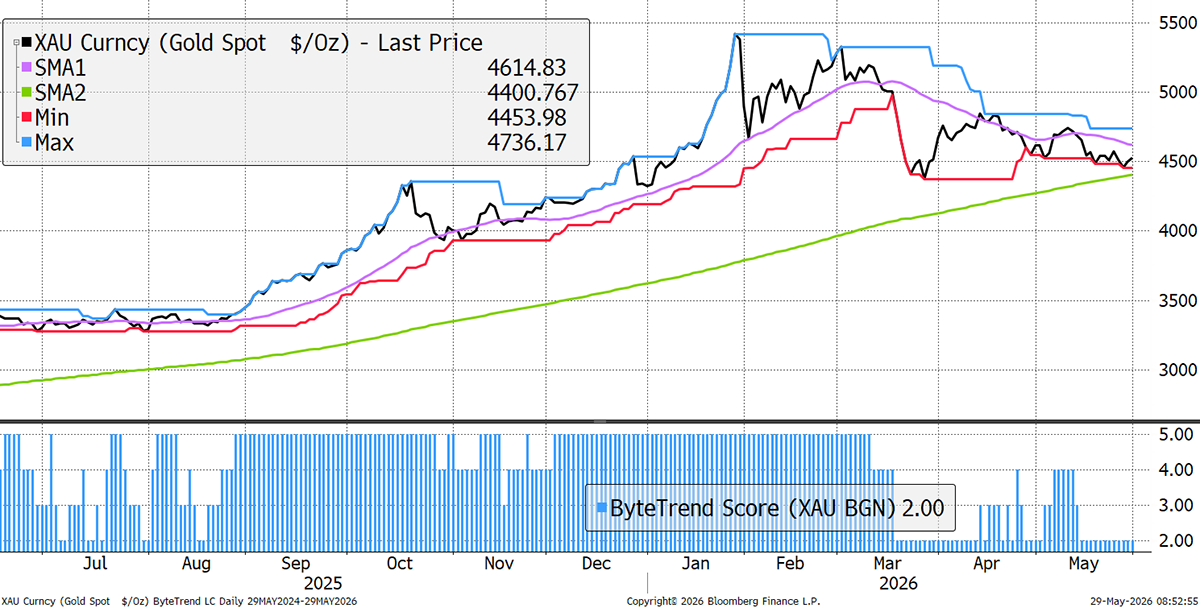
Since the price is above the 200-day MA and it is upward-sloping, the ByteTrend score gets two points. The 30-day MA is negatively sloping, the price is below it, and the last max/min touch was a min, so the shorter-term measures score zero points. Overall, the current daily ByteTrend score for gold is 2. This means a short-term correction within a medium-term uptrend.
Since I mentioned it, I’ll show gold’s volatility over the past 30-, 90-, 180- and 360- days. All of the timeframes have risen during the price surge and subsequent correction, as gold’s daily price swings have increased. Yet the 30-day volatility has recently fallen sharply, which implies the other measures will follow once the correction is flushed out.
Gold Volatility
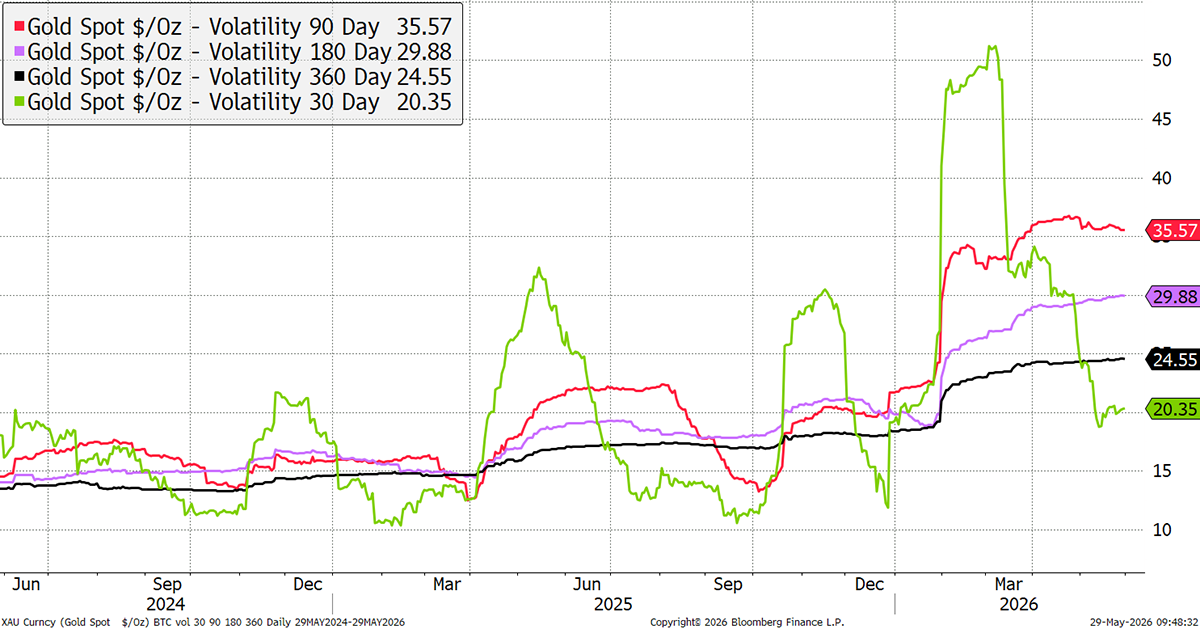
Gold can rally with or without volatility. However, the lower volatility rallies have unquestionably proved to be more durable.
The Medium-Term Trend
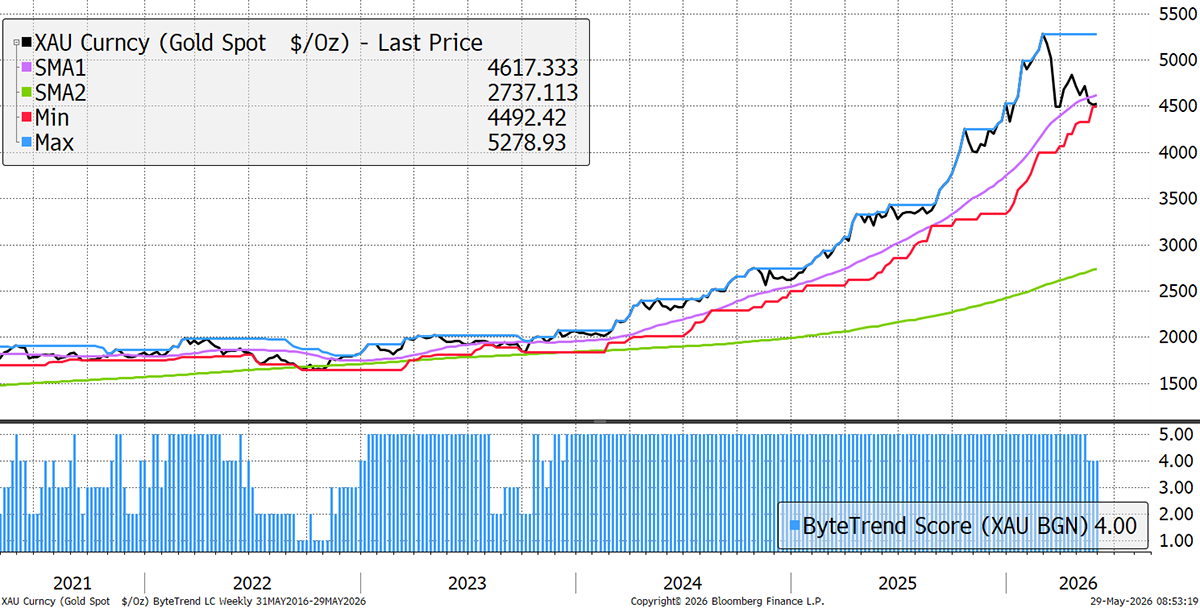
Shown over five years, it is easy to forget how gold traded below $2,000 pre-2024, reaching $5,500 this year, which is one hell of a move. For the medium-term trend, the 200-week MA (green) is upward-sloping, as is the 50-week MA (purple). The price is clearly below the 50-week MA but is yet to move below the 20-week min (red). The max remains at the all-time high, which was set 13 weeks ago. As a result, with the only chart fault seeing the price below the 30-week MA, the weekly ByteTrend Score is 4.
Gold Weekly ByteTrend Score – since 2021
The Long-Term Trend
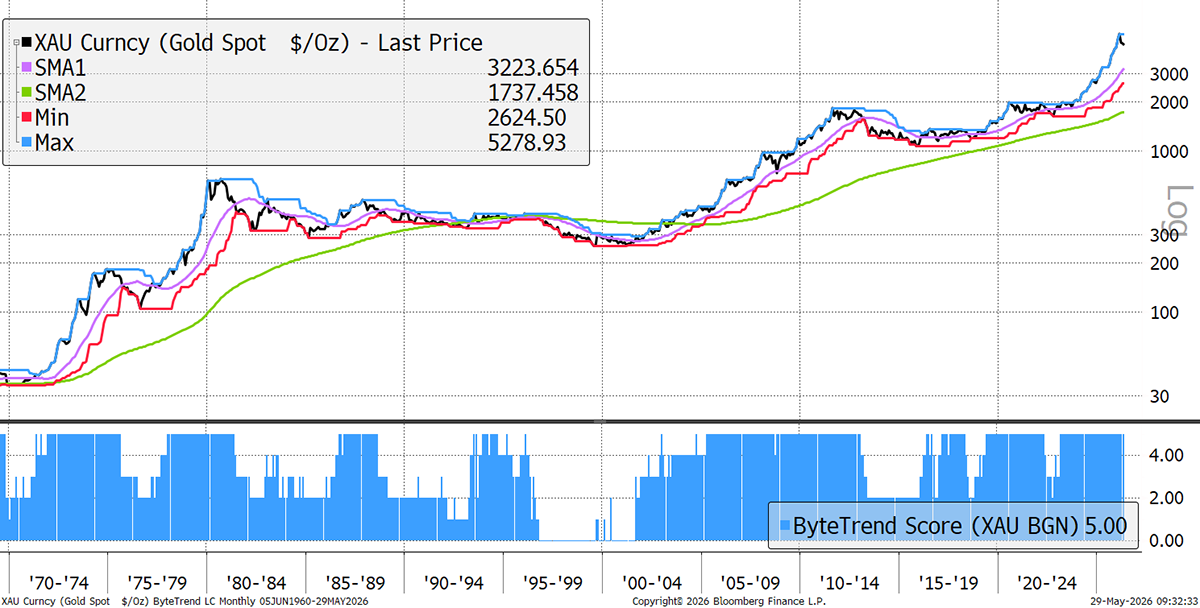
The long-term trend, as measured by the 200-month MA, the 30-month MA, and the 20-week max min, remains in an uptrend. I have taken it back to 1970 and shown it in log, which makes the 1970s stand out. The monthly ByteTrend score is a firm 5. For that to downgrade, the price would need to fall below $3,326, where the 50-month MA resides.
Gold Monthly ByteTrend Score – since 1970
Outlook
I emphasise the short-, medium- and long-term trends to put things into perspective. Gold is in a correction within a medium- and long-term uptrend. We have been here before in 1974, 1980, and 2011. In the first instance, in 1974, gold soon recovered in an inflationary environment. In the early 1980s, gold peaked, not to make a new high for 27 years. In 2011, gold took nine years to make a new high.
It’s anyone’s guess what happens next, but the technical picture remains constructive. A fall below the 200-day MA would be unhelpful, but there is strong underlying support for gold during these uncertain times.
There’s one more thing worth mentioning. Gold’s correlation with the oil price comes and goes, often randomly. But currently, it is deeply negatively correlated. When oil goes up, gold goes down, making it a very good time to own both assets.
Gold and Oil Correlation
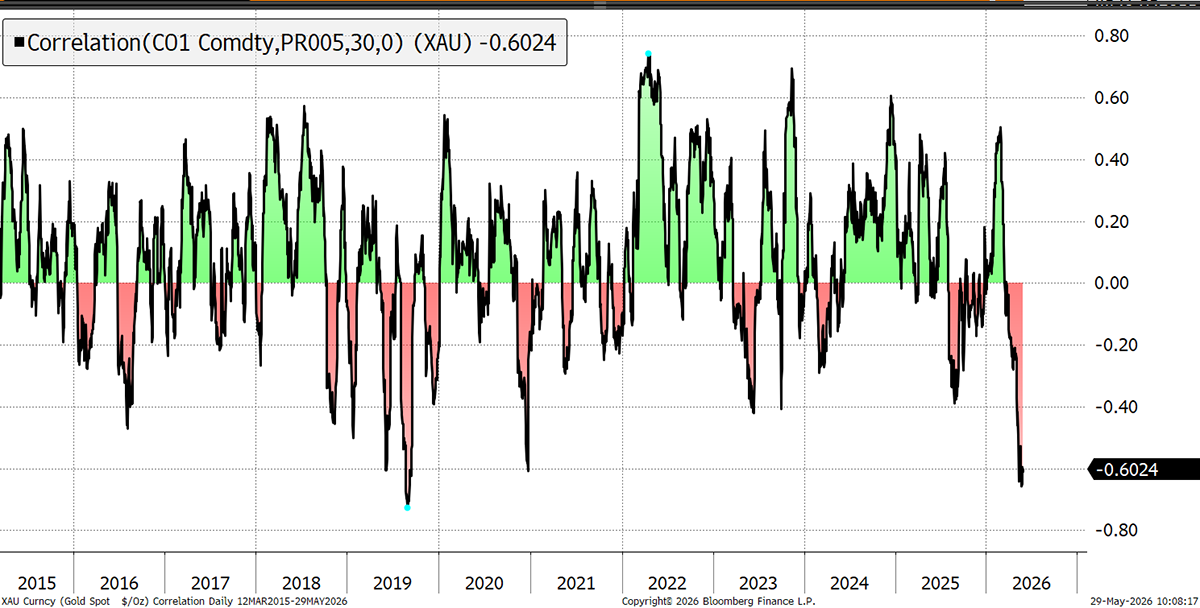
After all, in the 1970s, it was only after the first oil crisis ended that the gold bull market resumed.
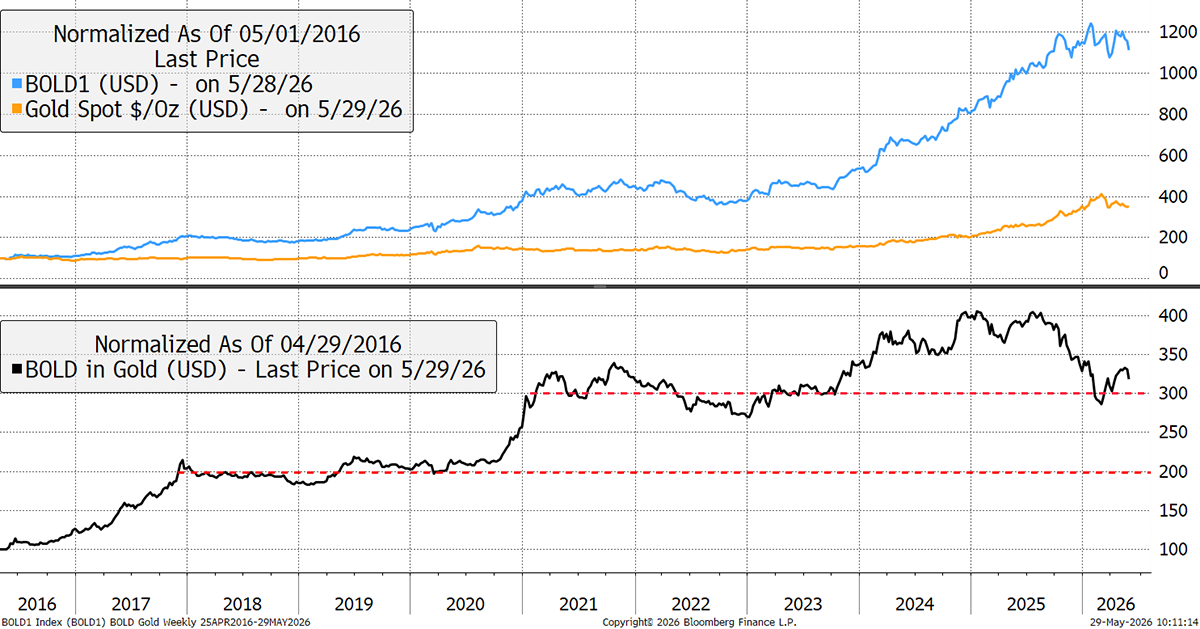
Gold has recently been soft, and so has Bitcoin. While the stockmarket is doing well, attention has turned away from these assets, and we will need to give this more time. While BOLD is hardly riding high, I am pleased with how it has proved resilient while both assets have undergone corrections.
Gold vs BOLD
You can follow the Bitcoin and Gold weights for free on our website. For BOLD product details on the 21Shares Bitcoin Gold ETP, and for strategy information from ByteTree, please visit BOLDETF.com.
Summary
At times like this, when the narratives have become exhausted, it makes sense to check in on the price. That defines the trend, volatility, and correlation with other assets, all of which are useful and important information.
One short-term issue that I may touch on in next month’s issue is how some countries are now selling gold due to the war in Iran. That is no bad thing, because it demonstrates how this liquid asset can be both bought and sold during the good times and the bad.
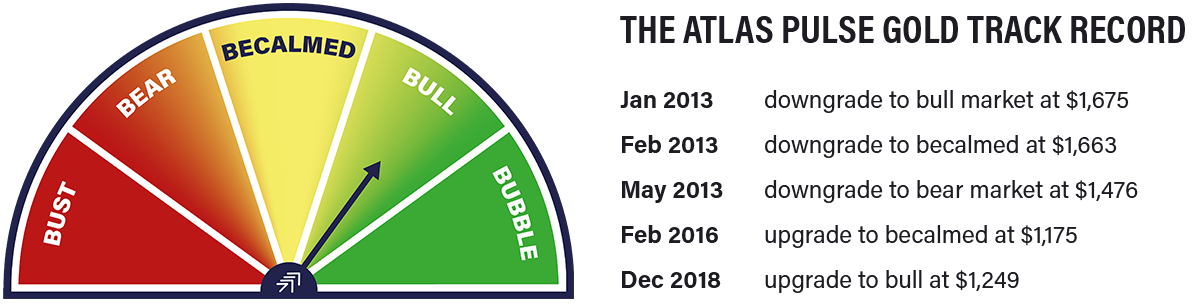
Thank you for reading Atlas Pulse. The Gold Dial remains in Bull Market.
Charlie Morris is the Founder and Editor of the Atlas Pulse Gold Report, established in 2012. His pioneering gold valuation model, developed in 2012, was published by the London Bullion Market Association (LBMA) and the World Gold Council (WGC). It is widely regarded as a major contribution to understanding the behaviour of the gold price.
Please email charlie.morris@bytetree.com with your thoughts.


