
Bubble Alert

On the face of it, the early summer stockmarket recovery has been strong, but the love has not been spread around. The momentum winners, those that have shown strength over the past year, have performed well. Meanwhile, the momentum losers, those that were already lagging behind, have slumped further.
US Momentum – Past Winners vs Past Losers – 2026 YTD
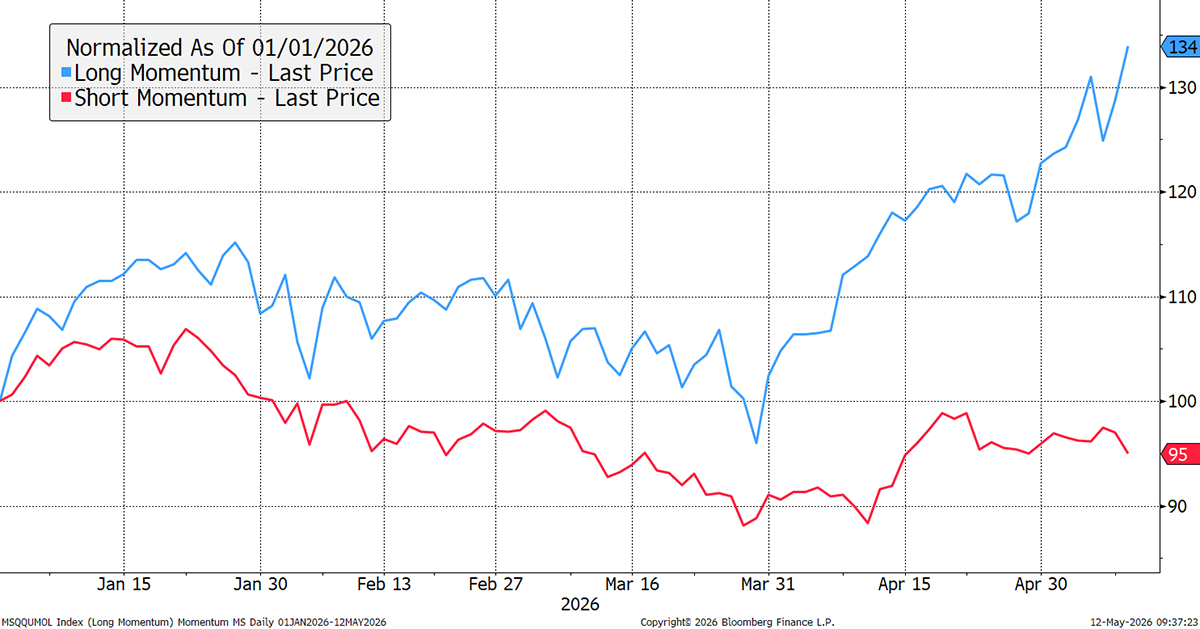
The winners are mainly dominated by semiconductors and energy, which feed the AI boom. The losers are the companies that serve the weakened consumer. The 39% gap between the winners and the losers, shown above, is extreme.
I have highlighted this chart many times, and it has been concerning as the spread between the winners and losers (black) has moved above the upper bound. The market is rewarding the sectors that are insulated from the cost-of-living crisis, and this chart illustrates by how much.
US Momentum – Past Winners vs Past Losers – Since 1999
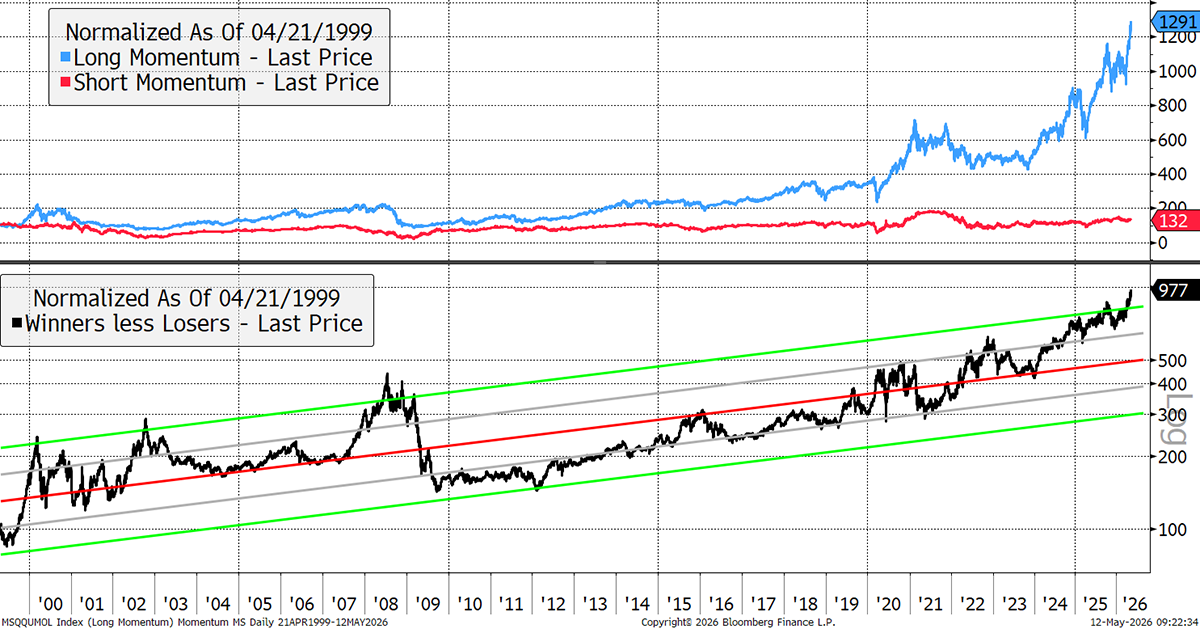
Previous extreme readings did not last long. In 2000, we saw the reversal following the dotcom boom. (Recall that I question the data quality of that era, as these momentum indices were created around 15 years later, and backdated.) We saw another surge in 2008, during the last major oil shock, before having a 17-year break from the market madness.
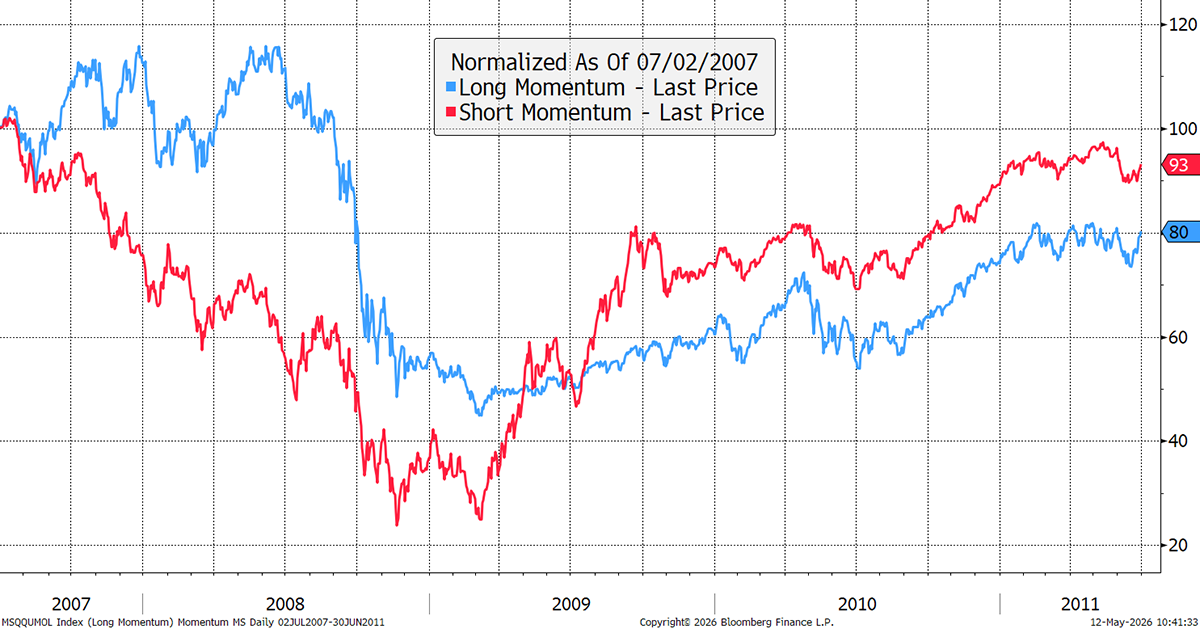
It’s a good time to remind ourselves what happens when the market breaks. In 2007, the bank stocks fell, making up the bulk of the losers, and in 2008, the consumer stocks joined them. Yet in 2008, the less economically sensitive sectors held up before eventually breaking and taking much longer to recover thereafter.
US Momentum – Past Winners vs Past Losers – Mid 2007 to 2011
Warning Signs
Fundamentals and value always win in the end, and today, the portfolios are cognisant not just of what could go right, but also of what could go wrong. We know that parts of the market are lofty from charts I occasionally highlight, such as the CAPE Ratio (long-term valuations), the Margin Data (levels of speculation), and this. The value of global equities compared to Global nominal GDP (including inflation) has hit a new high. The oxygen gets thinner up here.
World Market Capitalisation relative to World Nominal GDP
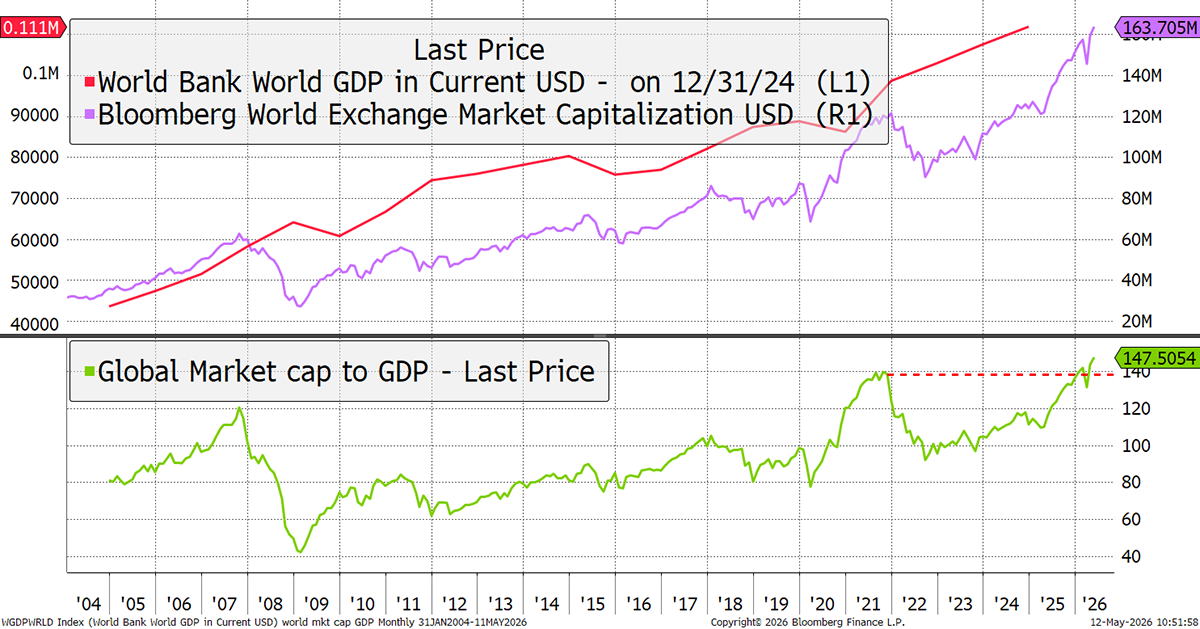
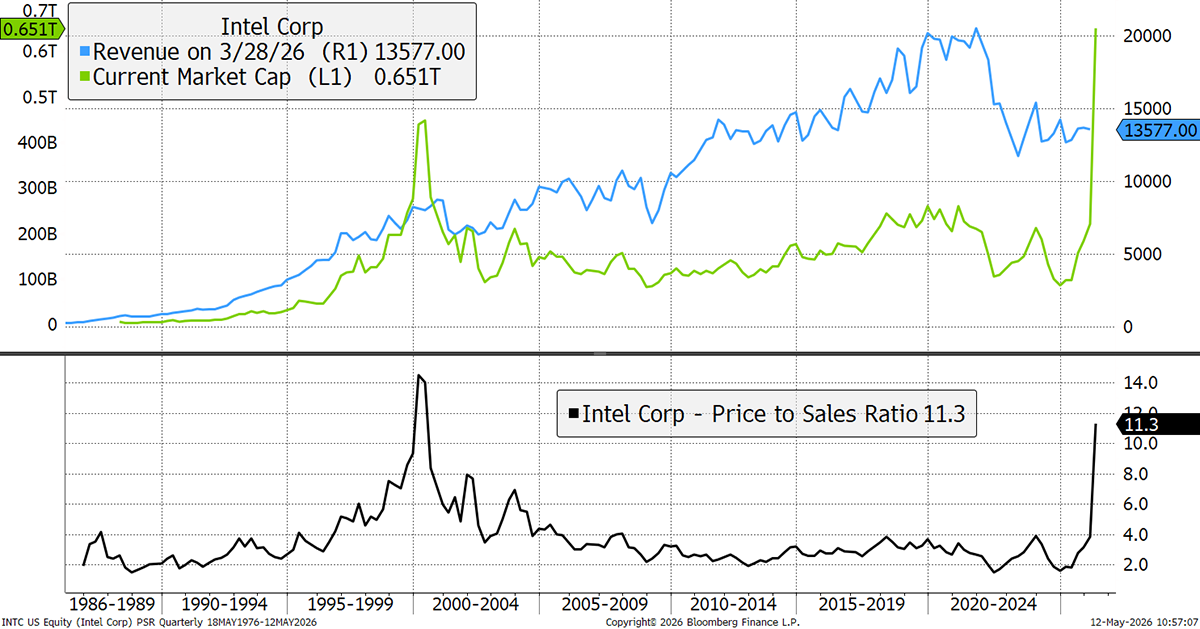
It tells us that equities are richly valued, which should come as no surprise. It is a function of a world awash with cash. Of course, that wealth remains concentrated and heavily committed to the growth of AI. I illustrate with Intel, a darling of the 1980s and 1990s. Recently, it has been struggling with sales, but the stock is up 6x following Trump’s state-funded cash injection. On a price-to-sales basis, it now trades on a valuation only seen during the dotcom bubble.
Intel Price-to-Sales Ratio since 1986
Meanwhile, the consumer hasn’t been doing very well for some time, made worse by the inflation surge following the pandemic and the Ukraine oil shock. And don’t forget the constant reminders about the threat of AI to their jobs. This latest oil shock is proving to be a conundrum. The world’s largest supplier of energy has been halted for ten weeks, leading to lost output of between 500 and 700 million barrels. When will this bite?
According to the BBC, the Indian prime minister, Narendra Modi, has urged people to reduce fuel consumption by using public transport and car-pooling. He has also asked citizens to avoid foreign tourism and non-essential gold purchases to save foreign exchange. China has ordered its oil refineries to stop exporting fuel, further exacerbating pressure on Asian nations.
Farmers are being forced to cut fertiliser use, which analysts warn is a food-security time bomb that will impact harvests in 2027. Few things have a greater global impact than rising food prices: it is no coincidence that conflict and unrest have been higher since the last round of inflation in 2021.
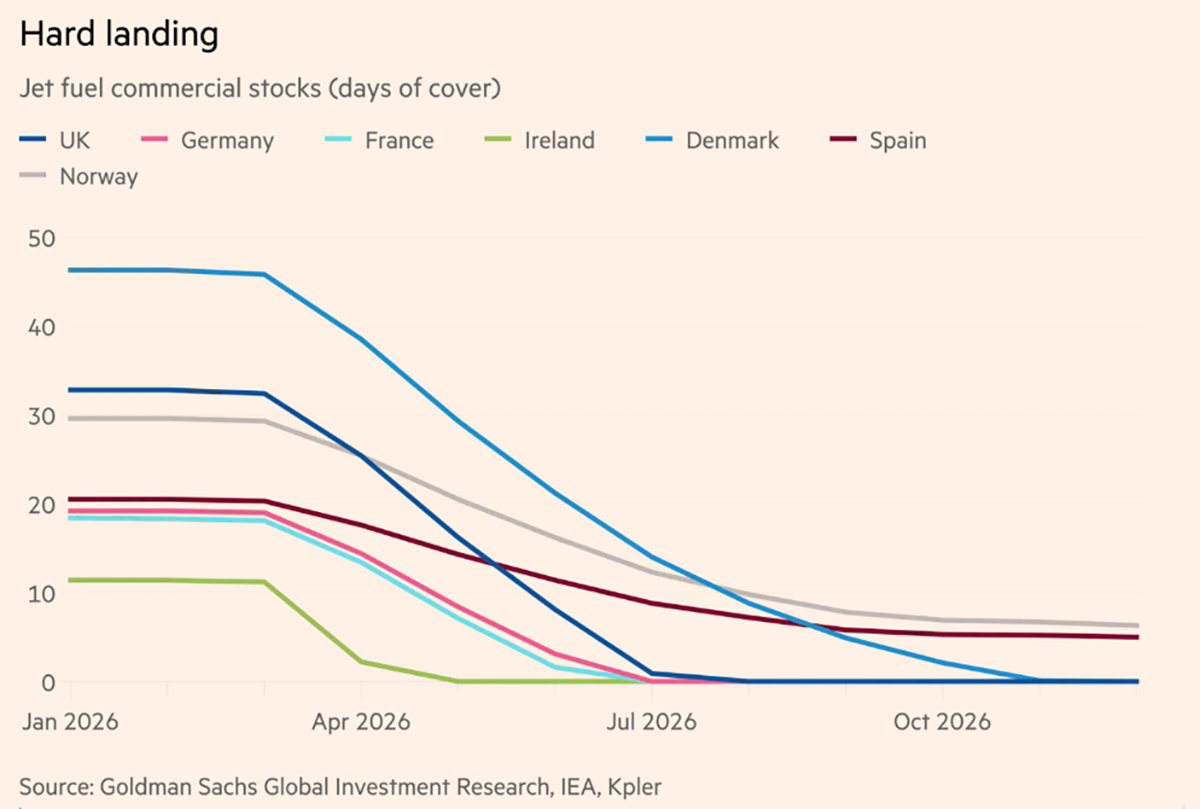
Finally, according to data published by the Financial Times, collated from Goldman Sachs, the International Energy Agency, and shipping data provider Kpler, jet fuel stocks are set to collapse following a delayed response. In Europe, estimates indicate that jet fuel stocks will fall to the IEA’s critical 23-day threshold by the end of May.
Jet Fuel Forecast
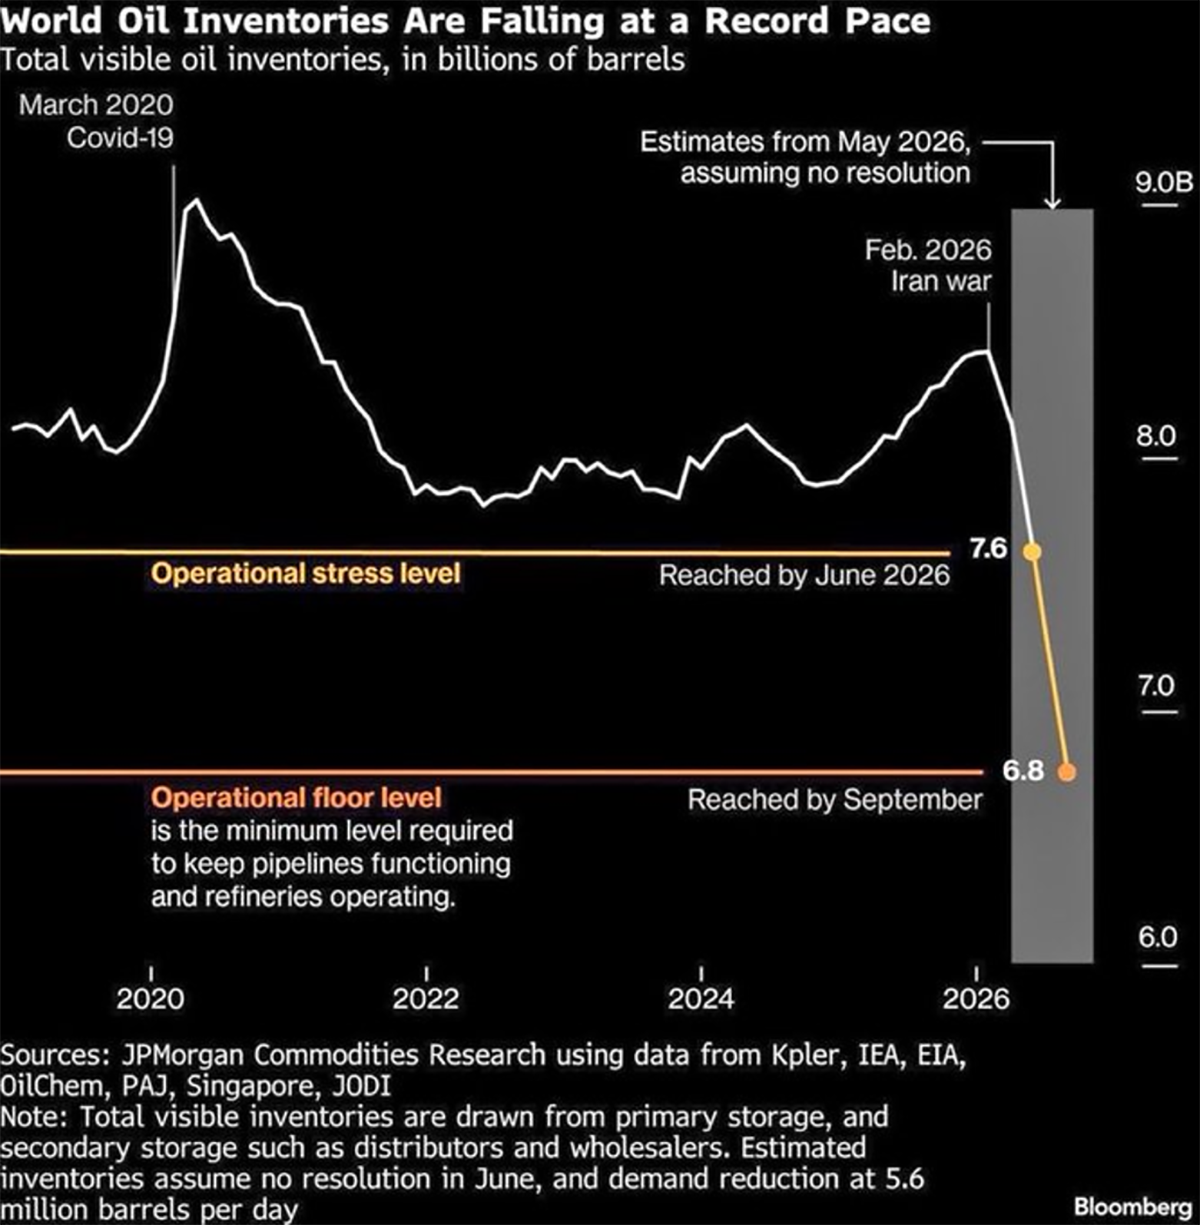
Another way to express that comes from JP Morgan, published by Bloomberg, which shows that oil inventories are falling rapidly. By June, inventories are expected to hit 7.6bn barrels, the operational stress level, and by September, 6.8bn barrels, which is the operational floor. That is the minimum required to prevent the refineries from shutting down, as the pipelines lose pressure. What happens then is presumably not positive.
Falling Oil Inventories
There are different theories as to why oil prices still hover around $100, while shortages of refined products are starting to bite. One is that this crisis will sooner or later come to an end. When it does, the oil price will collapse. Knowing that, why bid it higher in the interim?
Another reason oil isn’t already much higher is that global inventories are being run down, and the system is rapidly adapting. According to Bloomberg’s Javier Blas,
“China has slashed its oil imports by about a quarter from prewar levels. The impact is clear: Unexpectedly, more crude is available to the wider market, reining in oil benchmarks close to the key $100-a-barrel level despite 60-plus days of conflict in the Persian Gulf. But the mechanics behind the import swing — crucial to assessing its sustainability — are far from clear.
Chinese state-owned oil companies have been reselling some of their oil cargoes to European and Asian rivals. The behavior suggests surpluses — odd during a supply shortage. The shift has not only capped benchmark oil prices, but also helped to trigger a collapse in the premia that traders pay above them to secure physical crude.
Vortexa, a commodity intelligence firm, estimates that China is buying just 8.2 million barrels a day of crude from overseas, down from a prewar level of around 11.7 million. The 3.5-million barrels a day swing almost matches the total consumption of Japan and is double the amount supplied by the United Arab Emirates pipeline that circumvents Hormuz. Simply put, it’s huge, perhaps the second- or third-largest factor rebalancing the oil market today, behind only Saudi Arabia’s own pipeline bypassing the strait and the use of the strategic petroleum reserves of the US and Japan.”
The message is that the world is adjusting to the new reality, but we should not be complacent. Severe economic damage is inevitable, even if it isn’t yet obvious. Imagine an Arctic expedition that is running low on food. The crisis comes when they run out of food, and not before.
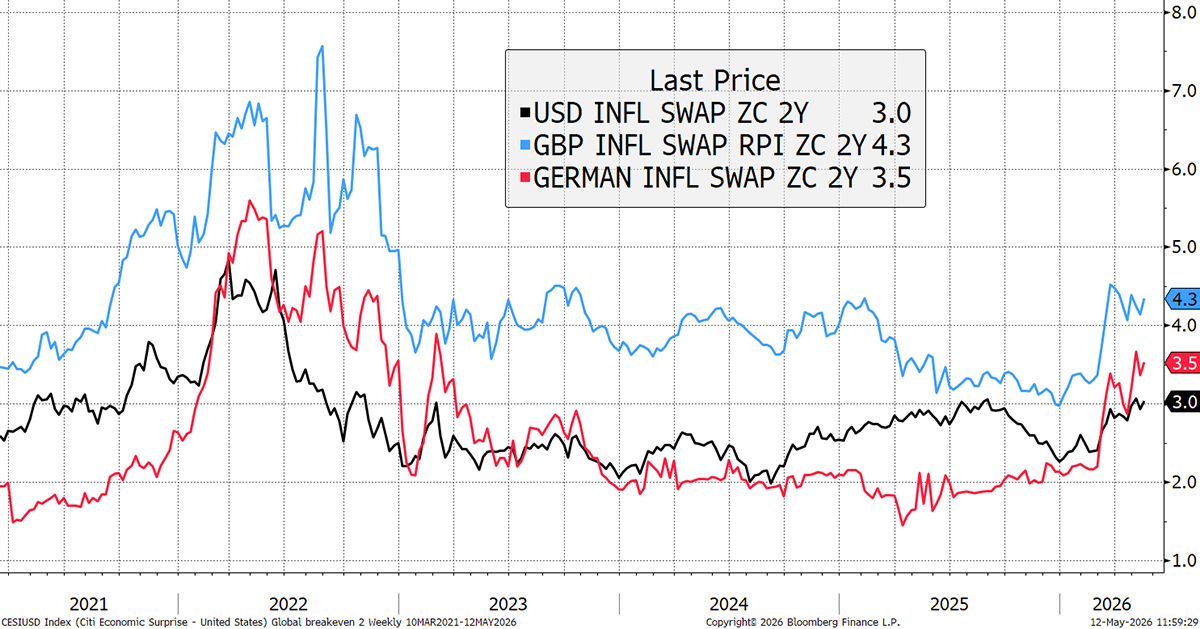
We haven’t run out of fuel yet, but the higher costs are already coming through. The US has seen the least impact on expected inflation, but the UK and Europe have seen a rapid pickup.
Two-Year Inflation Expectations in the US, UK, and Europe
What About the UK?
UK inflation is structurally higher than elsewhere. Some of this is down to being an island nation, not physically connected to a large market such as the USA or Europe. Another quirk is that we measure RPI rather than CPI, for historical reasons, which is roughly 0.9% higher. But the other reason is largely down to policy choices, such as an energy system that has structurally higher costs, a rising minimum wage, or excessive regulation. It all adds up.
With UK politics once again on the front pages for the wrong reasons, there is an idea that the UK cost of borrowing is rising due to a high-spending government. That is no doubt true, but if the bond market had lost confidence in the UK, the yields would already be through the roof. The higher borrowing costs are a function of structurally higher inflation, which won’t go away until there is structural supply-side reform.
UK Interest Rates and Gilt Yields
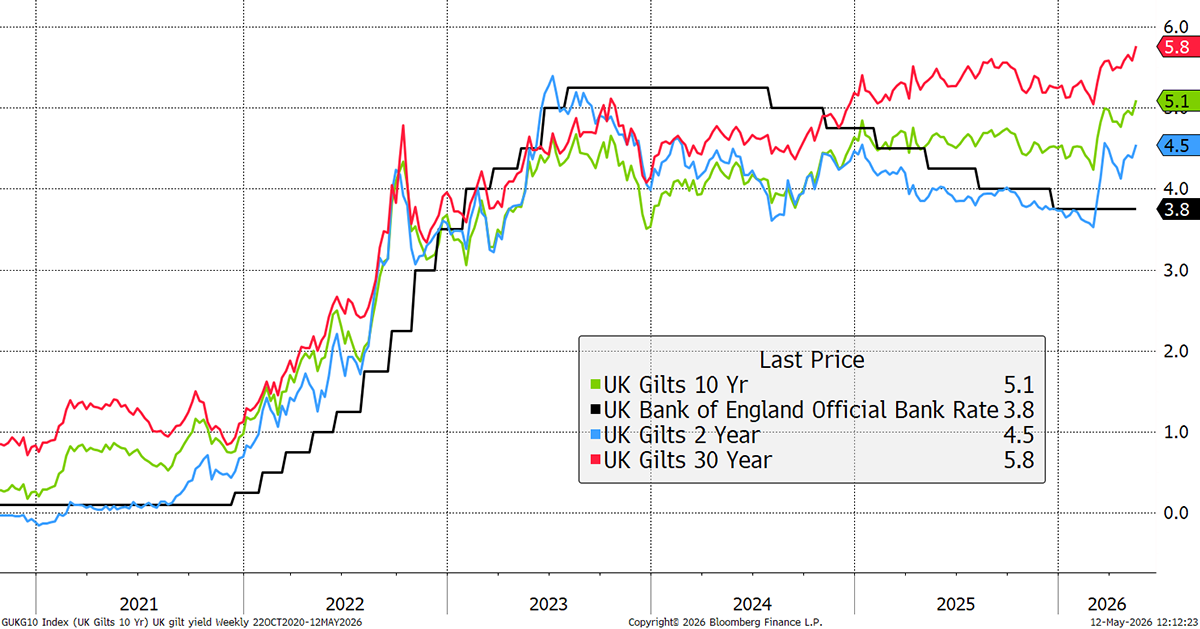
I had no intention of making this overly political, but that is where we are. The cost of borrowing was looking so promising in February, but the energy scare will continue to put upward pressure on yields.
Bubbles and Asset Allocation
What options do investors have?
General - Your capital is at risk when you invest, never risk more than you can afford to lose. Past performance and forecasts are not reliable indicators of future results. Bid/offer spreads, commissions, fees and other charges can reduce returns from investments. There is no guarantee dividends will be paid. Overseas shares - Some recommendations may be denominated in a currency other than sterling. The return from these may increase or decrease as a result of currency fluctuations. Any dividends will be taxed at source in the country of issue.
Funds - Fund performance relies on the performance of the underlying investments, and there is counterparty default risk which could result in a loss not represented by the underlying investment. Exchange Traded Funds (ETFs) with derivative exposure (leveraged or inverted ETFs) are highly speculative and are not suitable for risk-averse investors.
Bonds - Investing in bonds carries interest rate risk. A bondholder has committed to receiving a fixed rate of return for a fixed period. If the market interest rate rises from the date of the bond's purchase, the bond's price will fall. There is also the risk that the bond issuer could default on their obligations to pay interest as scheduled, or to repay capital at the maturity of the bond.
Taxation - Profits from investments, and any profits from converting cryptocurrency back into fiat currency is subject to capital gains tax. Tax treatment depends on individual circumstances and may be subject to change.
Investment Director: Charlie Morris. Editors or contributors may have an interest in recommendations. Information and opinions expressed do not necessarily reflect the views of other editors/contributors of ByteTree Group Ltd. ByteTree Asset Management (FRN 933150) is an Appointed Representative of Strata Global Ltd (FRN 563834), which is regulated by the Financial Conduct Authority.
© 2026 ByteTree Group Ltd