


Passage to India

Trades in Soda and Whisky
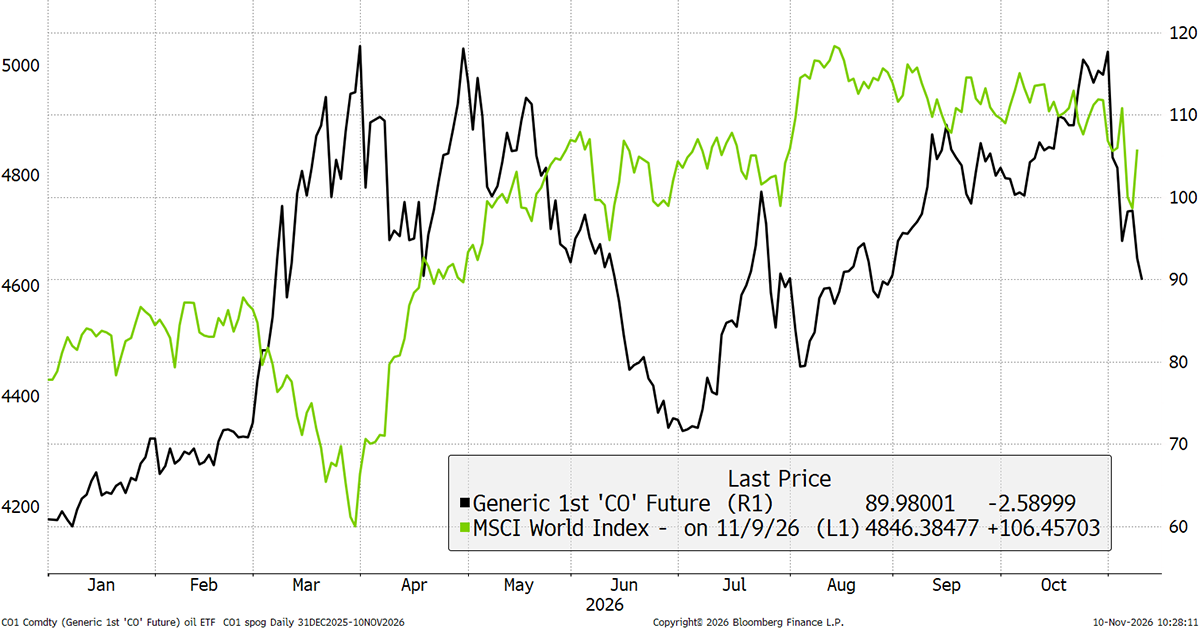
After last week’s midterm rally, the market crashed on Friday, then bounced back yesterday. I’m not sure how much the midterms had to do with it, because the last two strong trading days coincided with sharp falls in the oil price. The economy loves cheap oil, which brings relief and boosts the markets, and vice versa.
Trump is talking down the next phase of the war, but the USS Theodore Roosevelt has left Singapore for the Gulf. It is expected to arrive mid to late November, at which point there will be three carriers in the region. The USS Makin Island Amphibious Ready Group is also en route, carrying the 13th Marine Expeditionary Unit and adding Marines and amphibious capability. Who knows what his real intentions are?
It is quite clear to me that this year’s equity rallies have happened when the oil price has fallen. A lower oil price implies lower inflation and interest rates, which is good for markets. I feel we should hold oil-related assets until it is clear this is over.
Oil and Equities
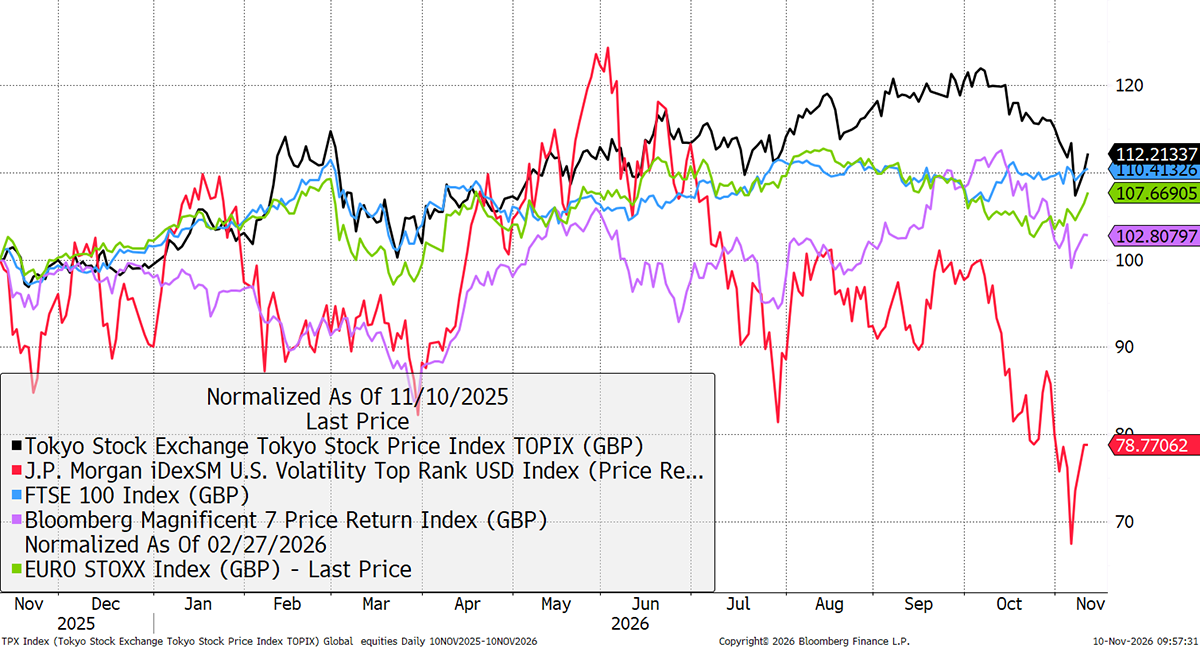
Looking at major stockmarkets, big tech (purple) and the risky, volatile stocks (red), there is confusion in the markets. The FTSE (blue) is doing quite well, but big tech is only up 2.8% this year, which isn’t much to shout about.
Major Markets – Past Year
I have little doubt that this is the most important chart. It shows low-volatility stocks versus high-beta. You could be forgiven for thinking that the risky stocks are oversold and it’s time to buy the dip, but there is one big difference. This time, quality has taken the lead. It might not look like much so far, but there is precedent.
Low Volatility vs High Beta
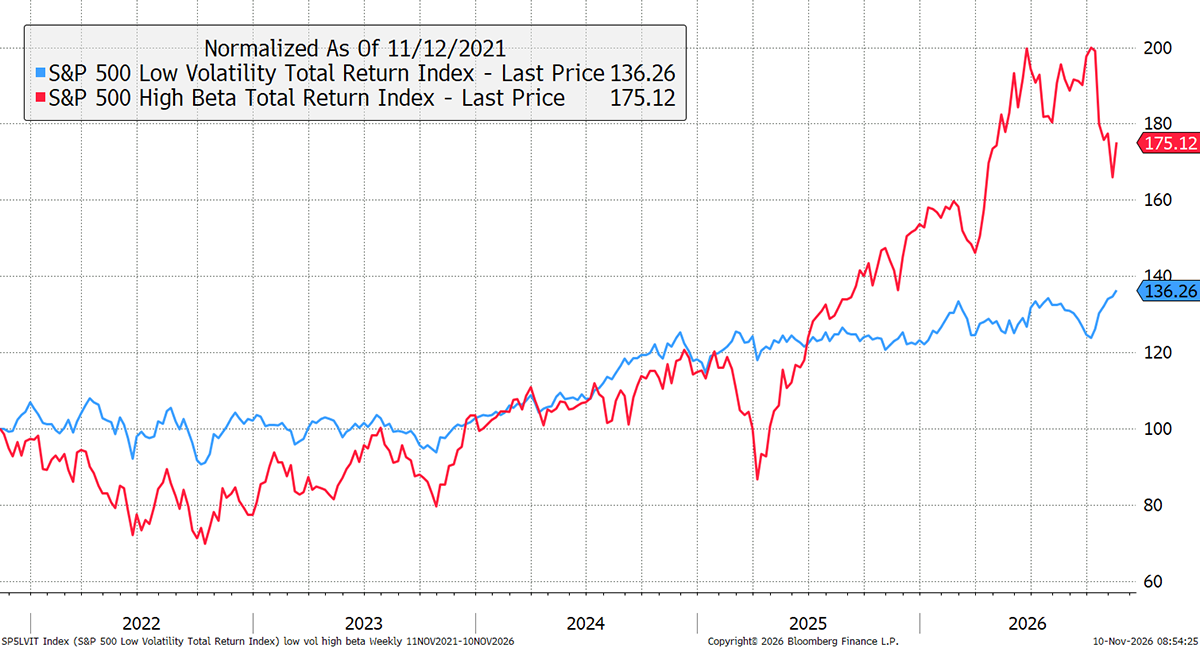
In yesterday’s note on Global Trends, we covered the rotation in more detail. I hope you have all seen how market breadth has broadened, and new countries and sectors have stepped in as former market leaders have waned. Crucially, in recent dips for risky stocks, quality never stepped in. This time, it has.
I created this analogue of the rotation in March 2000, using the same chart above, with the start dates aligned. It is early days, but a few things are worth noting. Blue low-volatility stocks appeared stronger before the start, but that masks the five-year lag since 2021, when rates started to rise. The red high-volatility stocks have followed a remarkably similar path on the way in. But the key point is that the blue stocks never suffered in the bear market that followed. The chart is rebased to the rotation start dates.
Analogue Low Volatility vs High Beta – 2000 vs Present
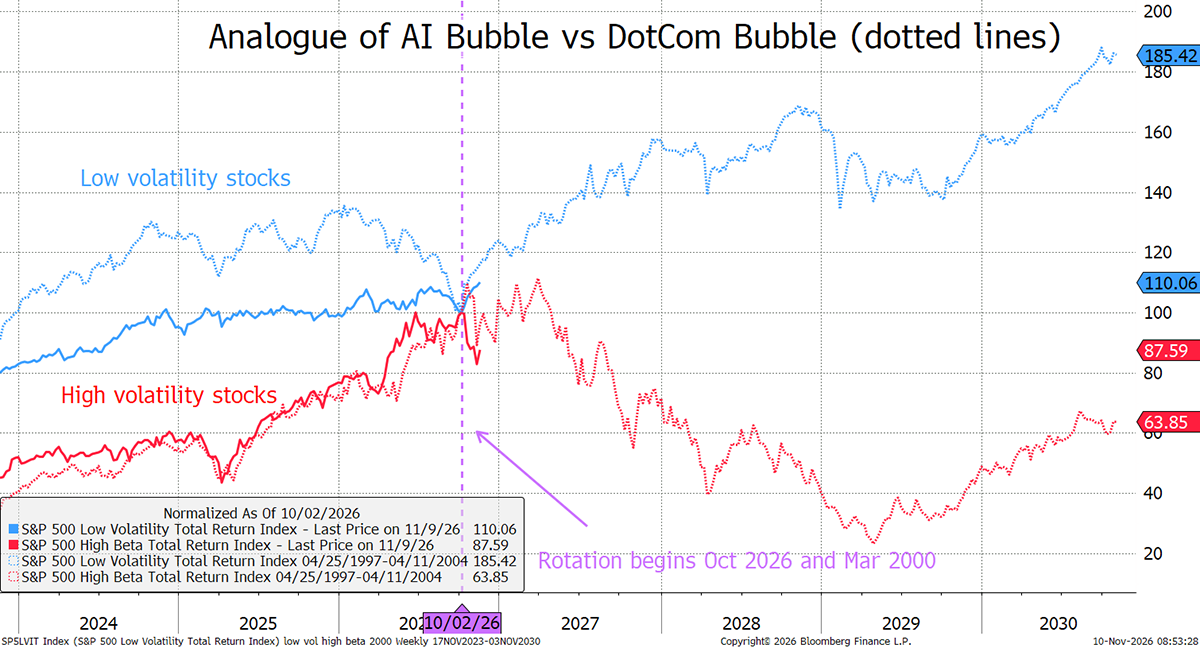
As I said, it’s early days, but something significant has changed. Big stocks are more profitable than back then, but they are still richly priced and will likely deliver underwhelming growth relative to expectations. In my humble opinion, the odds of a bear market have increased, but this could still take time to play out.
Our weekly Global Trends notes are free to read. To receive them in your inbox, sign up below.
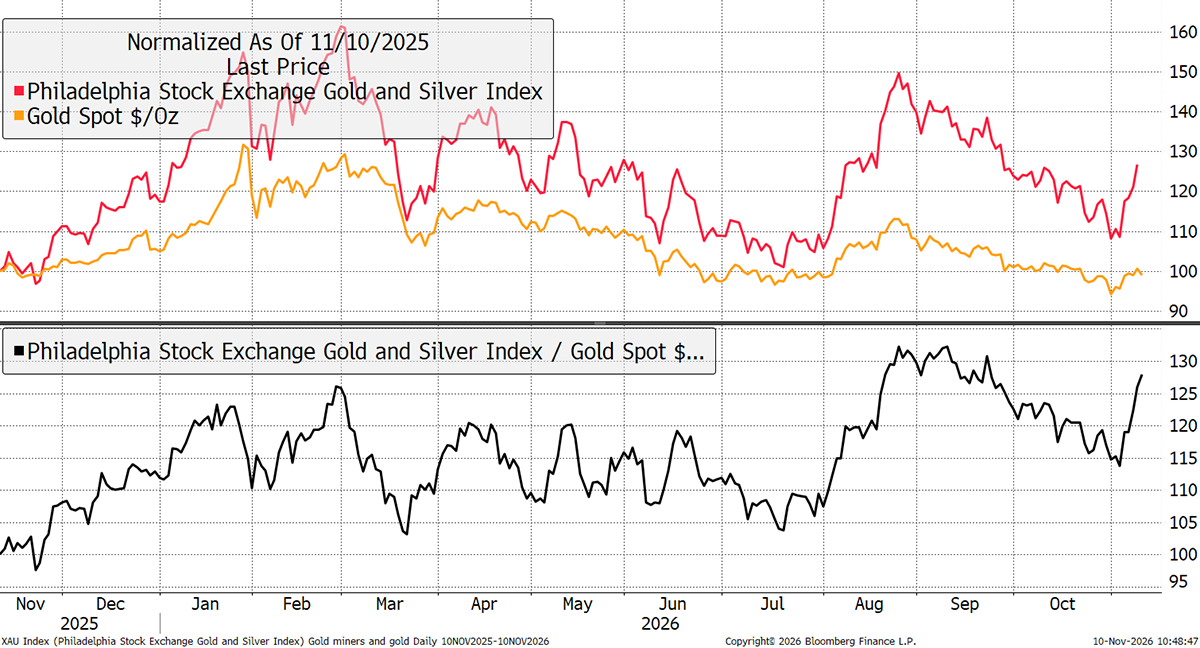
Gold and the miners had a good bounce too. The miners are close to a new high relative to gold, which reminds us how much money they are making these days, even at lower gold prices.
Gold Miners vs Gold
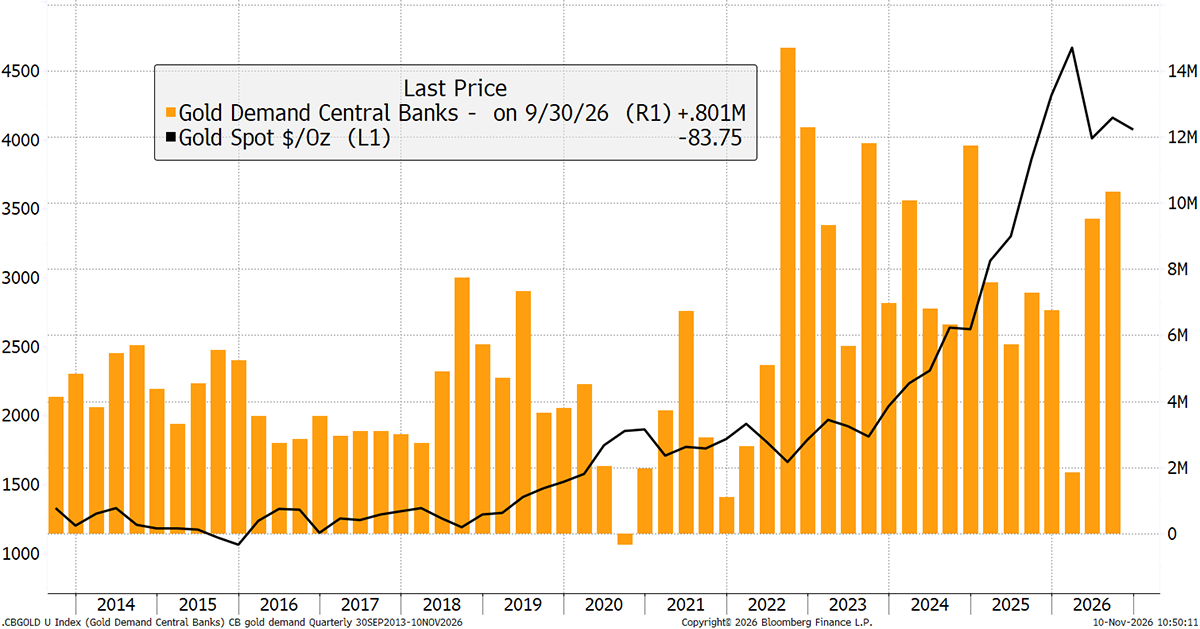
Let’s not forget that the central bank buying is still running full steam ahead. Q3 2026 was the best quarter for some time, and this is happening at much higher gold prices. Stay bullish on gold.
Central Bank Gold Demand
General - Your capital is at risk when you invest, never risk more than you can afford to lose. Past performance and forecasts are not reliable indicators of future results. Bid/offer spreads, commissions, fees and other charges can reduce returns from investments. There is no guarantee dividends will be paid. Overseas shares - Some recommendations may be denominated in a currency other than sterling. The return from these may increase or decrease as a result of currency fluctuations. Any dividends will be taxed at source in the country of issue.
Funds - Fund performance relies on the performance of the underlying investments, and there is counterparty default risk which could result in a loss not represented by the underlying investment. Exchange Traded Funds (ETFs) with derivative exposure (leveraged or inverted ETFs) are highly speculative and are not suitable for risk-averse investors.
Bonds - Investing in bonds carries interest rate risk. A bondholder has committed to receiving a fixed rate of return for a fixed period. If the market interest rate rises from the date of the bond's purchase, the bond's price will fall. There is also the risk that the bond issuer could default on their obligations to pay interest as scheduled, or to repay capital at the maturity of the bond.
Taxation - Profits from investments, and any profits from converting cryptocurrency back into fiat currency is subject to capital gains tax. Tax treatment depends on individual circumstances and may be subject to change.
Investment Director: Charlie Morris. Editors or contributors may have an interest in recommendations. Information and opinions expressed do not necessarily reflect the views of other editors/contributors of ByteTree Group Ltd. ByteTree Asset Management (FRN 933150) is an Appointed Representative of Strata Global Ltd (FRN 563834), which is regulated by the Financial Conduct Authority.
© 2026 ByteTree Group Ltd


