


A Once-in-a-Generation Rotation in Stockmarkets


Issue 90;
- This once-in-a-generation market rotation accelerates.
- The AI trade has weakened significantly.
- Bonds, Defensive Sectors, and Gold are the winners.
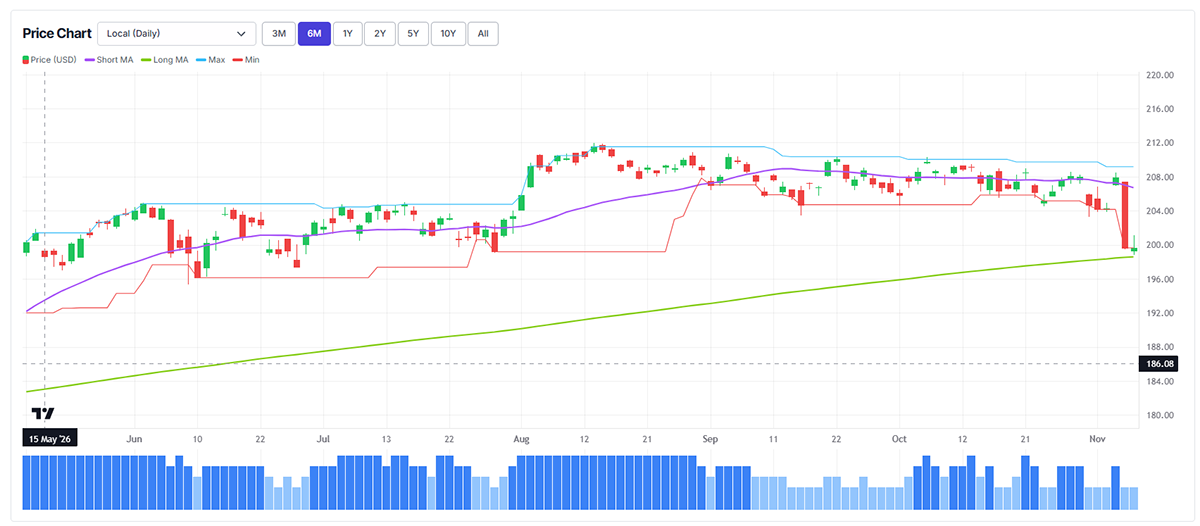
The World Index holds a ByteTrend Score of 2 in USD. The price has broken down from the old range and is now at the 200-day moving average. If it breaks below that, the probability of a bear market will increase.
iShares MSCI World ETF (URTH) – Developed Markets, Daily Six Months
Breadth
Using ByteTrend, we measure market breadth, i.e. the number of rising or falling stocks. We use daily or weekly data, and measure trends both in price (beta) and relative to the market (alpha or CAPR, which stands for “currency-adjusted price relative”).
Much has been said about breadth in recent months, as the stockmarket was incredibly narrow (dominated by a small group of mega-cap stocks). We look at breadth through our four lenses.
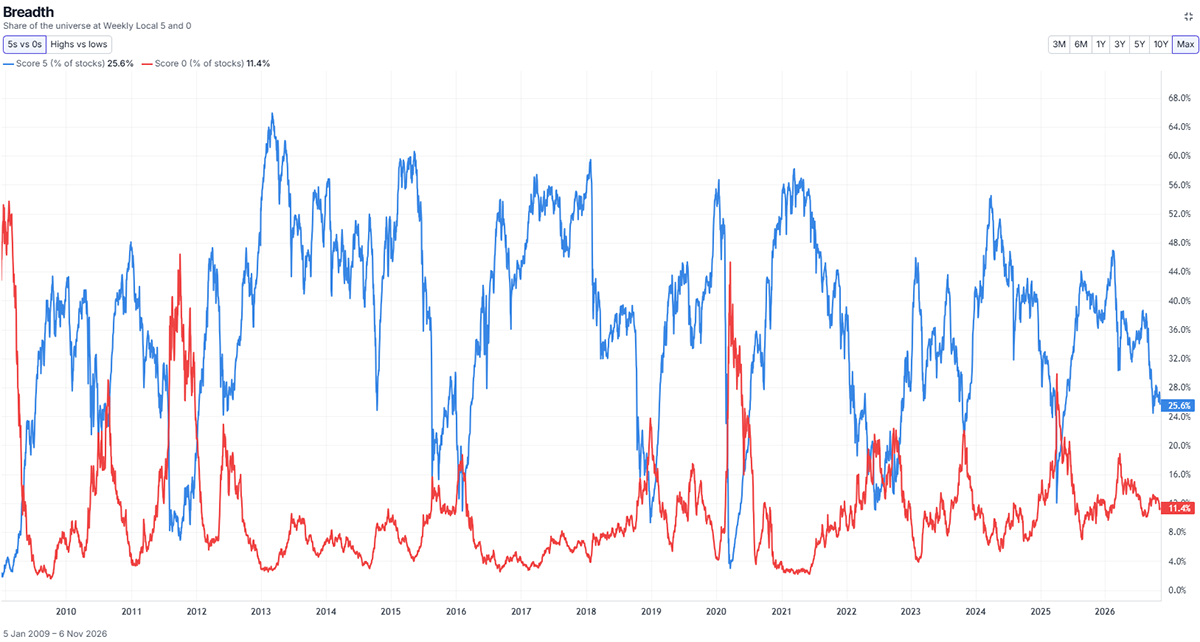
World Market Beta Breadth (in Price) – Weekly, Since 2006
First, we look at long-term (weekly) breadth in price terms. The blue line shows the % of stocks with a trend score of 5 (strong trends), and red shows the % of 0s (weak trends). When the blue line is above the red, it means there are more uptrends than downtrends. Many stocks have been strong in price terms over the last year, but that is currently changing as the market rolls over.
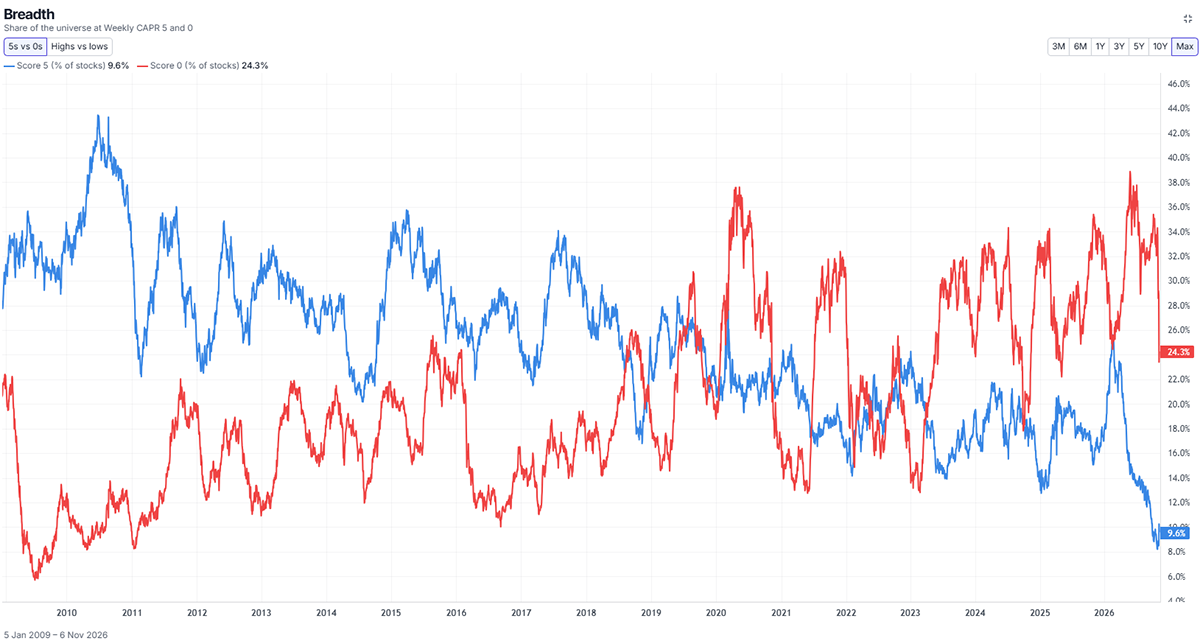
World Market Alpha Breadth (in CAPR) – Weekly, Since 2006
Next, we look at CAPR breadth, which shows 5s and 0s relative to the World Index. The blue line (5s) shows what % of the market is beating the index; the red line (0s) shows the % of underperformers. Thus, we see “Alpha Breadth”.
Here, the blue line is below the red line. Why? Because the index has been strong, it is harder to beat. Therefore, there have been far more relative losers than winners. However, that has changed since early October.
In terms of Alpha breadth, the number of stocks in downtrends has collapsed from 39% to 24%. The uptrends are slow to evolve because weekly trends take time to establish themselves, but they have risen from 8% to nearly 10%. The main thing is that the former losers have recovered, relative to the index.
The blue line was highest after 2008, when many stocks recovered in unison, but it has been sliding lower ever since, as the market has been increasingly dominated by a shrinking number of US tech stocks. If that trend is turning, it is a significant moment for investors. This is an important, once-in-a-generation move.
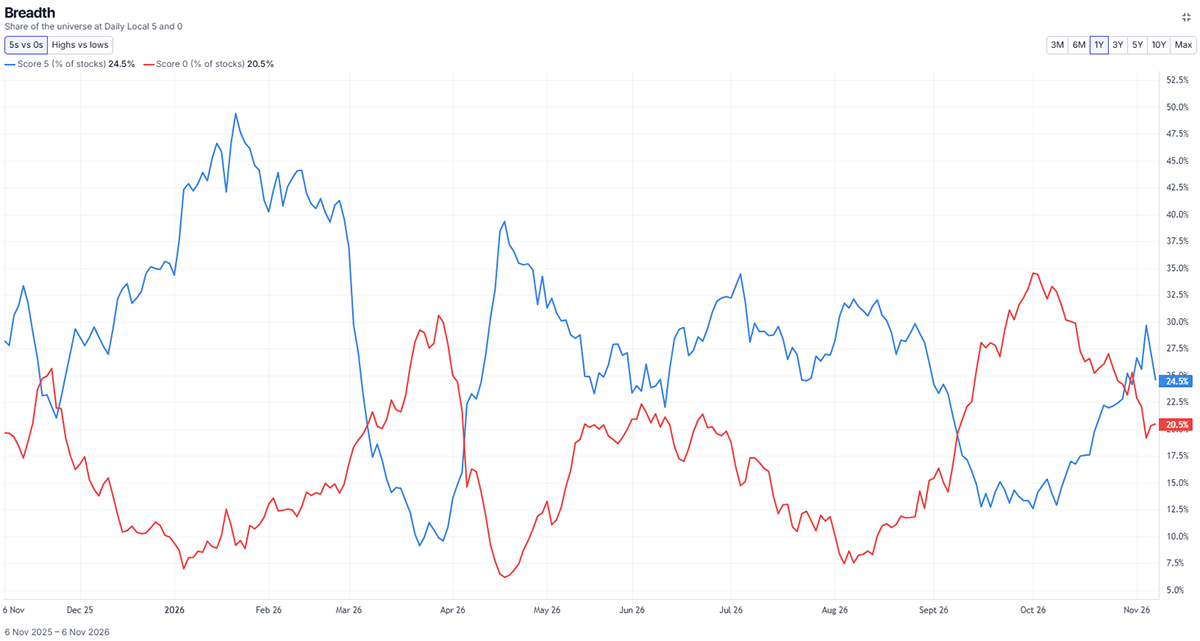
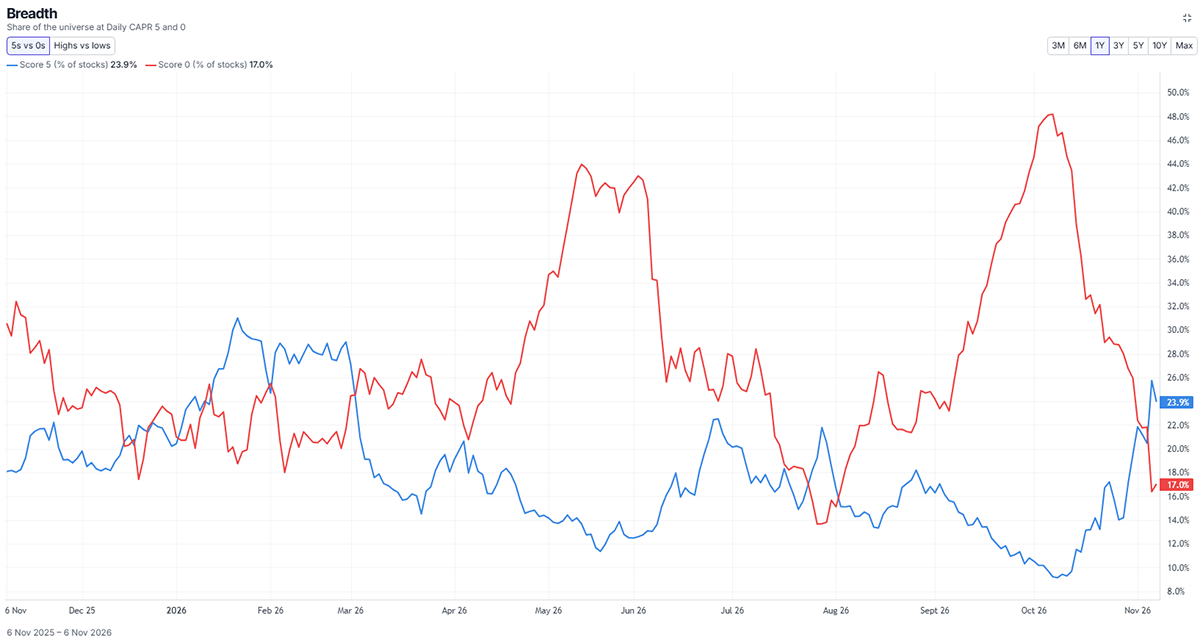
World Market Beta Breadth (in Price) – Daily, Past Year
Now, we will show the same charts, price and relative trend strength, using daily data. This is more reactive to short-term moves, as a 30-day moving average can shift well before a 30-week one.
The number of strong price trends (blue line) has risen faster on these daily charts, while the downtrends have retreated. This is bullish short-term, but the downtrends, largely in technology, represent more of the market cap and drive the index.
World Market Alpha Breadth (in CAPR) – Daily, Past Year
Finally, our fourth chart shows daily alpha breadth. This is where the rotation is most pronounced. In just over a month, the 48% of stocks that were lagging the market have collapsed to 17%. In contrast, just 9% of stocks were beating the market last month, but this has now expanded to 24%.
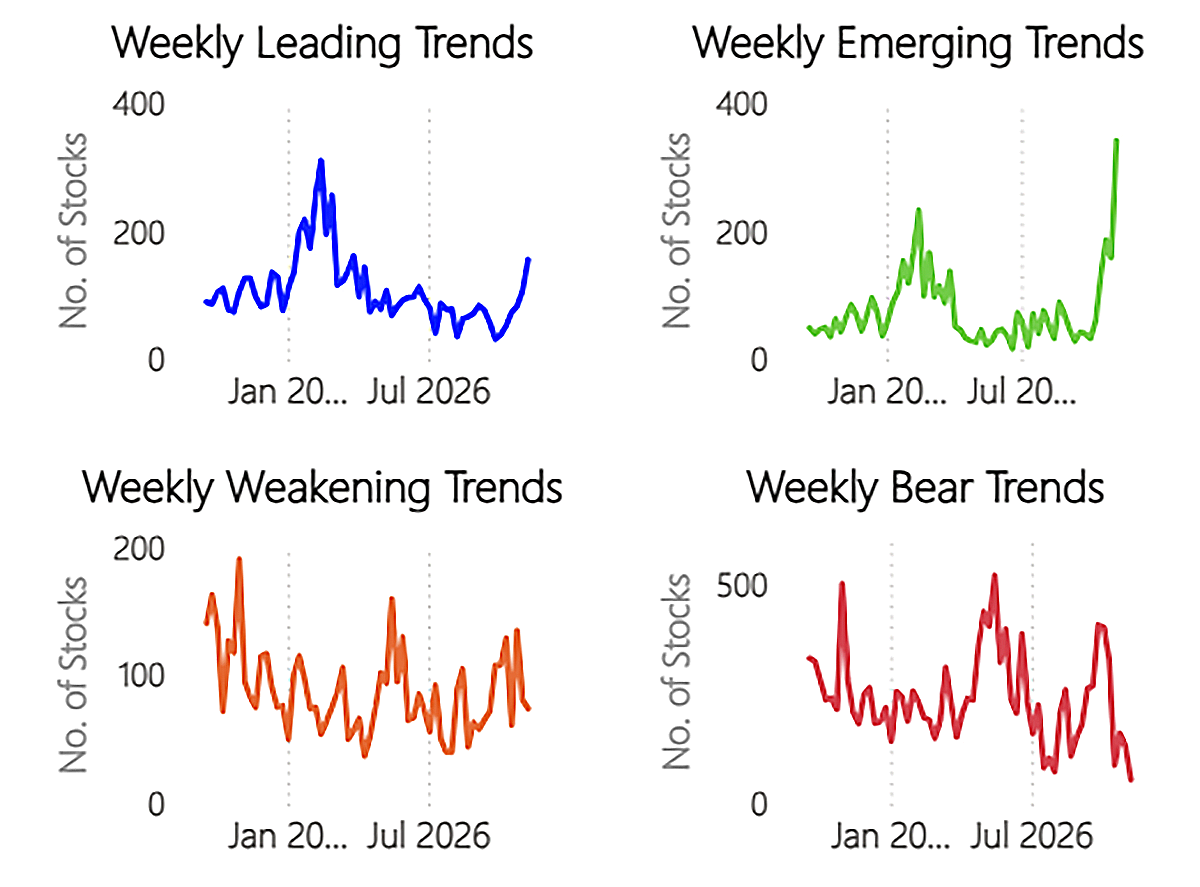
Trend Categories
We can take these concepts and enhance them further using relative highs and lows. A score of 5, which is also making relative highs, is an even stronger trend. An emerging trend is making new relative highs, but isn’t yet a score of 5 (i.e. 0-4).
In recent weeks, the number of Emerging Trends has exploded. In contrast, the number of Bear Trends has slumped. This tells us that formerly weak stocks are starting to perform and make new relative highs, but are not yet at weekly relative trend (CAPR) scores of 5. This signals heavy rotation as weaker stocks strengthen. The number of Leading Trends (score = 5, new relative high) is also increasing, and that will continue with this rotation.
Trend Type Count
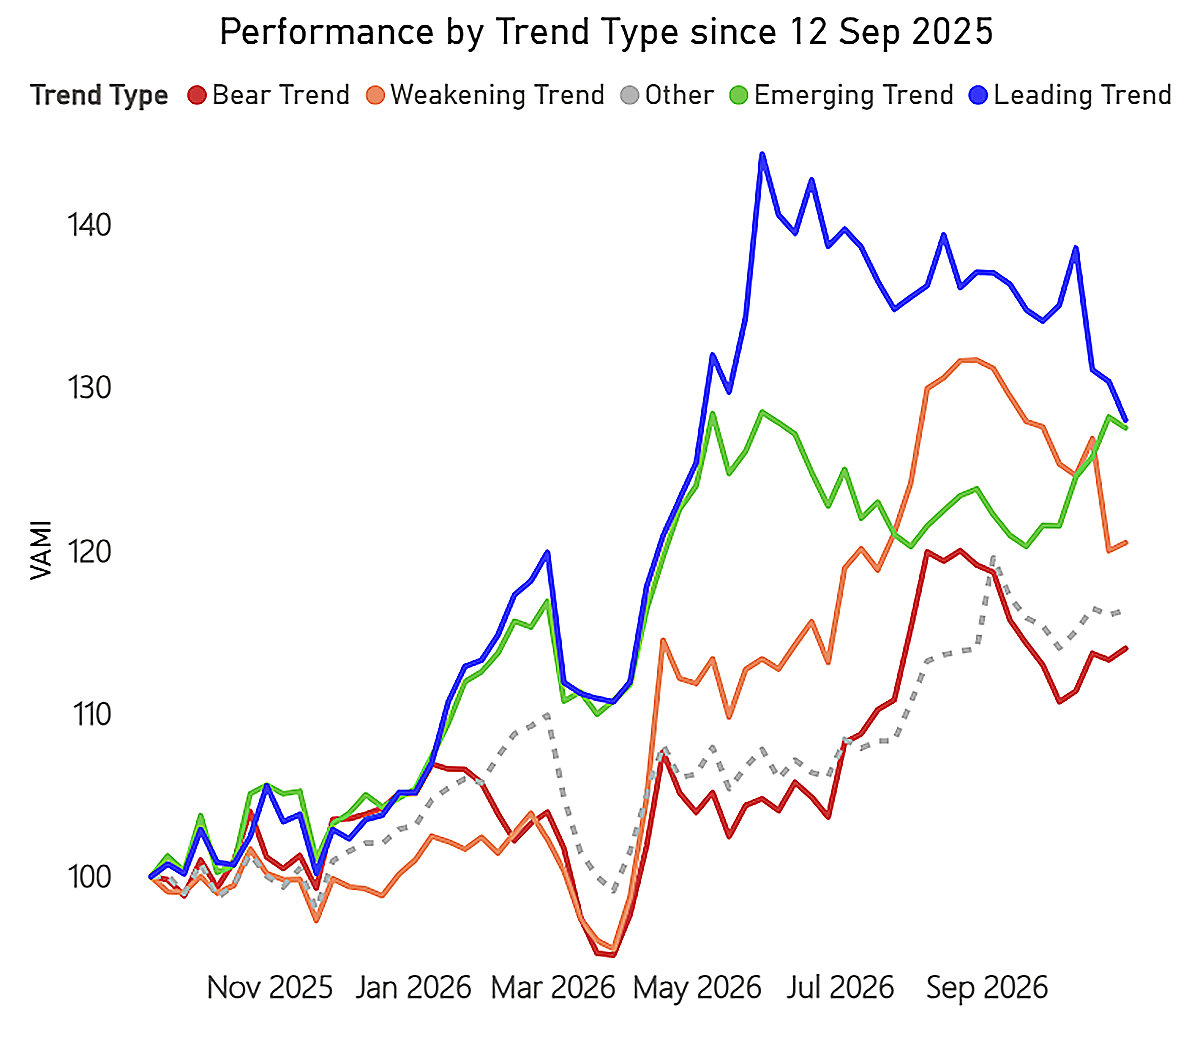
This next chart shows the actual performance (i.e. realised performance) of the basket of stocks in each trend category.
The Emerging Trends are making money, but not that much. The Bear Trends are rising and stable. It is the Leading Trends that stand out, as these former leaders are declining as a group, and the Weakening Trends, which are making new relative lows but don’t yet score 0, have joined in the crash in recent weeks.
Trend Type Performance
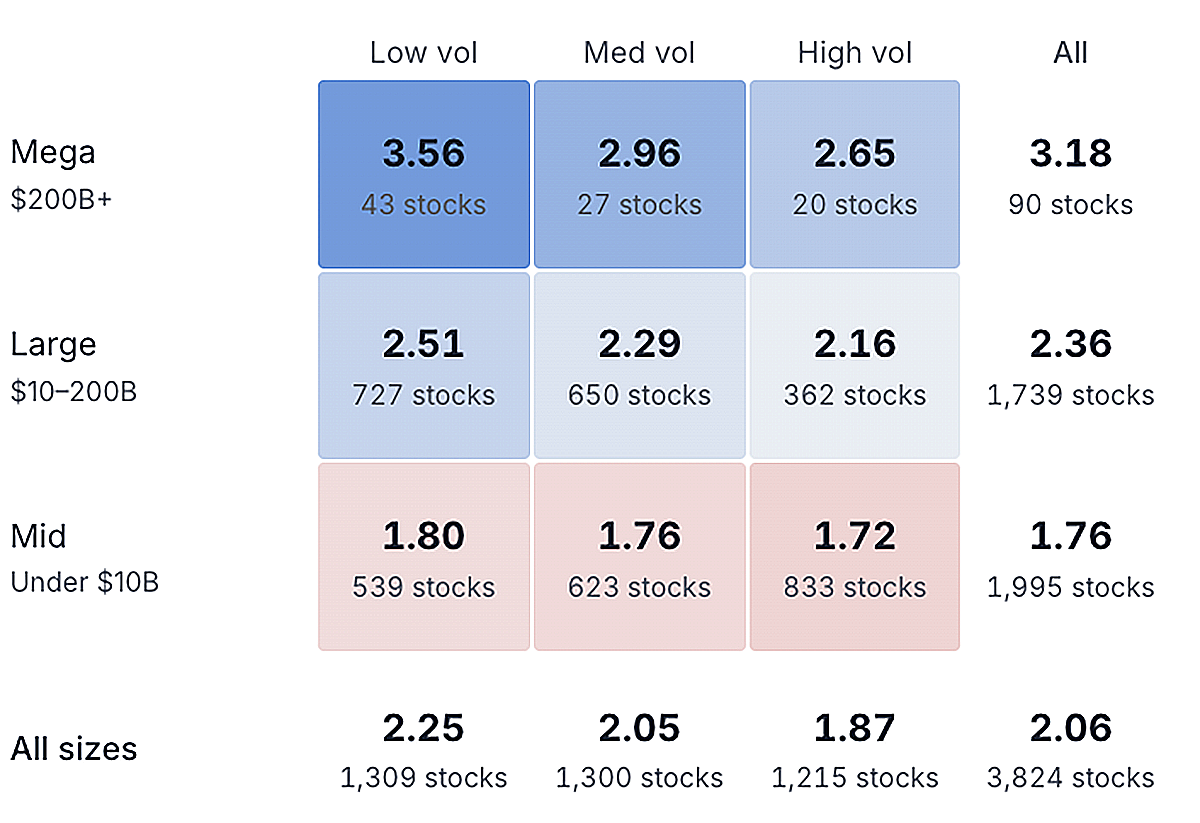
Another crucial way to view this is through size and volatility. Three months ago, high volatility stocks were the strongest by far. Today, the picture is completely different. To outperform, you need to own low-volatility stocks. Mega-caps still lead, but their lead is waning in the short term.
Average Weekly CAPR Score by Size and Volatility Basket
Taken together, this gives a complete picture of the rotation.
The global stockmarket was dominated by a small group of very large stocks, which meant many smaller stocks underperformed. Then, a rotation took hold, first in July and again in October. This has led to a surge in the number of stocks making new relative highs and rising in trend score. Meanwhile, the former leaders are beginning to underperform.
Next, we look at which assets and sectors are the winners from this rotation.
The Rotation in Numbers
These breadth charts show the number of 5s, neutral trends, and 0s by sector over time (right = most recent).
The number of daily (short-term) CAPR trend scores of 0 is retreating sharply in all sectors bar Technology and Materials. The most notable recoveries are in Real Estate and the consumer sectors. The 0s have become neutral, and a few stocks are starting to become 5s. If you are looking to own the winners, look for green bars. For example, 36% of Consumer Defensive stocks currently have a daily CAPR trend score of 5.
Daily Alpha Breadth by Sector
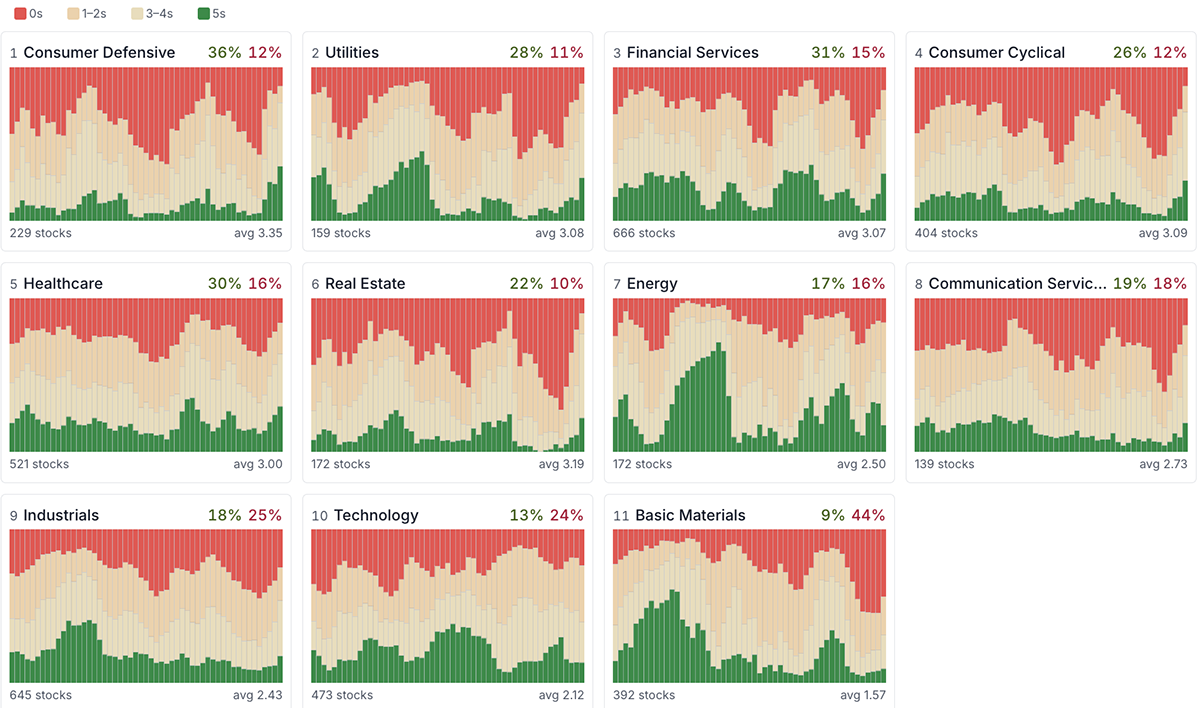
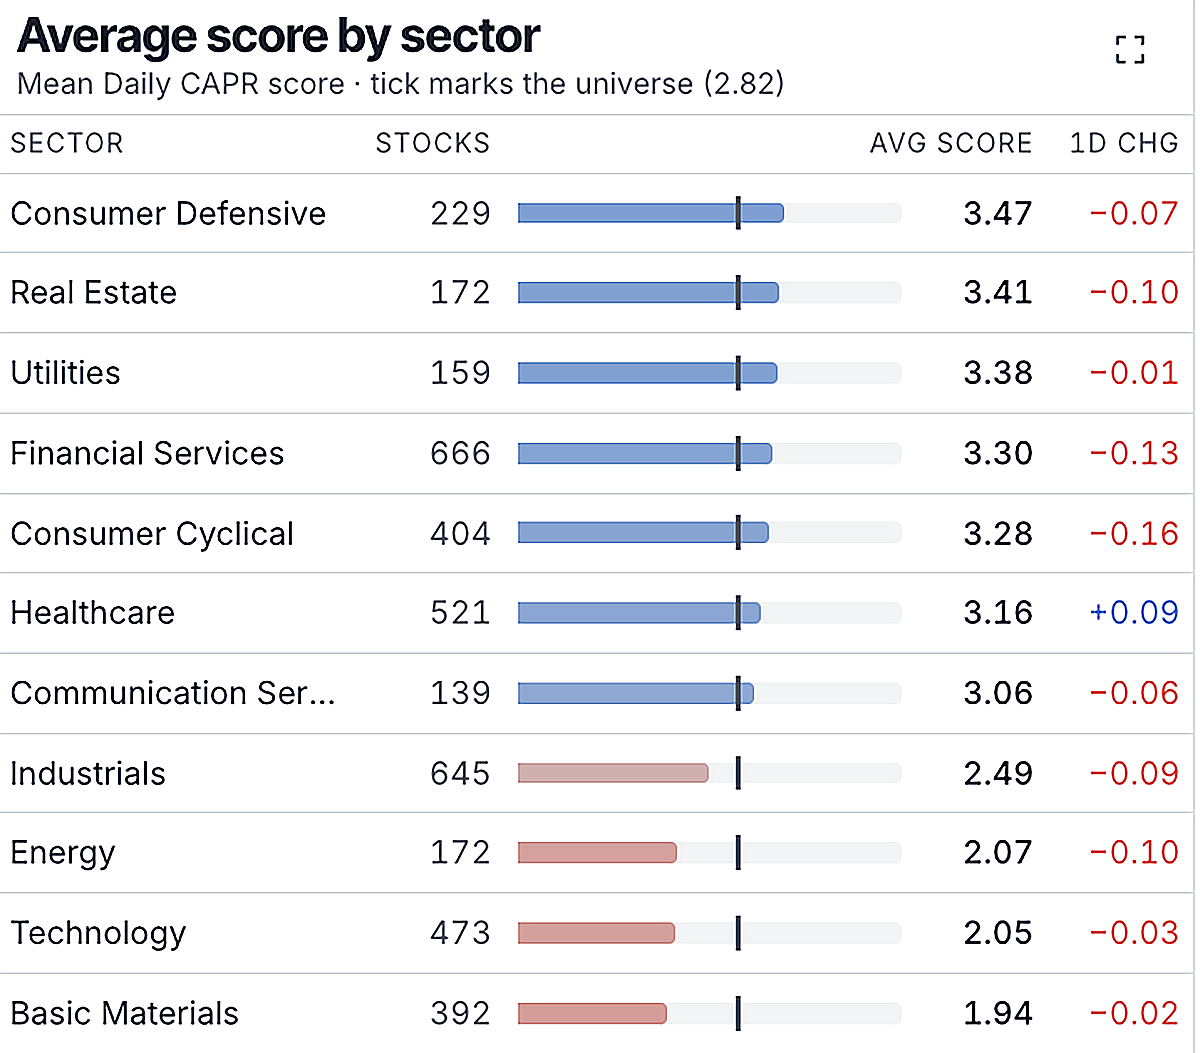
In the short term (using daily data), Technology is now one of the weakest sectors globally, alongside Basic Materials and Energy. This includes everything from US tech platforms to Korean AI hardware stocks. Meanwhile, Consumer Defensives, Real Estate, and Utilities are strong.
Daily CAPR Sector Average Trend Scores
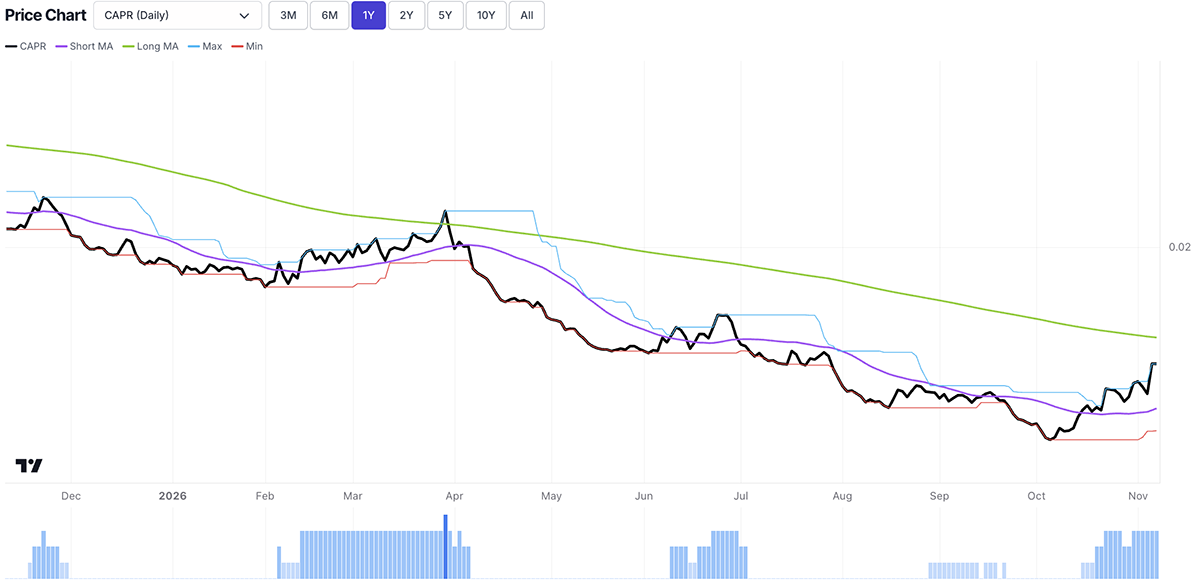
The rotation is not just into defensive sectors, but also into bonds. The next chart shows the relative performance of the US Treasury ETF (TLT) against the World Equity Index. When the black line is falling, equities are beating bonds. Since early October, the rotation from high-risk assets (the AI trade) into low-risk assets (defensive sectors) has included a rotation from equities into bonds. Investors are seeking safety.
US Treasuries in CAPR – One Year
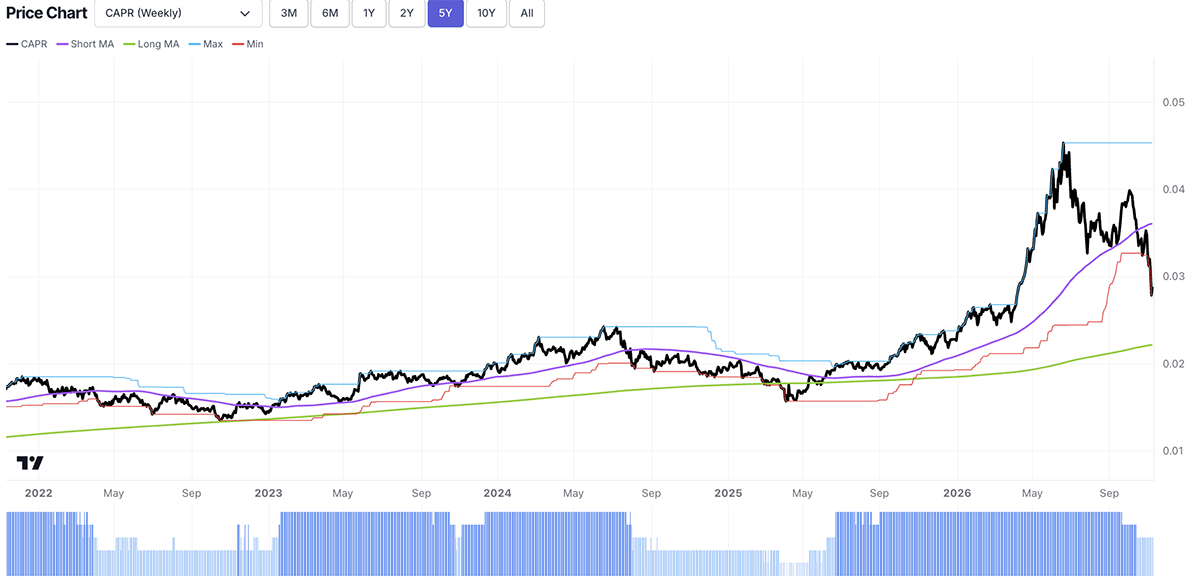
When we refer to the former market leaders, we mean the AI trade. Semiconductor stocks, which dominated in the first half of 2026, are now lagging the market. They are making new relative lows, having failed to make a new relative (CAPR) high during the September rebound. The ByteTrend CAPR Score is now a 3 for the first time in over a year.
Semiconductor ETF (SMH in CAPR) – Weekly, Past Two Years
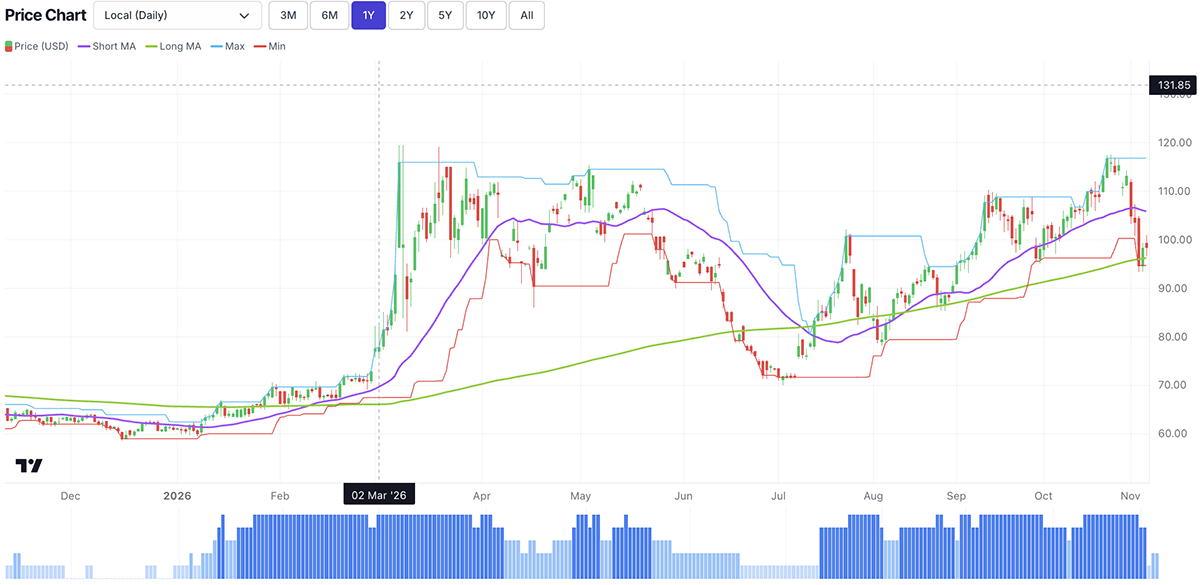
To finish, we look at oil and gold. Oil took a big hit following the midterms, as Trump appeared to walk back previous statements on renewed attacks against Iran. However, the 200-day moving average is still rising, and the oil price has remained above it, even as the problems have not gone away.
Brent Crude – Daily Price Trend, One Year
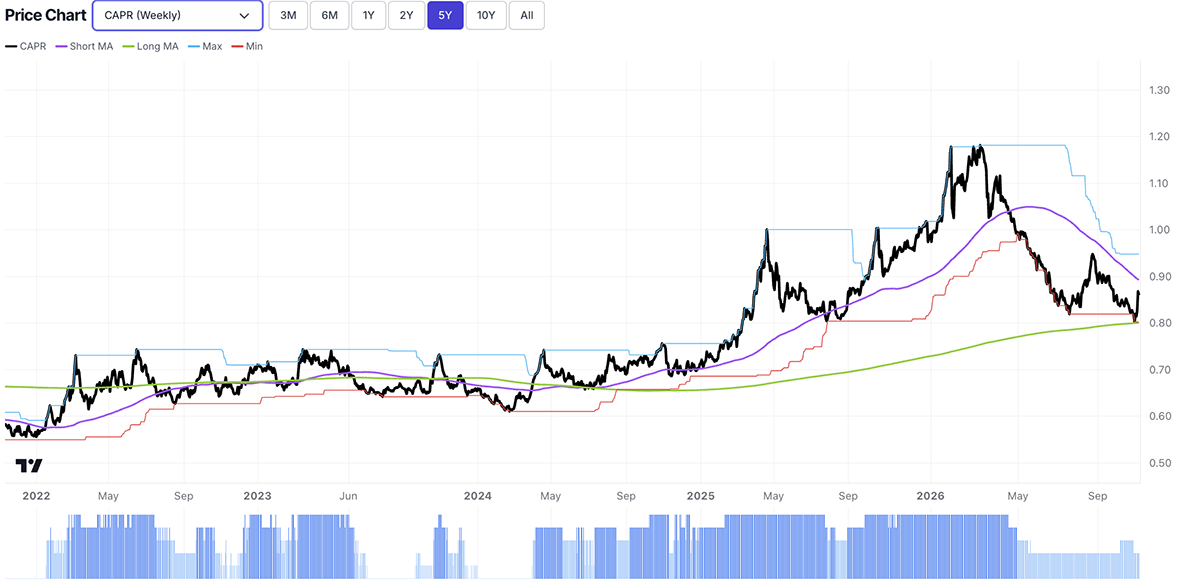
As for gold, the trend has weakened in the short term but remains strong on a long-term basis. It bounced sharply relative to equities (i.e. in CAPR) last week, resuming its role as a safe haven for investors during times of panic in the stockmarket.
Gold – CAPR Weekly, Five Years
Outlook
A rotation is not a crash. The index is falling, but not excessively, as weaker parts of the market replace the formerly strong ones. That may well change, and if so, a bear market will be underway. Nonetheless, the AI trade looks dead, but we can expect rallies during the bear. Meanwhile, more stocks are showing signs of life, meaning the historically high market concentration is normalising.
Thank you for reading our weekly Global Trends: Macro update. Follow us on X for additional updates and YouTube for video summaries of the data and trends. Please feel free to forward this note to anyone who may find it of interest.
All the best,
Charlie Morris and Kit Winder
Editors, Global Trends


