


The Multi-Asset Investor Quarterly Investor Letter: Q3 2026

Since 2016, our mission has been to help people invest more effectively. We do this by delivering actionable, high-quality investment guidance at an affordable price. With all the information out there, we help investors by distilling our advice into model portfolios, explaining every new investment recommendation in real time.
In this Q3 2026 update, I shall review our flagship product, The Multi-Asset Investor. You may instead opt to watch our Q3 review webinar, which goes into more detail.
Letter from Charlie Morris, CEO
Bond yields have become the most important macroeconomic theme. After the surge in 2022, the stabilisation is over, and new highs have been seen across the developed world. The standout exception has been China, where the housing slump has led to a period of debt deflation.
Global 10-Year Bond Yields
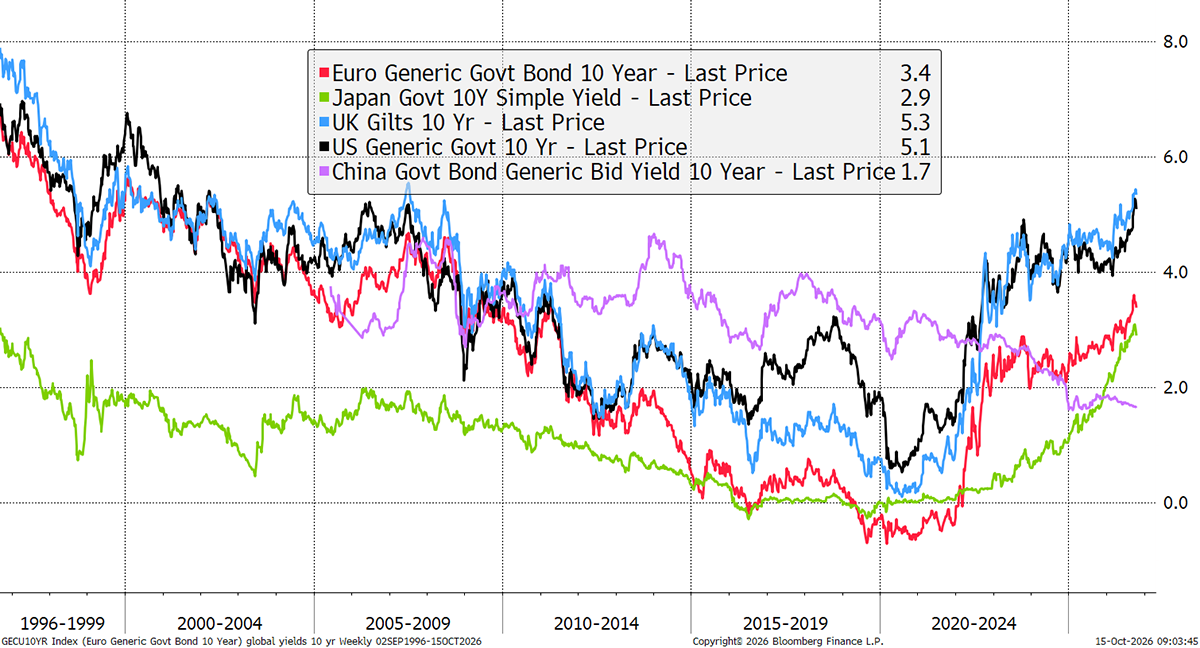
Some believe the rising yield reflects normalisation, as economies recover from the post-2008 era and the deflationary period of zero interest rates. Growth and inflation, especially in the US, have picked up, and yields reflect that. Others think this relates to creditworthiness, as ballooning deficits mean more bond issuance against tight budgets.
It is most likely normalisation at first, but since most economies cannot afford higher rates as the interest bill keeps on growing, it will end up morphing into a sovereign debt crisis. Governments should be radically cutting back spending before they are forced to do so by the markets. Some understand that; others don’t.
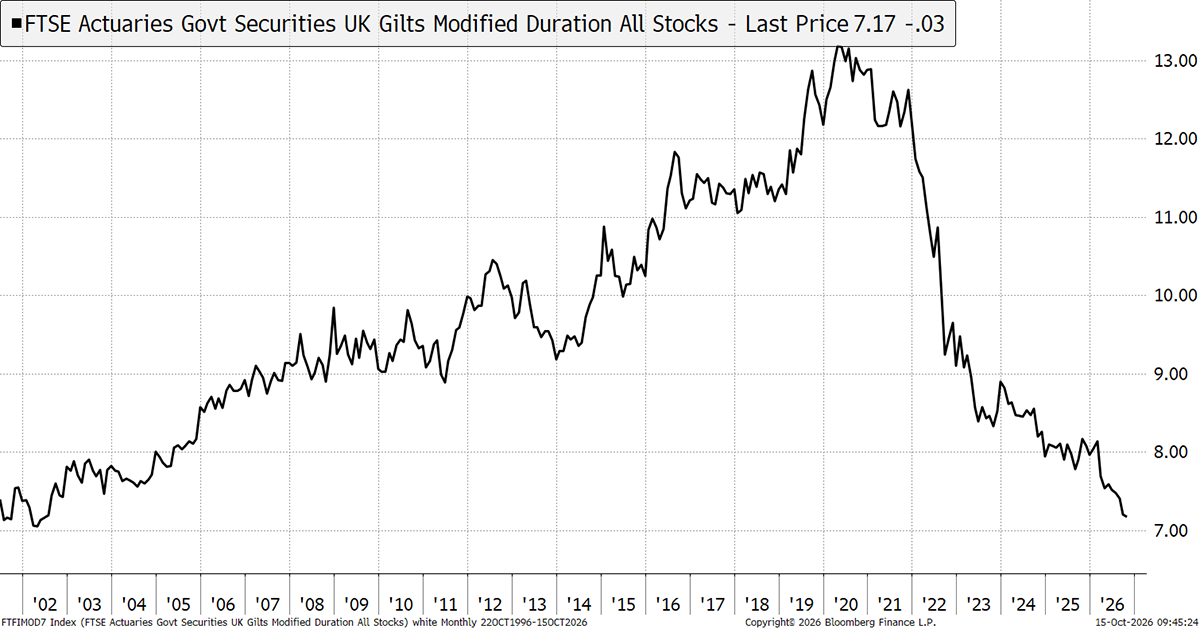
In recent issues, I have written about how higher yields affect market breadth and about “modified duration”, which measures bond risk. In 2020, gilts paid around 1%, at a time when a 1% move in the 10-year yield would lead to a 13% profit or loss on the capital. Today, they pay 5.5%, with a modified duration of 7%. In other words, a year’s income can practically withstand a 1% move in yields. This doesn’t make bonds a strong buy, but it certainly makes them less risky.
Gilt Index: Modified Duration
The breadth story is even more seismic. Rising yields make low-growth, or no-growth, stocks look bad as bonds pay more attractive yields. That prices growth at a premium, and since growth stocks are few compared to normal stocks, the market breadth has deteriorated. That means fewer stocks have been beating the market (blue), while many are lagging (red).
Global Equity Alpha Breadth is Weak
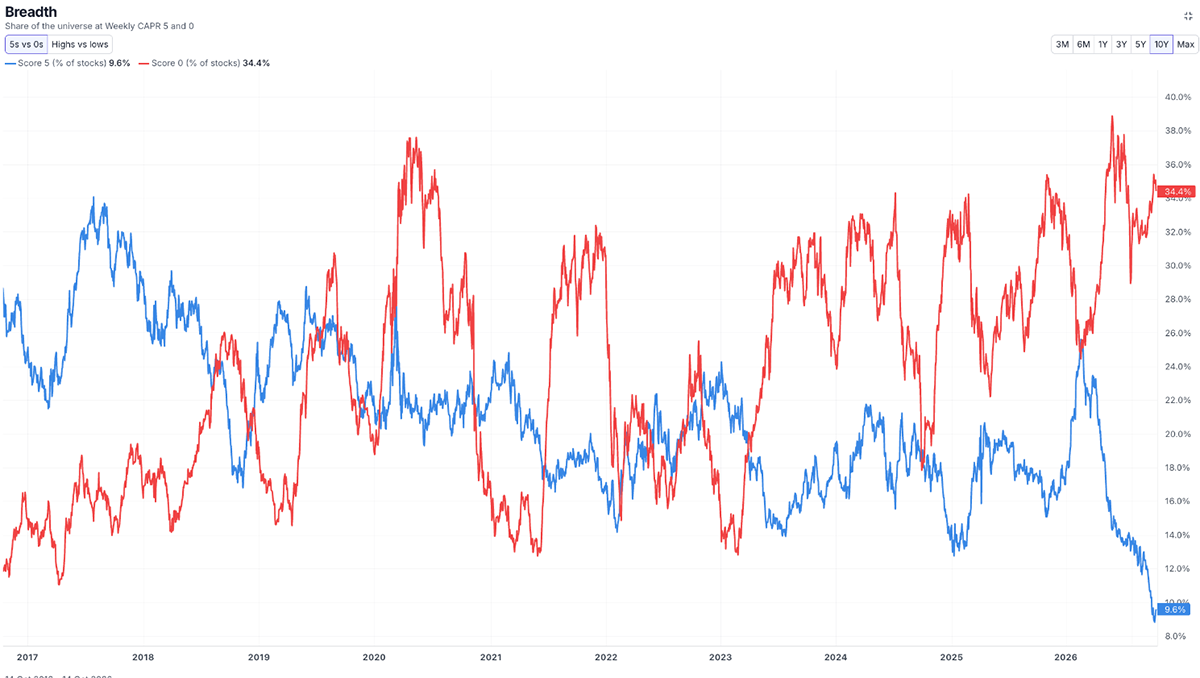
Our research suggests that this may be a record low going back decades, with similar readings not seen since the late 1990s. That was also a period of rising yields, which favoured growth stocks, while value was shunned.
To keep the market looking strong with low breadth, it follows that the large stocks are performing better than the smaller stocks. Growth stocks also tend to be more volatile than other stocks, which may be less exciting but offer greater certainty. It turns out that to beat the market, the best strategy is to embrace ultra-large and volatile stocks. Be sure, these are not normal times.
Global Stocks Size and Volatility
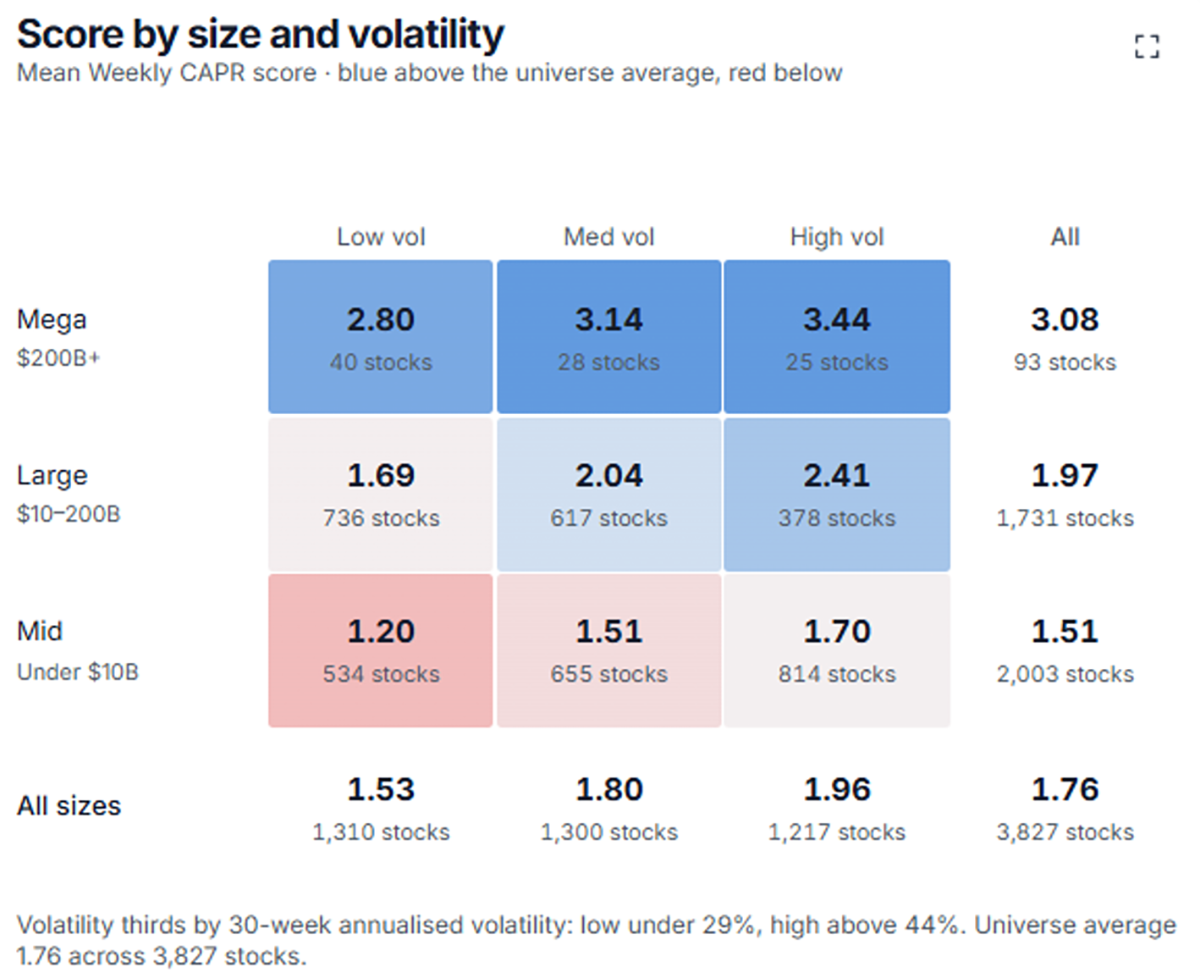
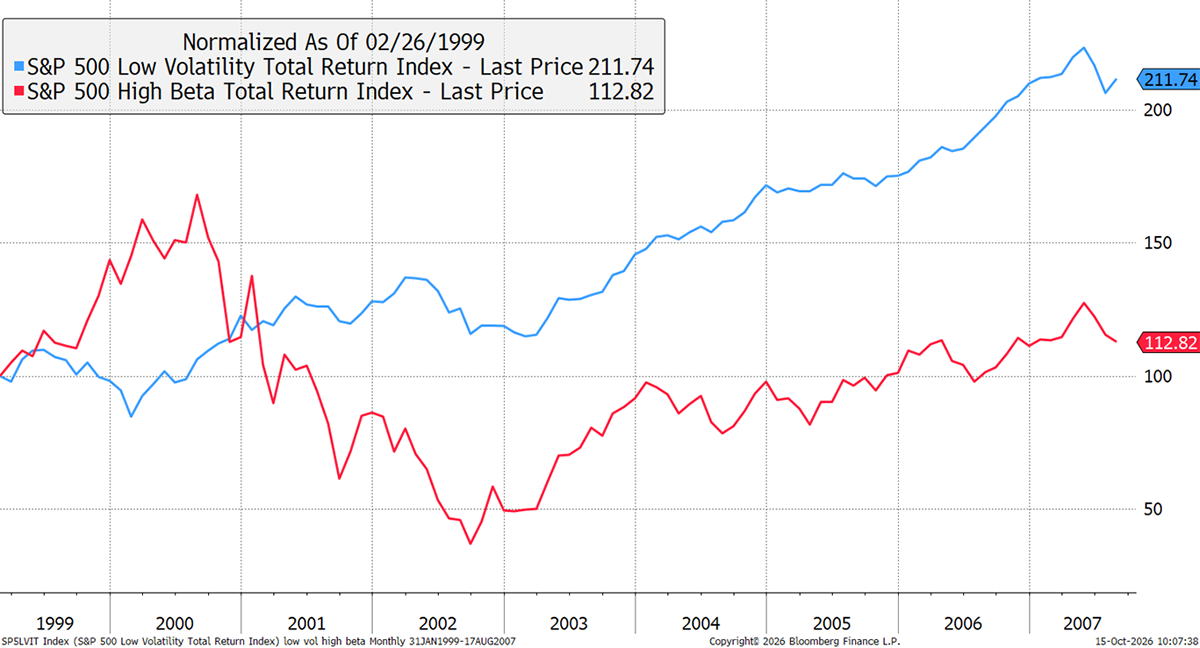
In contrast, calm small stocks are underperforming significantly and will offer a good opportunity when the tide turns. Once again, it reminds me of the late 1990s. The large, high-volatility stocks did well until they didn’t. After March 2000, the less volatile stocks and smaller caps led the market for the next six years.
High Beta vs Low Volatility post-Dotcom Boom
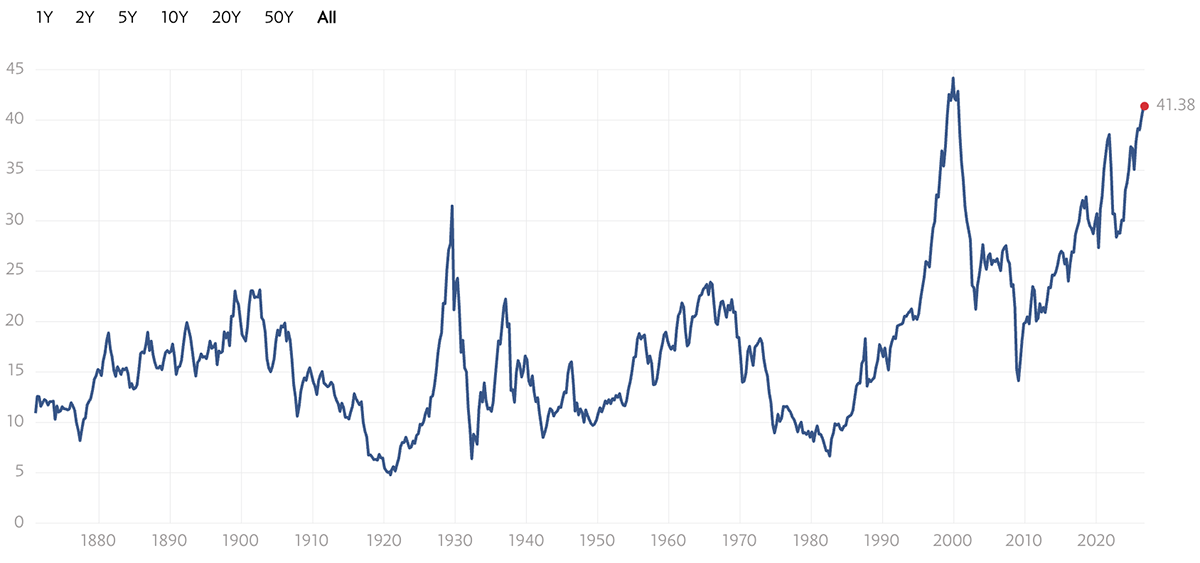
Of course, the backdrop to all this concentration and large-cap outperformance is very high valuations for the market. The Shiller P/E Ratio shows the price of stocks against their average earnings over the last ten years. The peak in 1929 was around 31x, the peak in 1999 was 45x, and today we are at 41x. During crashes, it has gone as low as 5x. Not only that, but margin debt is near historically extreme levels, suggesting investors are leveraged into this concentrated and overvalued market. This kind of situation makes the whole thing fragile.
Shiller P/E Ratio
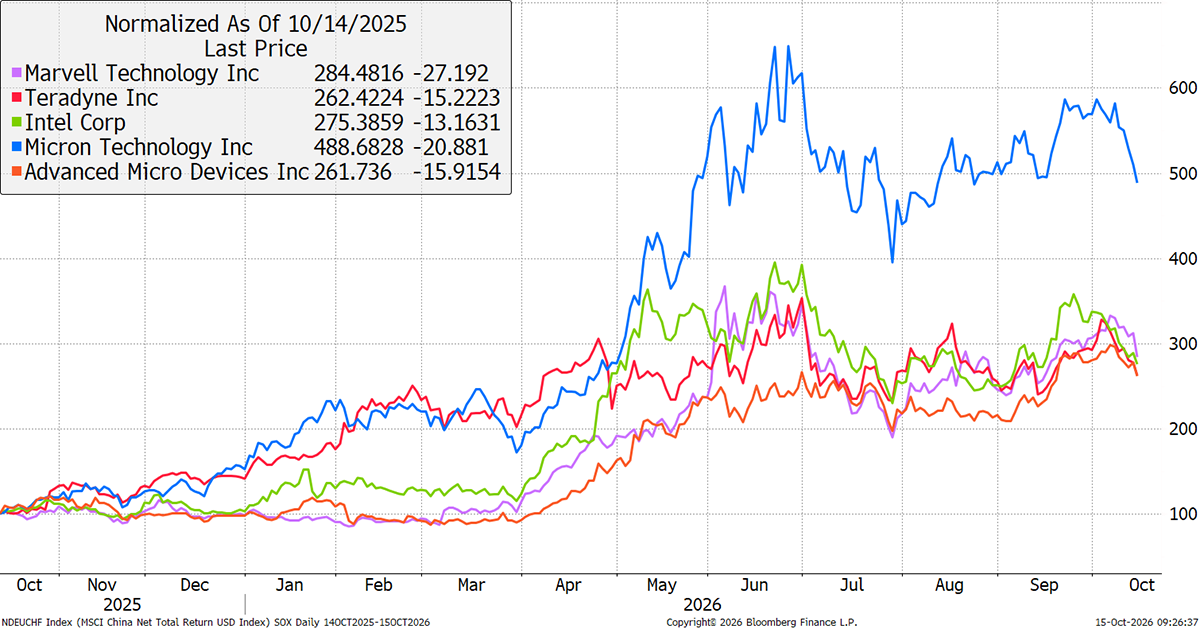
In the last few days, the AI trade has weakened once again. They pulled back initially in July, but didn’t crash. Now, they are falling again. There have been many false starts at the end of this bull market, which makes the bears nervous to claim the top is in for fear of being wrong again. For now, when tech weakens, capital flows back into the rest of the market: a rotation. Trouble will come when other sectors follow it lower in unison.
Semiconductor Stock Prices
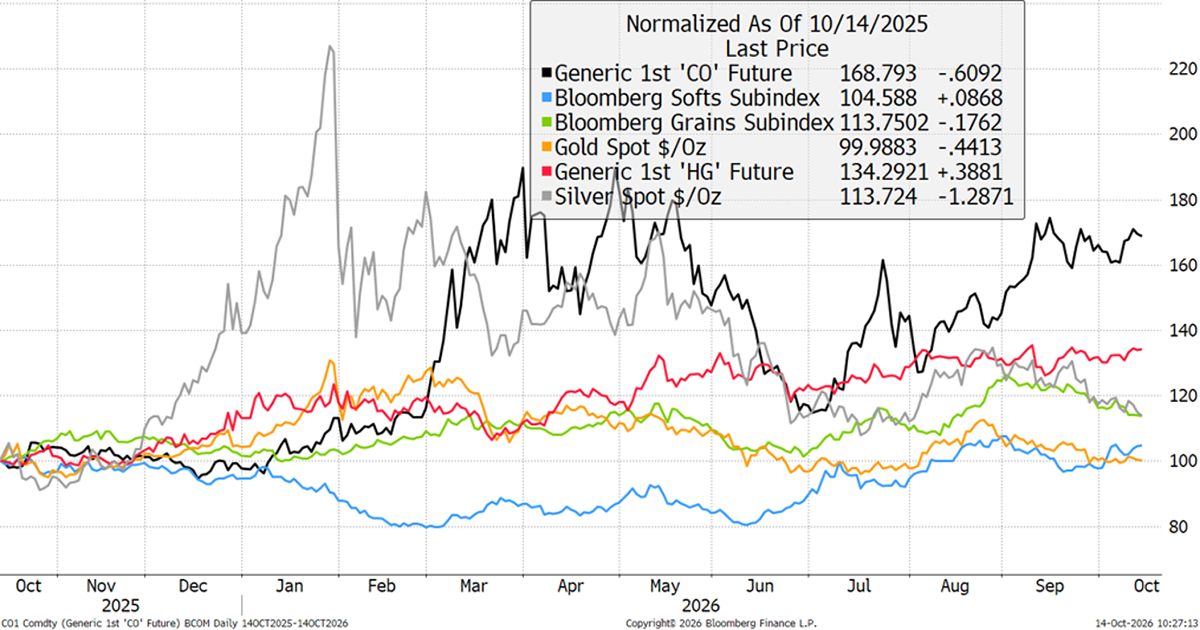
It has also been an interesting period in commodities. Oil has done well this year, followed by copper. Gold and silver were all the rage until January but have cooled since. Copper remains in high demand as the world electrifies, while agriculture has remained soft. This is despite the weather effects from El Niño and the surge in fertiliser prices.
Commodities Mixed but Positive
The Multi-Asset Investor
The Multi-Asset Investor is a commentary and two portfolios, Whisky and Soda, that cover traditional assets. The portfolios are designed to be easy to replicate for investors managing their own money. Soda is low turnover and medium risk. Whisky is more dynamic and medium-high risk. It is written by Charlie Morris and updated weekly, with additional Flash Notes when immediate action is required.
The Whisky Portfolio
Whisky had a good quarter, boosting returns to 13.6% in 2026, which is 3.7% ahead of its benchmark, the FTSE 100. The portfolio was sitting pretty in January, at the gold peak, and despite several reductions in exposure, performance cooled thereafter. Volatility followed in the second quarter, but this last quarter has been a calmer journey.
Whisky vs FTSE 100
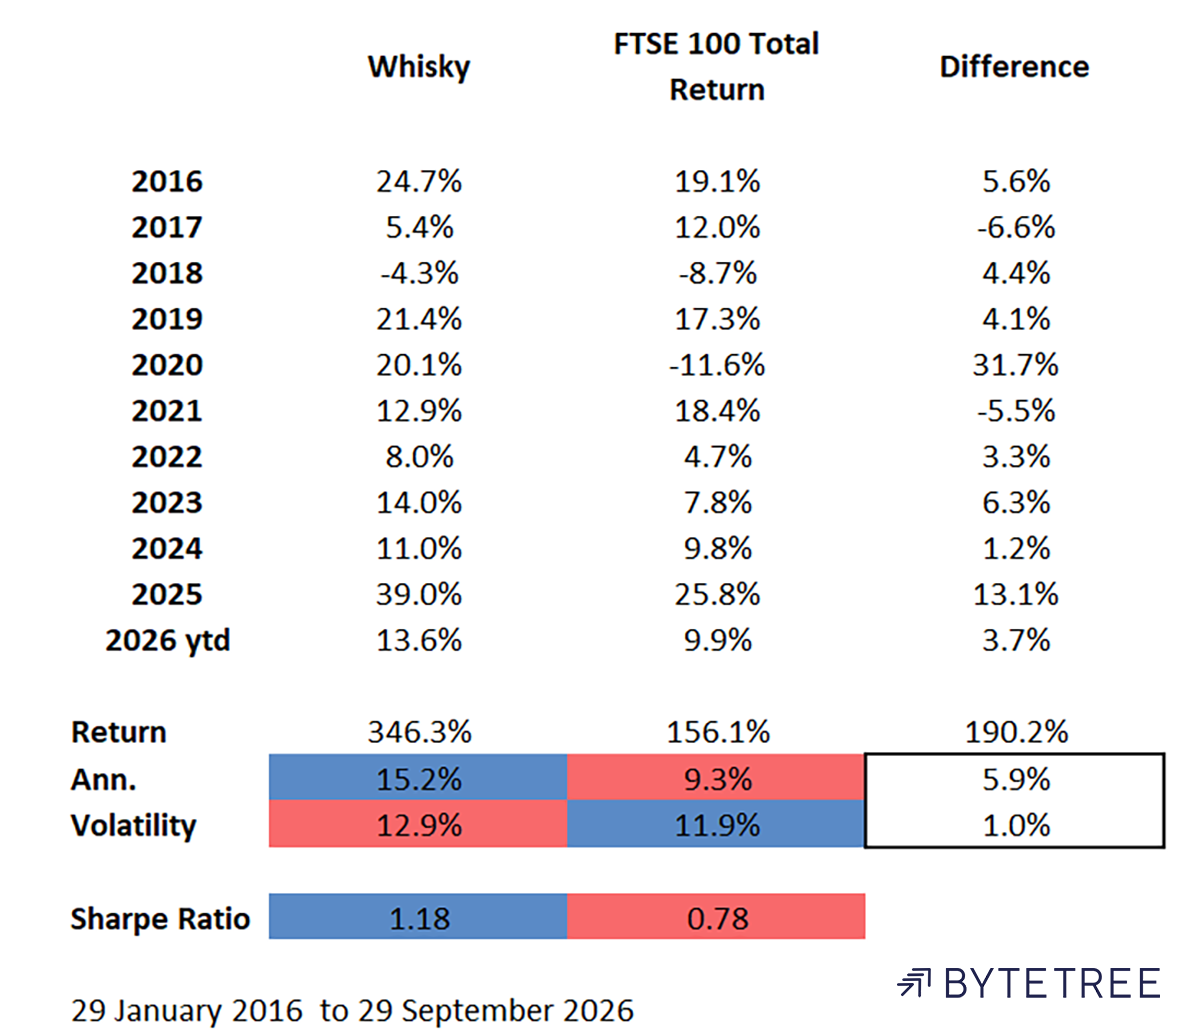
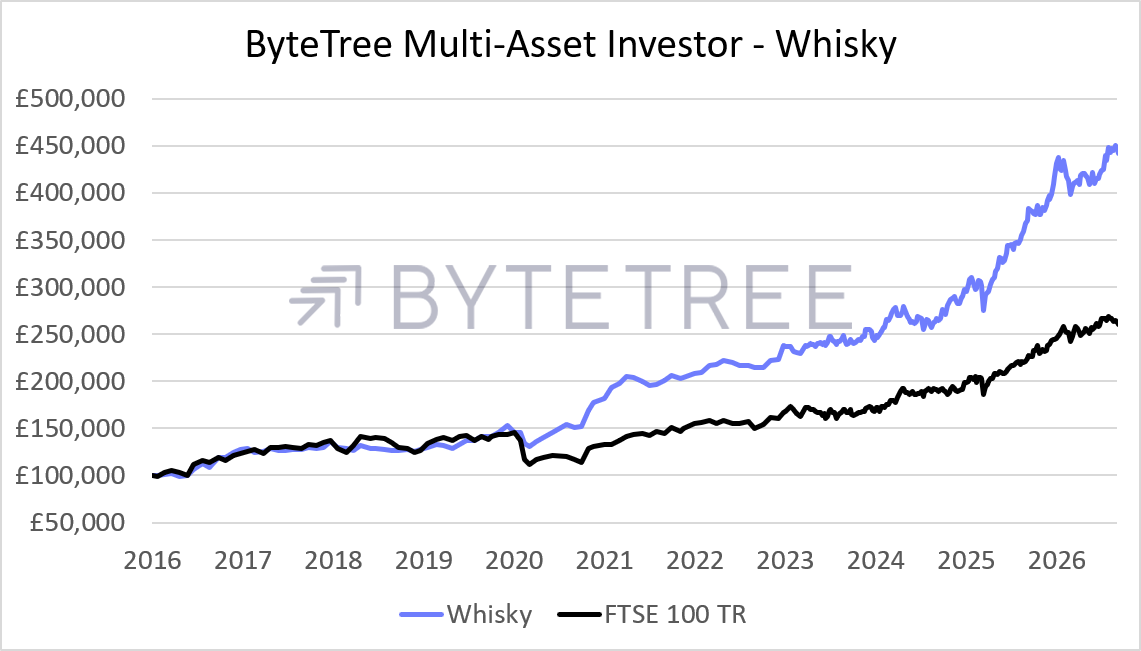
The long-term returns have been very satisfactory. The best years were 2020 and last year. 2020 benefited from early selling followed by pouncing on the recovery trade. Last year was buoyed by precious metals. This year has been lumpier, with a cornerstone in quality stocks and more tactical positions in value and momentum opportunities, as well as precious metals, a modest position in Bitcoin, and other commodities, mainly energy.
Whisky Portfolio Performance
The Soda Portfolio
In contrast to its strong result in 2025, Soda has lagged this year. It holds more conservative assets, such as balanced funds, value, quality and gold. It is 3.9% behind the balanced index in 2026. The index is heavily skewed toward US equities, which explains the outperformance. Knowing that large tech is a major bubble that could blow at any time, I have avoided it. Since 2022, Soda’s relative performance has been driven by that idea. When US tech surged, Soda lagged the market and vice versa.
Soda vs FTSE Private Balanced Index
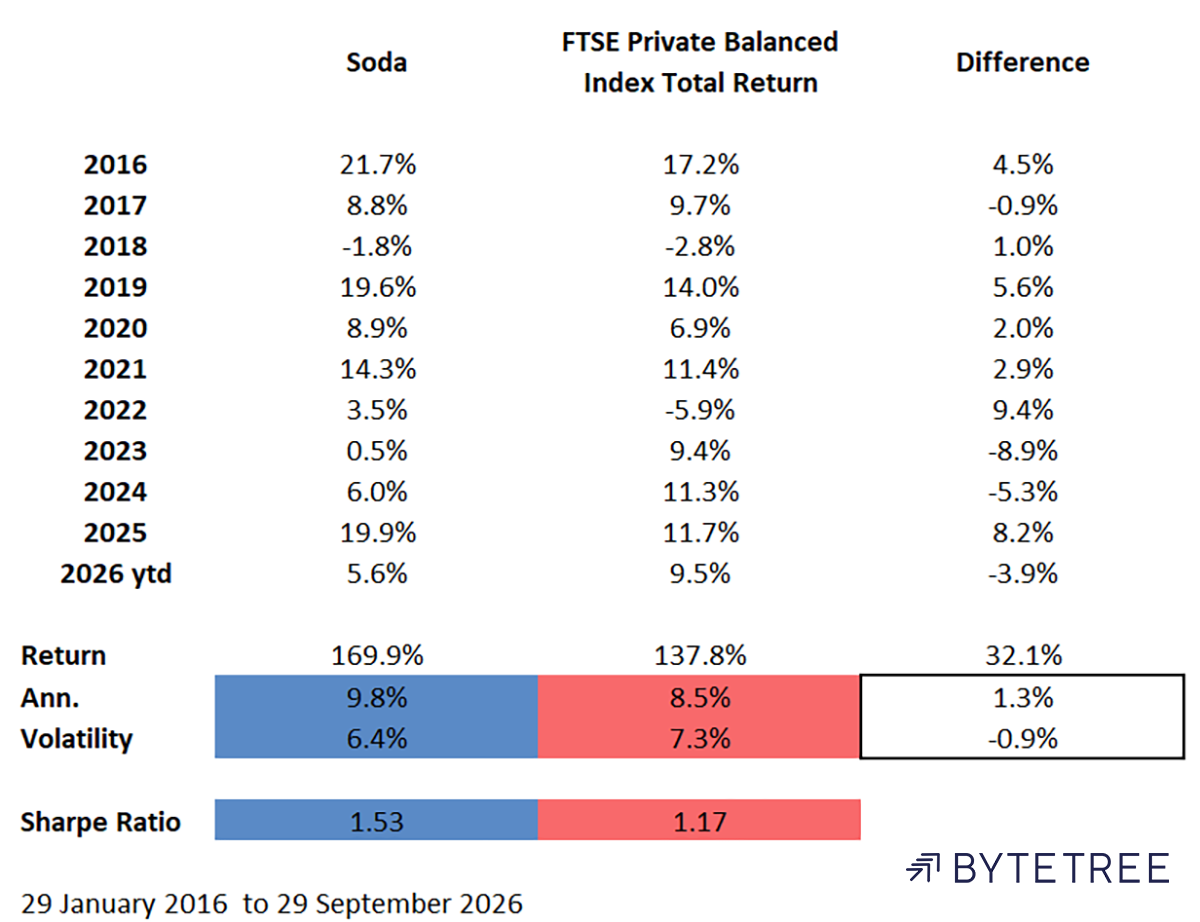
In Soda, my priority has always been, and always will be, capital preservation over capital gains, as shown by the persistently lower portfolio volatility. That tends to pay off the most when markets come under pressure and fare worse. Increasing risk, when it is least risky to do so, has resulted in attractive risk-adjusted returns.
Soda Portfolio Performance
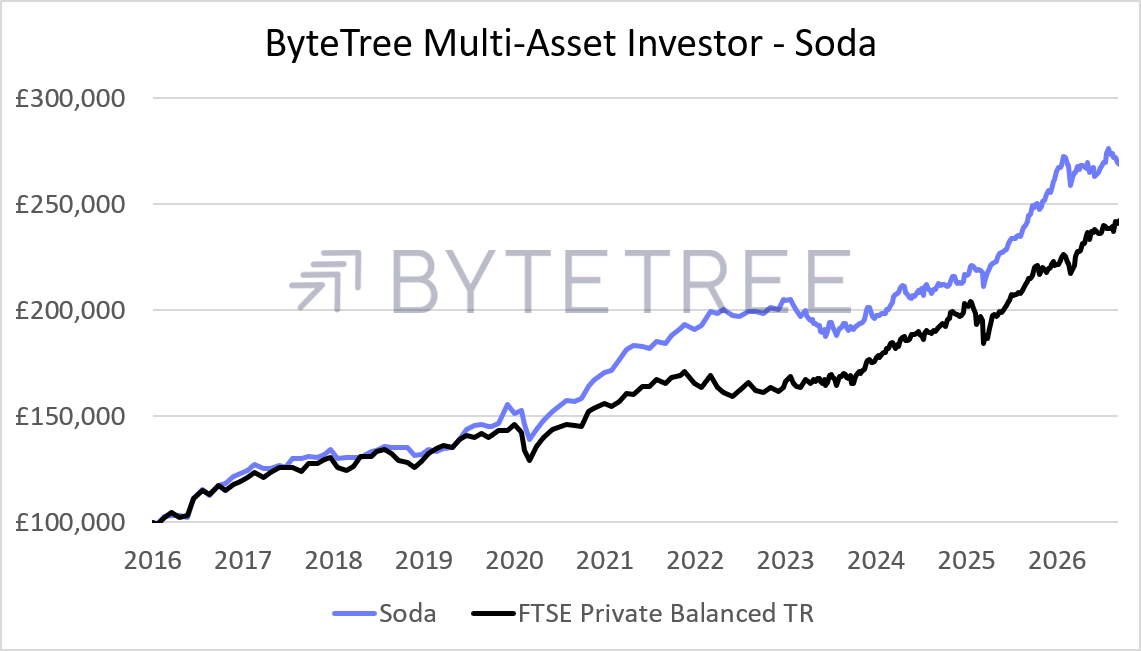
Long-term, we remain ahead of the market, but it has been challenging to widen that gap further in an environment where large tech has been the leading trade. When the breadth reverses, opportunities will be in abundance. I will be looking at oversold sectors such as property and the consumer, emerging market countries and small-caps. In that sense, good times lie ahead.
Outlook
Markets are extreme in many ways, as shown in equities, bonds and commodities. We have an energy shock combined with a bond shock, and a complacent stockmarket that assumes AI will plaster over the cracks. I believe change is coming, and investors who stick with diversification and sound financial analysis will weather the storm.
I discussed Q3 2026 in more detail during our recent webinar. Watch the recording:
General - Your capital is at risk when you invest, never risk more than you can afford to lose. Past performance and forecasts are not reliable indicators of future results. Bid/offer spreads, commissions, fees and other charges can reduce returns from investments. There is no guarantee dividends will be paid. Overseas shares - Some recommendations may be denominated in a currency other than sterling. The return from these may increase or decrease as a result of currency fluctuations. Any dividends will be taxed at source in the country of issue.
Funds - Fund performance relies on the performance of the underlying investments, and there is counterparty default risk which could result in a loss not represented by the underlying investment. Exchange Traded Funds (ETFs) with derivative exposure (leveraged or inverted ETFs) are highly speculative and are not suitable for risk-averse investors.
Bonds - Investing in bonds carries interest rate risk. A bondholder has committed to receiving a fixed rate of return for a fixed period. If the market interest rate rises from the date of the bond's purchase, the bond's price will fall. There is also the risk that the bond issuer could default on their obligations to pay interest as scheduled, or to repay capital at the maturity of the bond.
Taxation - Profits from investments, and any profits from converting cryptocurrency back into fiat currency is subject to capital gains tax. Tax treatment depends on individual circumstances and may be subject to change.
Investment Director: Charlie Morris. Editors or contributors may have an interest in recommendations. Information and opinions expressed do not necessarily reflect the views of other editors/contributors of ByteTree Group Ltd. ByteTree Asset Management (FRN 933150) is an Appointed Representative of Strata Global Ltd (FRN 563834), which is regulated by the Financial Conduct Authority.
© 2026 ByteTree Group Ltd


