


UK Pays 8x More for Natural Gas than the USA

Trades in Whisky;
September has arrived, which means it’s back to work. Market volumes are traditionally quiet over the summer, as investors flock to St Tropez, but then pick up in the autumn as they return to their desks. The markets are now facing reality: continued rising bond yields and energy prices.
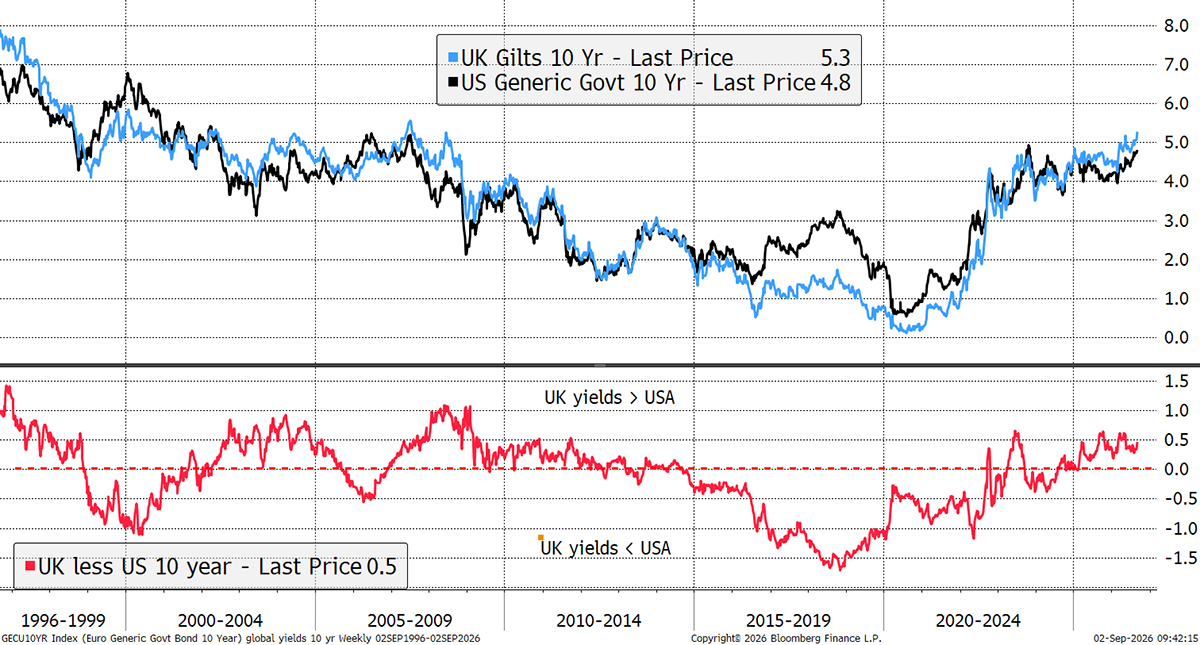
Lucky Andy Burnham ain’t so lucky now. The UK 10-year gilt yield approaches 5.3%, which we haven’t seen since before the credit crisis. Higher government borrowing costs are no longer a risk; they are here.
UK vs USA 10-Year Bond Yield
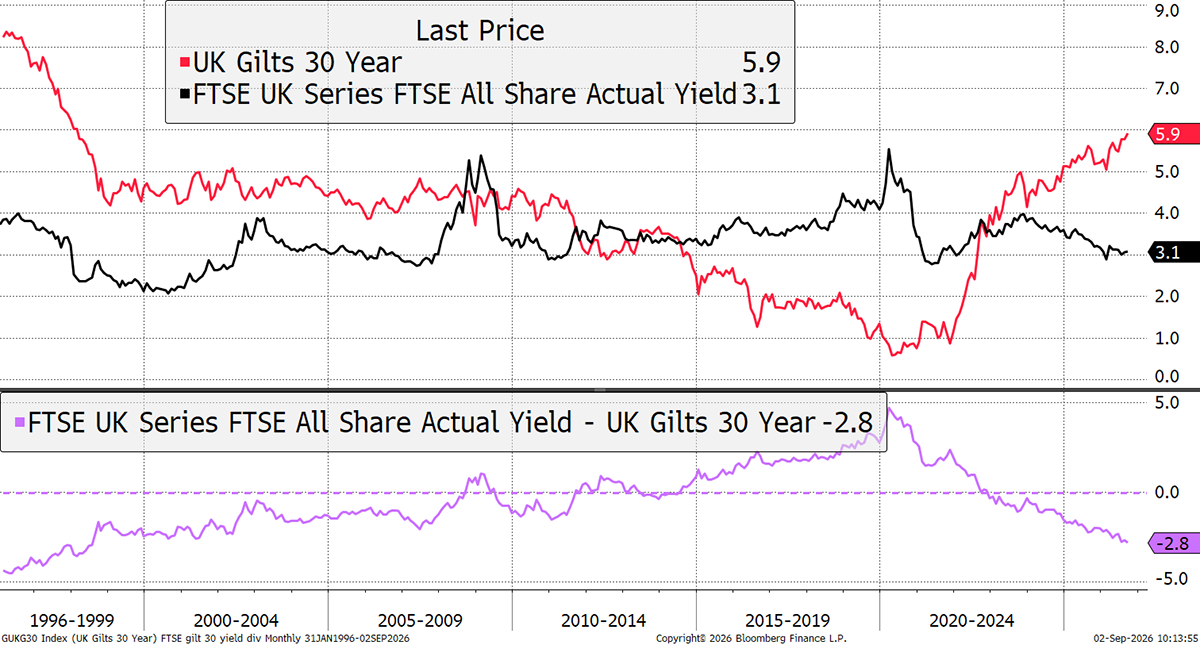
The UK 30-year yield is just shy of 6%, while the FTSE dividend yield is 3.1%, which is slightly below the historical average of 3.3%. Yet, the spread between them is wide at 2.8%. In other words, the so-called “risk-free” rate of return from gilts comfortably exceeds equity yields. In normal times, whatever they are, this would be an attractive time to increase exposure to long-dated gilts.
UK Equity Dividend Yield vs the Long Gilt
But these are not normal times because levels of government borrowing are high, and that comes at a time when public spending is out of control and inflationary forces are building.
The Wicksell Spread in the UK shows nominal GDP growth (growth plus inflation) against the 10-year gilt yield. They should naturally follow one another. The bad news is that most of the 4.1% nominal growth comes from inflation, as real growth is just 1.2%.
In the two decades before the 2008 financial crisis, UK growth averaged 2.9%, and just 1.2% since. BREXIT is often blamed, but statistically speaking, it was 2008, hands down, that curtailed not just UK growth, but European growth as well. Europe was especially heavy on bank regulation post 2008. In contrast, the US had a lighter touch, which meant the recovery was much swifter. A healthy banking sector greases the cogs of growth.
UK Wicksell Spread: Nominal GDP less 10-Year Gilt Yields
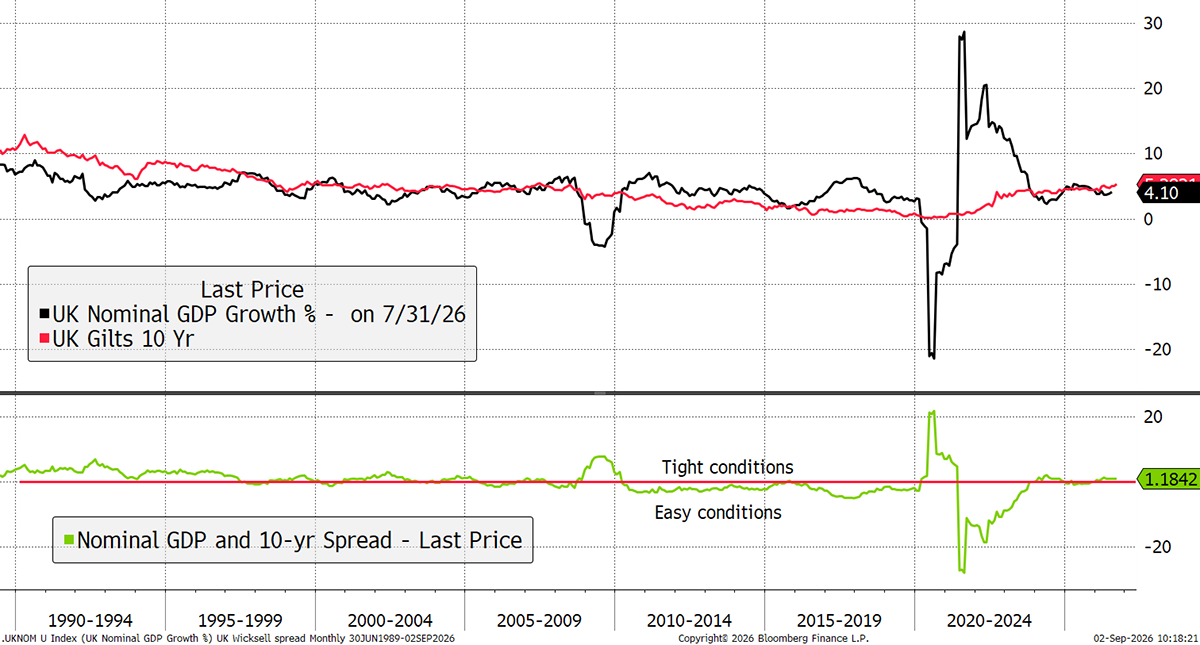
The Wicksell spread shows us how UK bond yields are behaving rationally. If growth or inflation were to pick up, bond yields would rise. Growth may improve, but there is no evidence of it coming our way.
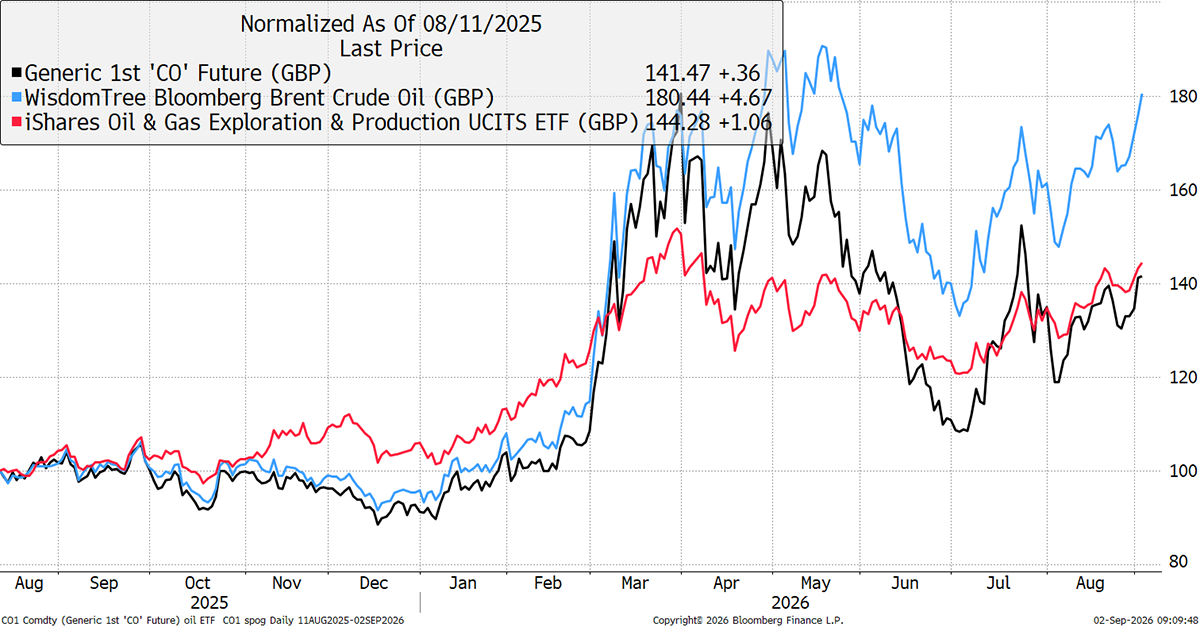
Unfortunately, inflation will continue to rise because the closure of the Strait of Hormuz is starting to bite. The oil price isn’t feeling the full force as China has reduced demand and other producers have stepped in. But for downstream products such as diesel, jet fuel, fertilisers, and thousands of other products, the squeeze is underway.
Brent Crude Oil, BRNB ETF, and Oil Stocks
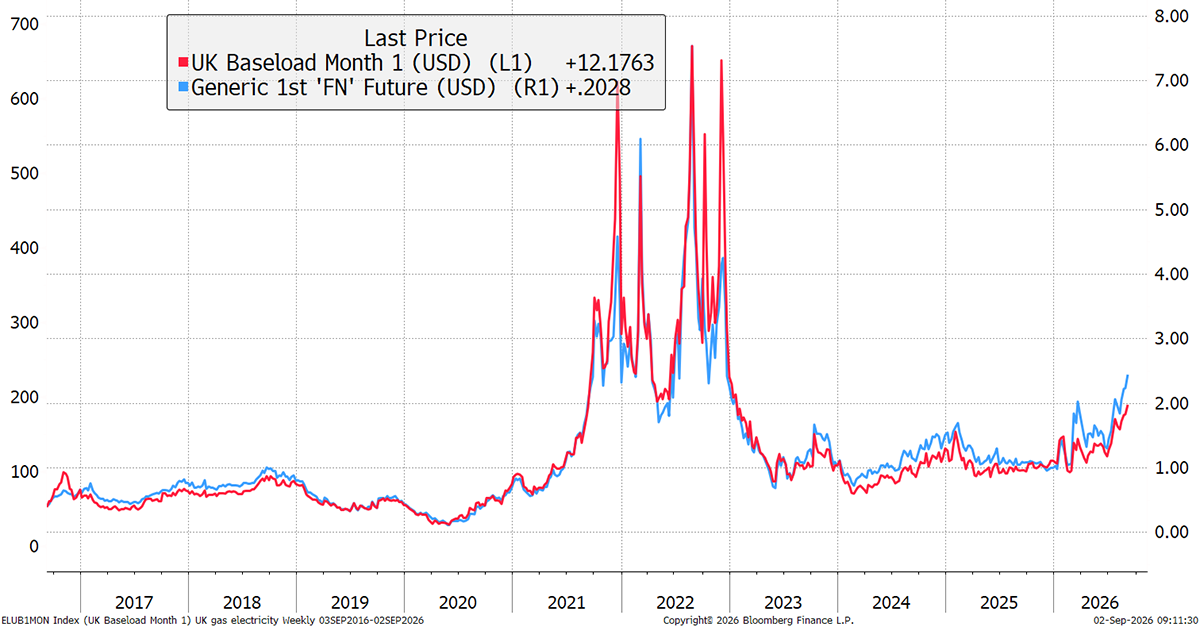
Another pinch point is the price of North Sea Gas. That has more than doubled this year, and it sets the price of electricity, known as baseload. With gas and electricity making three-year highs, who knows where this peaks? Now that Qatar is out of the picture, the UK gets roughly half of its gas from the North Sea, with the rest from Norway and the USA.
North Sea Natural Gas and UK Baseload
This next chart is truly extraordinary. Pre-2010, North Sea and US natural gas prices were approximately the same. They started to diverge in 2014, but the UK price fell back during the pandemic. Since then, North Sea gas has soared amid the Ukraine War and is rising again as the Strait of Hormuz tightens global supplies. The price of natural gas in the UK is now 8 times what it is in the USA, an all-time high.
UK vs USA Natural Gas Price per MMBtu
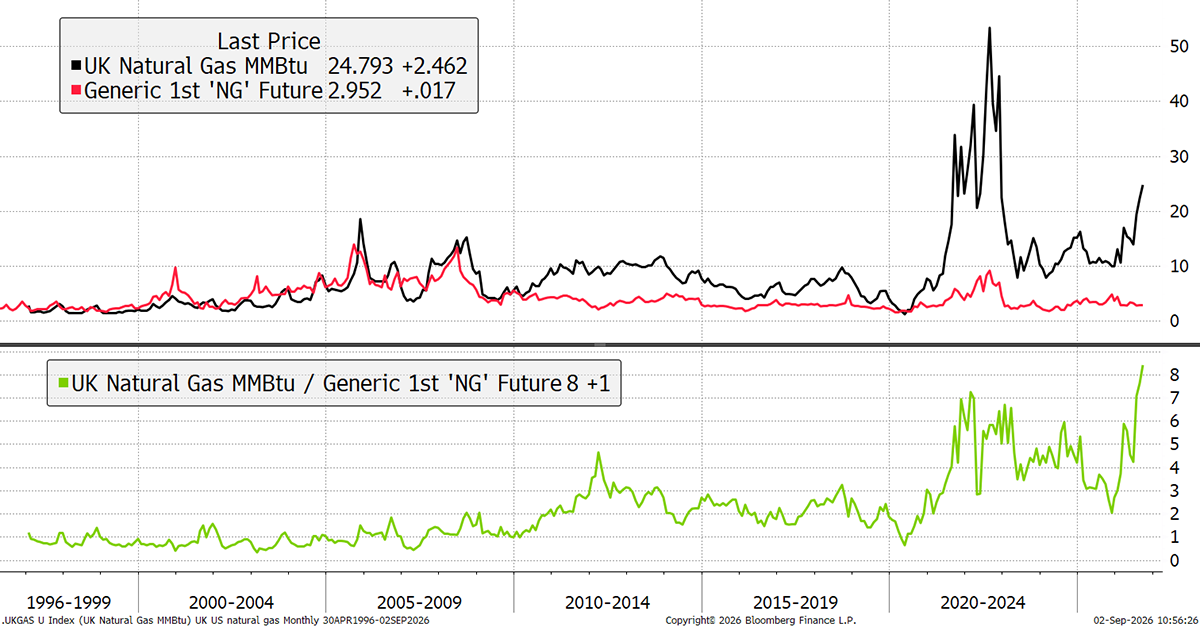
This is another crisis in the making, as the UK consumer will pay the price of the War in Iran. Rates may be forced higher, and the people will once again feel the pinch. As I said, Unlucky Andy.
General - Your capital is at risk when you invest, never risk more than you can afford to lose. Past performance and forecasts are not reliable indicators of future results. Bid/offer spreads, commissions, fees and other charges can reduce returns from investments. There is no guarantee dividends will be paid. Overseas shares - Some recommendations may be denominated in a currency other than sterling. The return from these may increase or decrease as a result of currency fluctuations. Any dividends will be taxed at source in the country of issue.
Funds - Fund performance relies on the performance of the underlying investments, and there is counterparty default risk which could result in a loss not represented by the underlying investment. Exchange Traded Funds (ETFs) with derivative exposure (leveraged or inverted ETFs) are highly speculative and are not suitable for risk-averse investors.
Bonds - Investing in bonds carries interest rate risk. A bondholder has committed to receiving a fixed rate of return for a fixed period. If the market interest rate rises from the date of the bond's purchase, the bond's price will fall. There is also the risk that the bond issuer could default on their obligations to pay interest as scheduled, or to repay capital at the maturity of the bond.
Taxation - Profits from investments, and any profits from converting cryptocurrency back into fiat currency is subject to capital gains tax. Tax treatment depends on individual circumstances and may be subject to change.
Investment Director: Charlie Morris. Editors or contributors may have an interest in recommendations. Information and opinions expressed do not necessarily reflect the views of other editors/contributors of ByteTree Group Ltd. ByteTree Asset Management (FRN 933150) is an Appointed Representative of Strata Global Ltd (FRN 563834), which is regulated by the Financial Conduct Authority.
© 2026 ByteTree Group Ltd


