
The AI Boom Leads Bitcoin and Gold

ByteTree BOLD Index Monthly Rebalancing Report;
The 21Shares Bitcoin Gold ETP (BOLD) invests in Bitcoin and Gold. BOLD combines the world’s two most liquid alternative assets on a risk-adjusted basis. Due to their naturally low correlation, the diversification benefits of holding both assets have been unusually high. Bitcoin prefers risk-on market conditions, while Gold prefers risk-off.
The target weights last month were 42.9% and 57.1% (Bitcoin to Gold). Price changes over the month led to the last day’s weights at 42.2% Bitcoin and 57.8% Gold. This means the latest rebalance has increased Bitcoin by 1.0% and reduced Gold to meet the new target weights.
To see the slide pack, please click here.
BOLD Performance
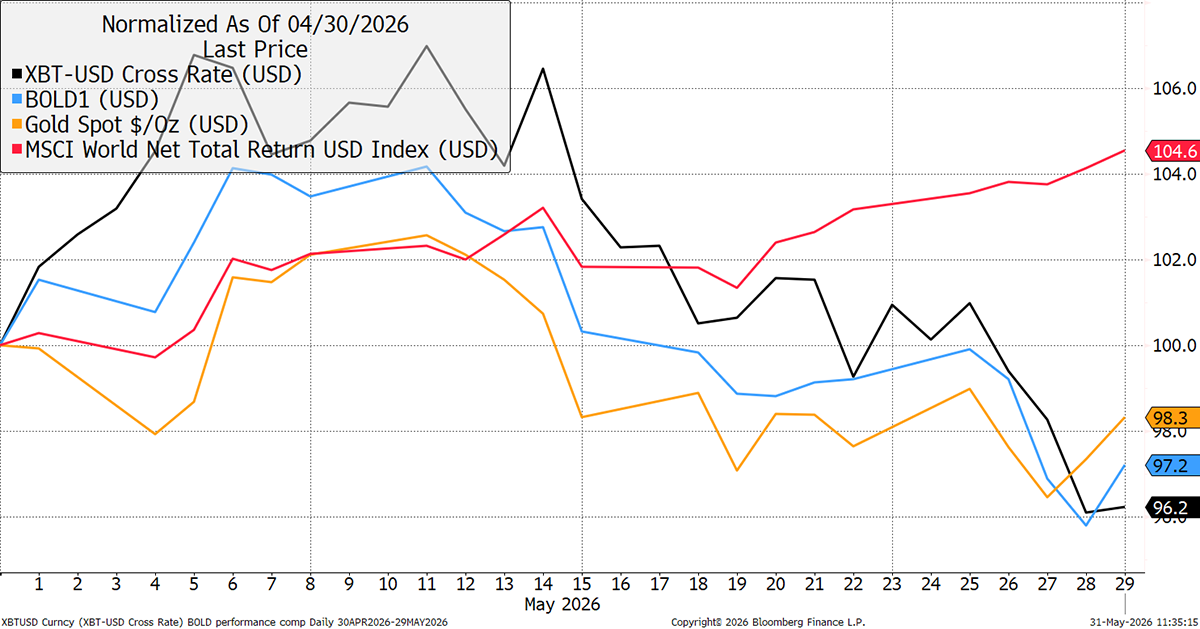
In April, BOLD fell by 2.8%, while Bitcoin returned -3.8%, Gold -1.7%, and global equities +4.6%, in USD terms. Equities have broken away from Bitcoin and Gold over the past fortnight, driven by technology hardware linked to the AI boom.
Bitcoin, Gold, BOLD, and Equities in USD – May 2026
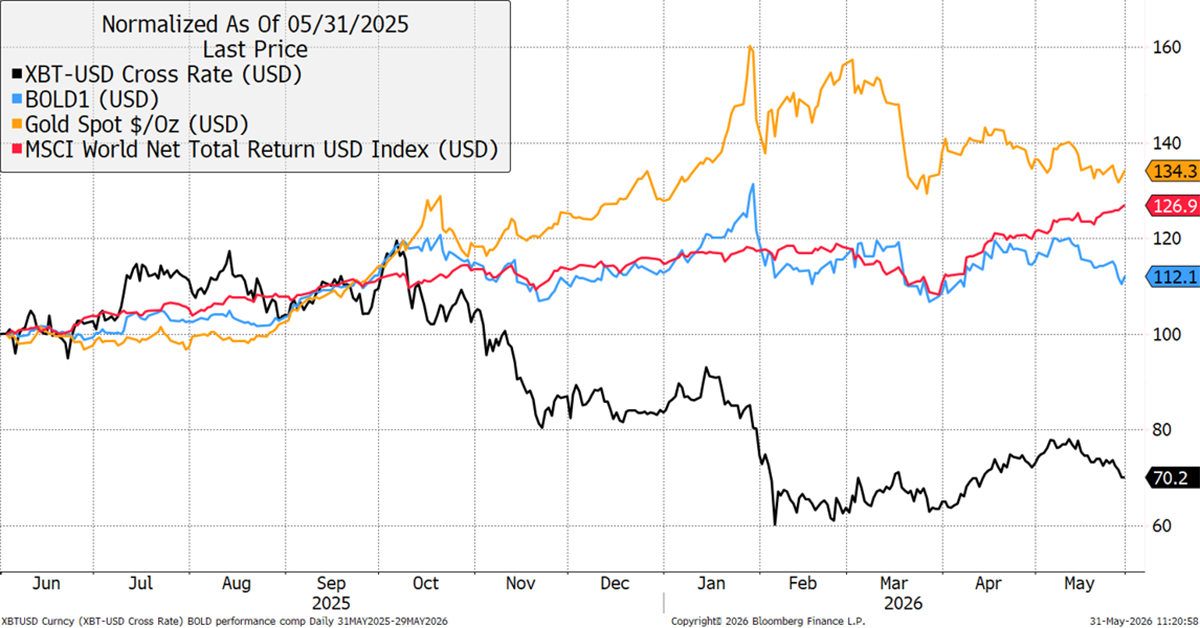
Over the past year, BOLD has returned 12.1%, Bitcoin has returned -29.8%, while Gold has returned +34.3%, and equities +26.9%. BOLD had been moving in sync with equities, which have now broken away. The AI boom is sucking capital away from the rest of the market.
Bitcoin, Gold, BOLD, and Global Equities in USD - Past Year
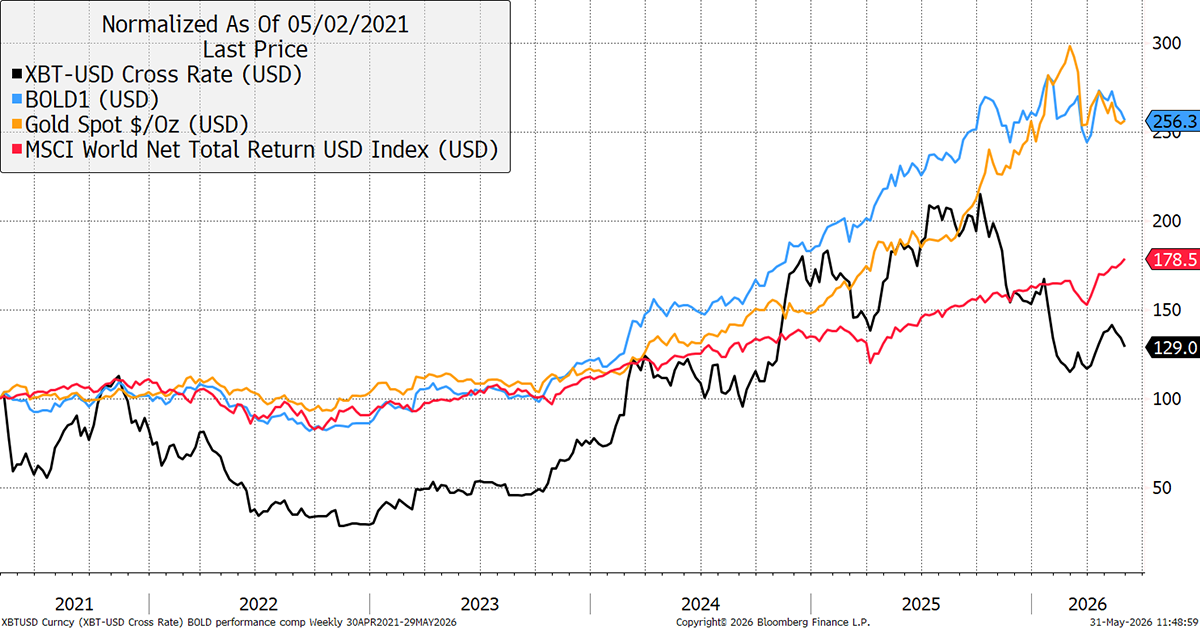
Over the past five years, BOLD has returned +156.3%, while Bitcoin has returned +29.0%, Gold +156.6%, and equities +78.5%. The average return of Bitcoin and Gold was 93.0%, yet BOLD returned 156.3%, demonstrating 63.4% of added value. This is mainly driven by rebalancing transactions. Note how BOLD has matched Gold during a strong period, despite a weak Bitcoin.
Bitcoin, Gold, BOLD, and Global Equities in USD - Past Five Years
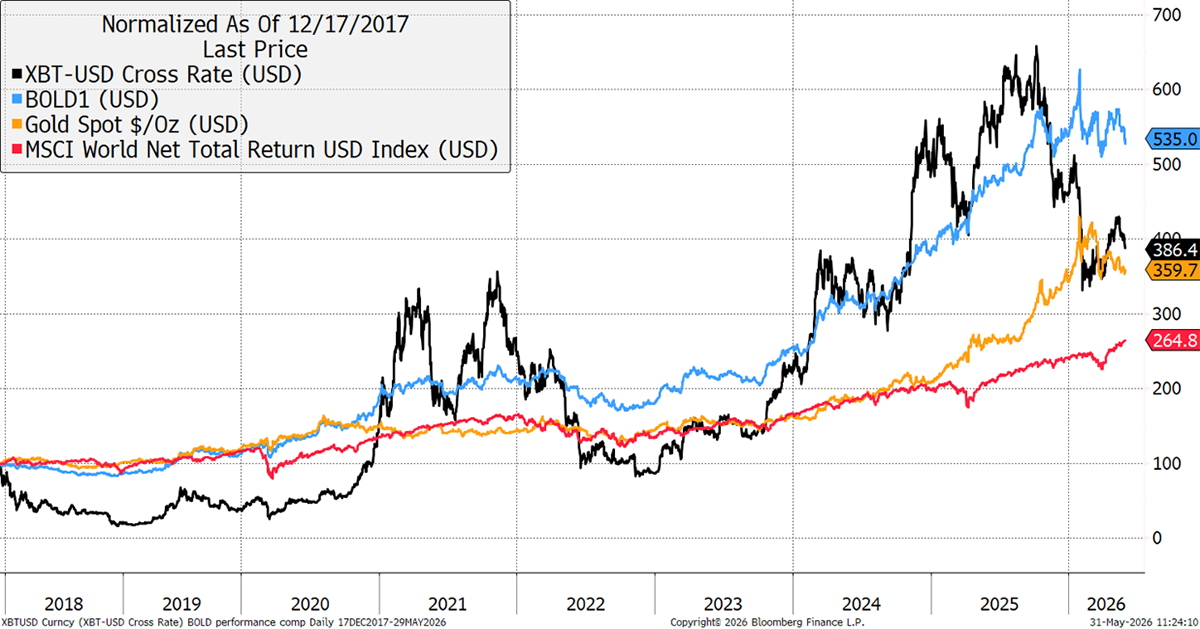
BOLD’s excess return is best demonstrated by the Bitcoin price high at $19,041 on 17th December 2017, which seemed extreme at the time. Since then, BOLD has returned +435%, while Bitcoin has returned +286.4%, Gold +259.7%, and equities +164.8%. The average return of Bitcoin and Gold was 273.1%, yet BOLD was +162% ahead. Over these longer periods, BOLD has been comfortably ahead of both Bitcoin and Gold. While Bitcoin and Gold can experience significant rallies and falls, BOLD helps lock in those gains.
Bitcoin, Gold, BOLD, and Global Equities in USD - Since Bitcoin’s 2017 Price High
Monthly Rebalancing of the BOLD ETP
BOLD allocates to Bitcoin and Gold on a risk-adjusted basis using historical volatility calculated from daily price movements. The less volatile asset, with lower daily price moves, receives a higher weight in the index at the end of the monthly rebalancing.
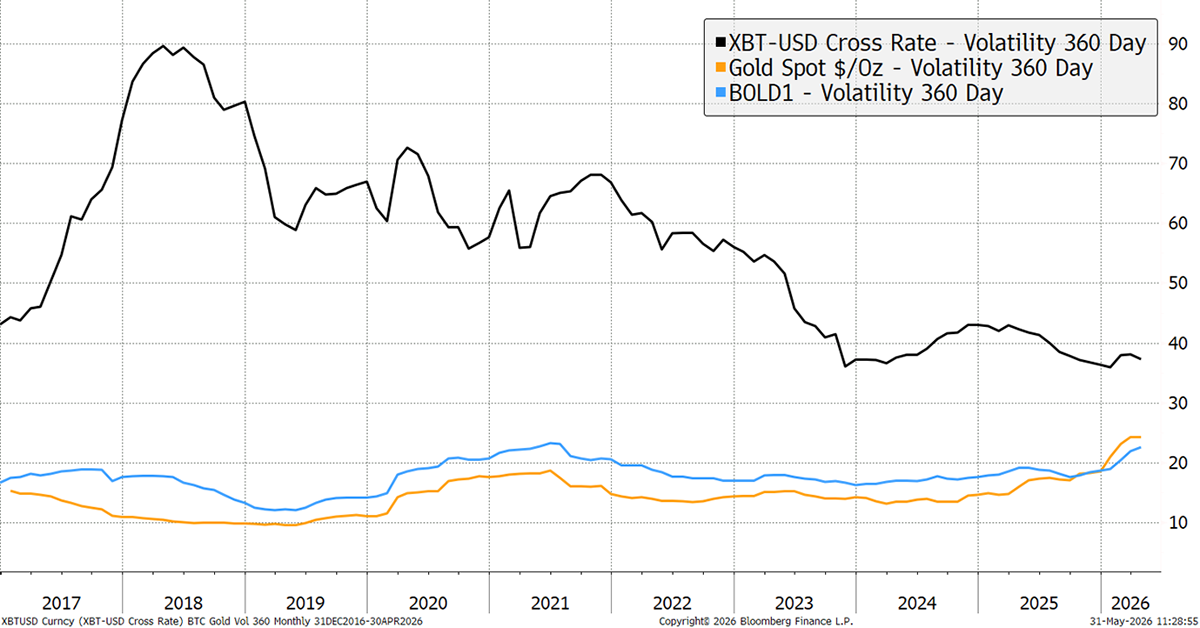
It is notable that Bitcoin’s 360-day volatility has been falling, while Gold’s has been rising. Note that Bitcoin’s short-term 180-day volatility is cooling again, which will slow the decline in the 360-day volatility in the coming months. For Gold, the 180-day measure is leading Gold’s volatility higher. The gap between the asset volatilities has never been narrower than it is today.
Bitcoin and Gold’s Past 360-day Volatility
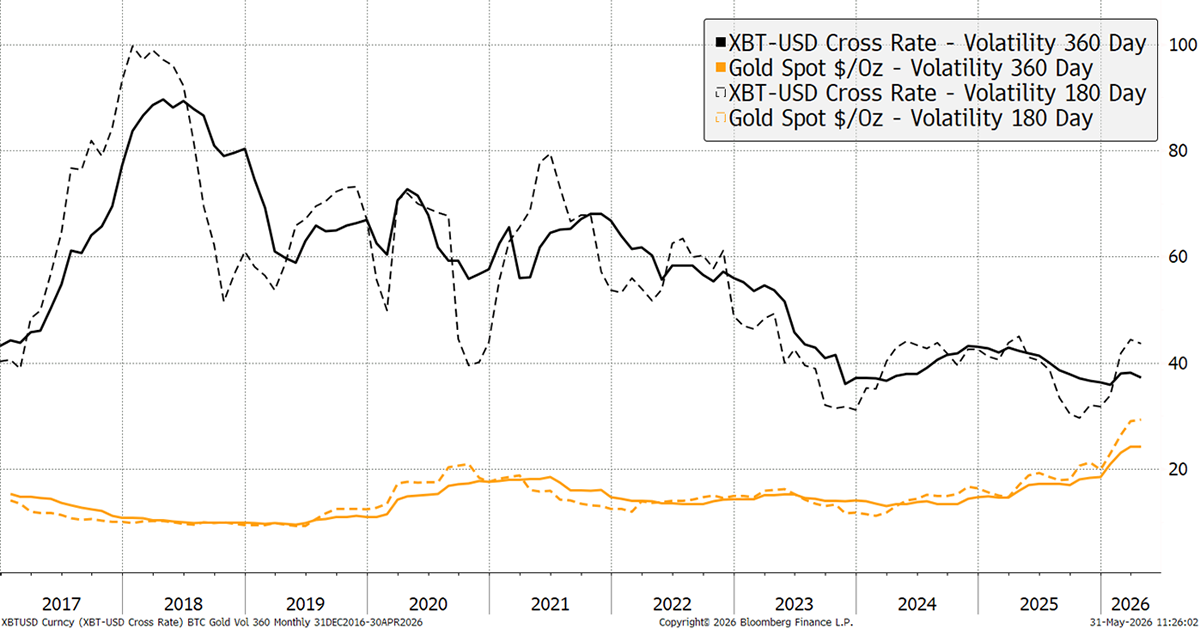
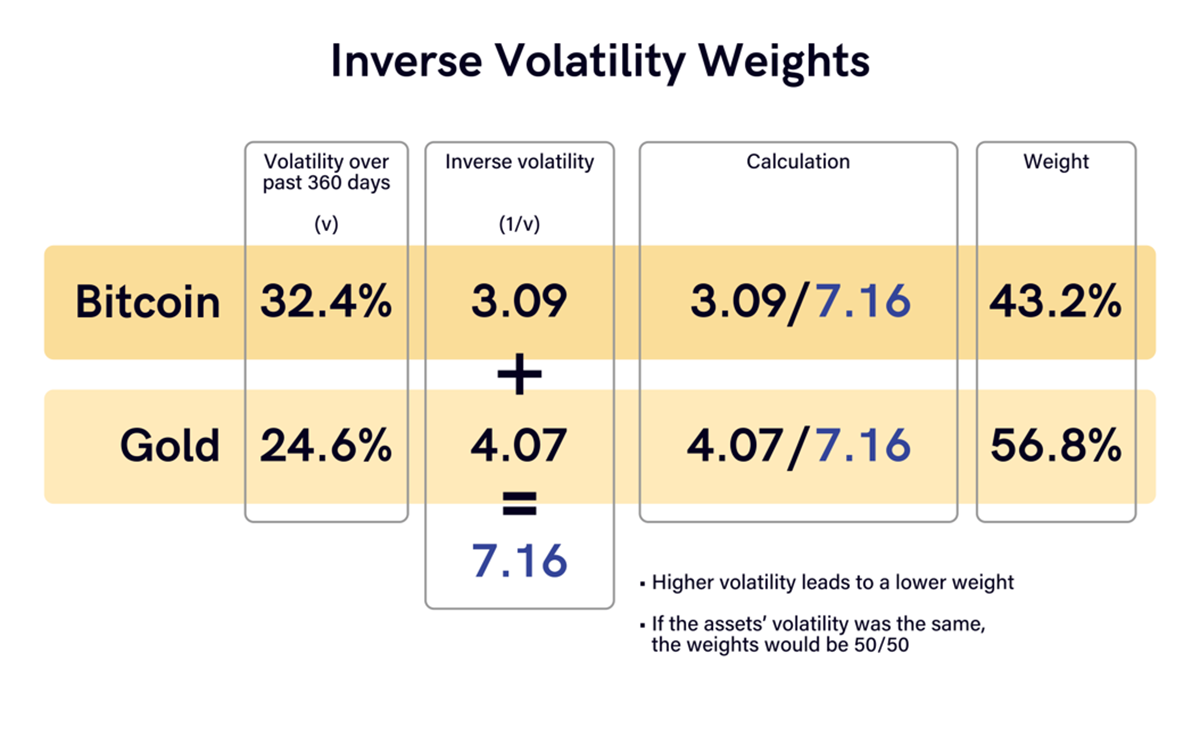
Rather than having the same amount of value invested in each asset, the BOLD strategy aims to hold equal amounts of “risk” in each asset and is hence “risk-weighted”. The volatility of Bitcoin and Gold over the past 360 days was observed to be 32.4% and 24.6%, respectively. The increase in Gold’s volatility has been significant, and it has not been in this territory since the financial crisis in 2008.
If Bitcoin and Gold had the same volatility, the weights would be 50/50. Indeed, if Gold’s volatility were ever higher than Bitcoin’s, then Bitcoin would have a larger allocation. The volatility measures have resulted in new target weights of 43.2% for Bitcoin and 56.8% for Gold, using this formula.
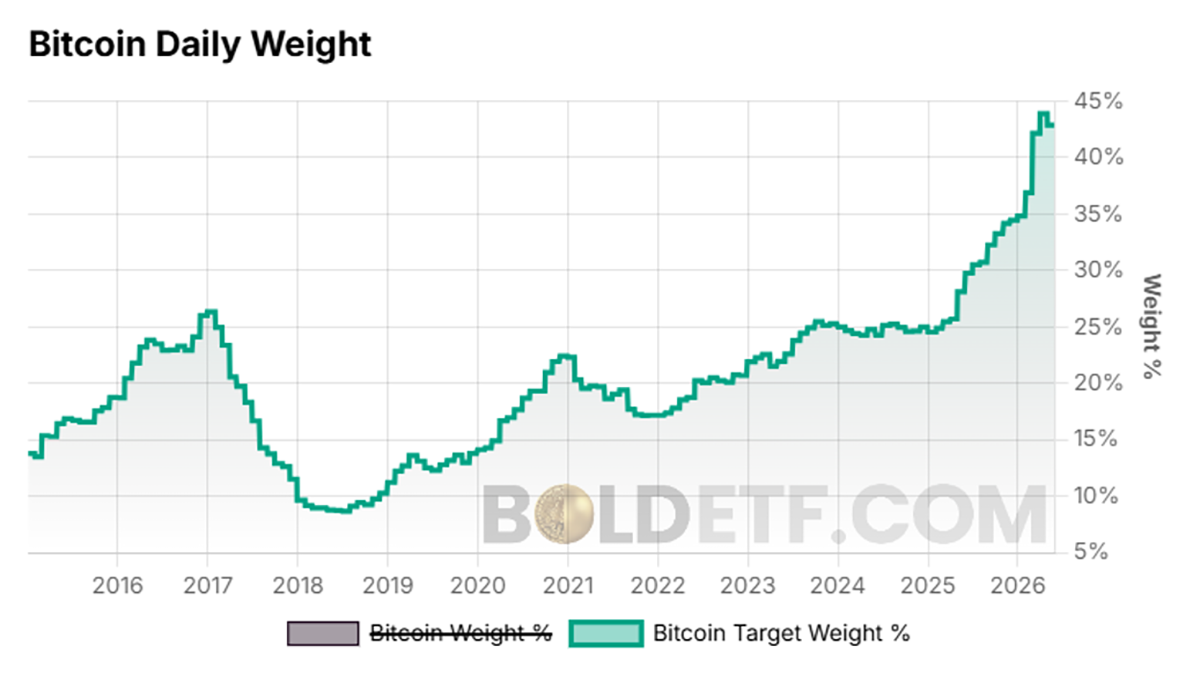
Asset allocation is an important feature. Over the long term, the aim is to equalise the risk in each asset. In 2017 and 2018, BOLD had relatively low exposure to Bitcoin due to its high volatility at the time, which held it in good stead in the 2018 bear market. At other times, it has generally been in the 20% to 25% range, with the remaining balance in Gold.
Bitcoin: Daily Target Weight
The monthly rebalancing transactions, which repeatedly top up the weaker asset, have added significant value compared to a buy-and-hold strategy. Using the weight in Bitcoin, you can see how the monthly rebalancing brings the asset allocation back into line. Repeatedly doing this adds value while maintaining a constant level of risk.
Bitcoin: Daily Weight and Target Weight
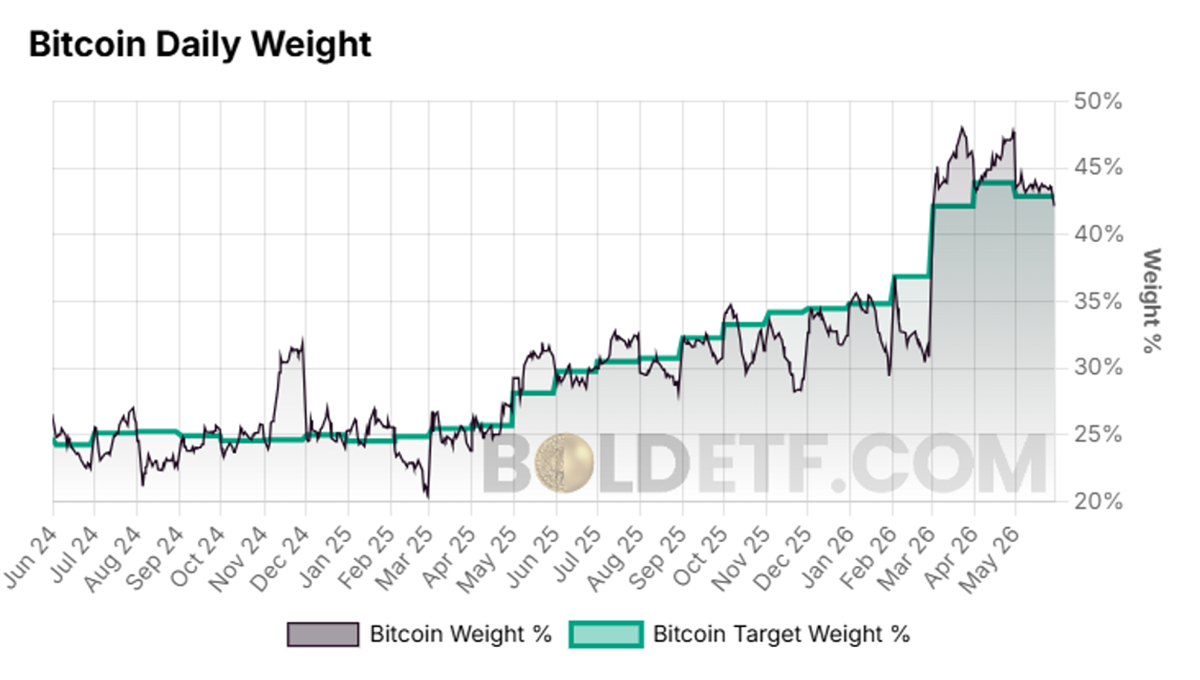
The daily weights deviate much more than the monthly target weights due to the intra-month price movements between Bitcoin and Gold. For example, Bitcoin has beaten Gold over the last two months, and so Bitcoin’s exposure has been reduced back down to the target weight during the monthly rebalancing. This ensures the strategy maintains the optimised weights for Bitcoin and Gold.
This process keeps the amount of risk, as defined by volatility, roughly the same in each asset, meaning BOLD maintains its risk level over time, without being overly exposed to either Bitcoin or Gold. This explains why BOLD’s volatility is so low, a key advantage over holding Bitcoin and Gold separately.
BOLD’s Volatility Is Comparable with Gold
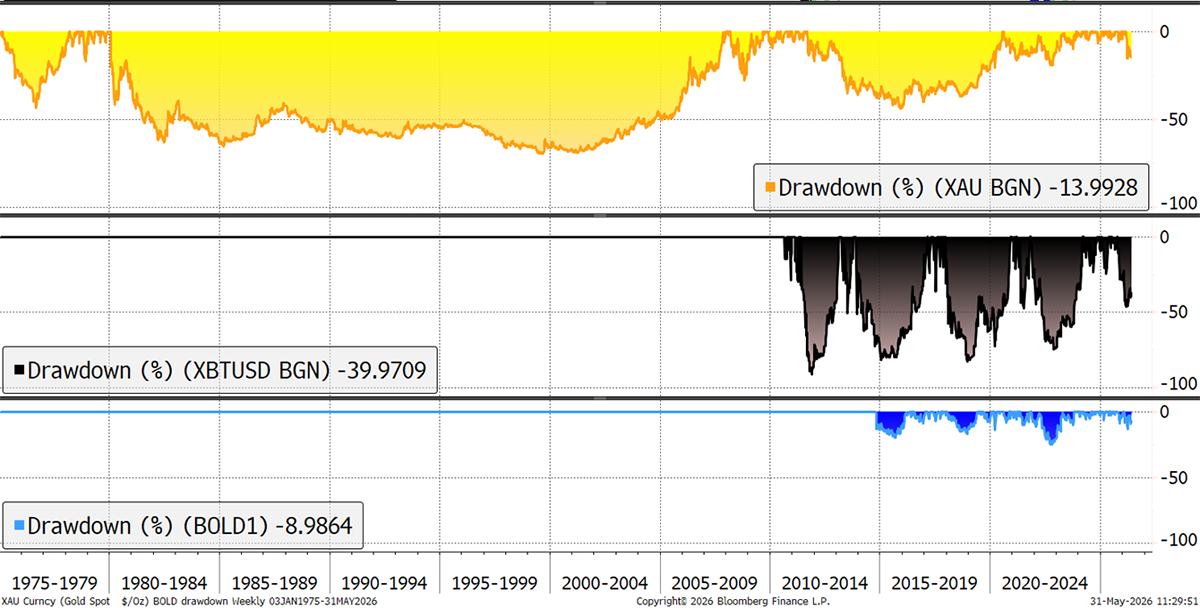
Risk is not just a matter of volatility but of maximum drawdowns. Historically, Bitcoin drawdowns have been severe and Gold drawdowns, in the minds of many, less so. But in the 1980s and 1990s, Gold had prolonged drawdowns, and that could happen again one day. By diversifying between the assets, the largest drawdowns have been dampened. BOLD drawdowns have been much lower than either Bitcoin or Gold alone.
Max Drawdown: Gold, Bitcoin, and BOLD
This is important as BOLD compounds returns by regularly locking in profits. Family offices, with long-term investment horizons, understand this principle. Many opt for conservative, compounding, absolute return strategies over beating the index, as if a portfolio halves, it needs to double to get back to square one. By avoiding large drawdowns, compounding can take place at a higher rate over the long term.
Volatility Harvesting
Not only does risk-weighting reduce overall volatility, but the rebalancing transactions add value through a process known as “volatility harvesting”. As the linked paper by Bouchey, Nemtchinov, Paulsen, and Stein states, “volatility is a drag on the compounding effect.”
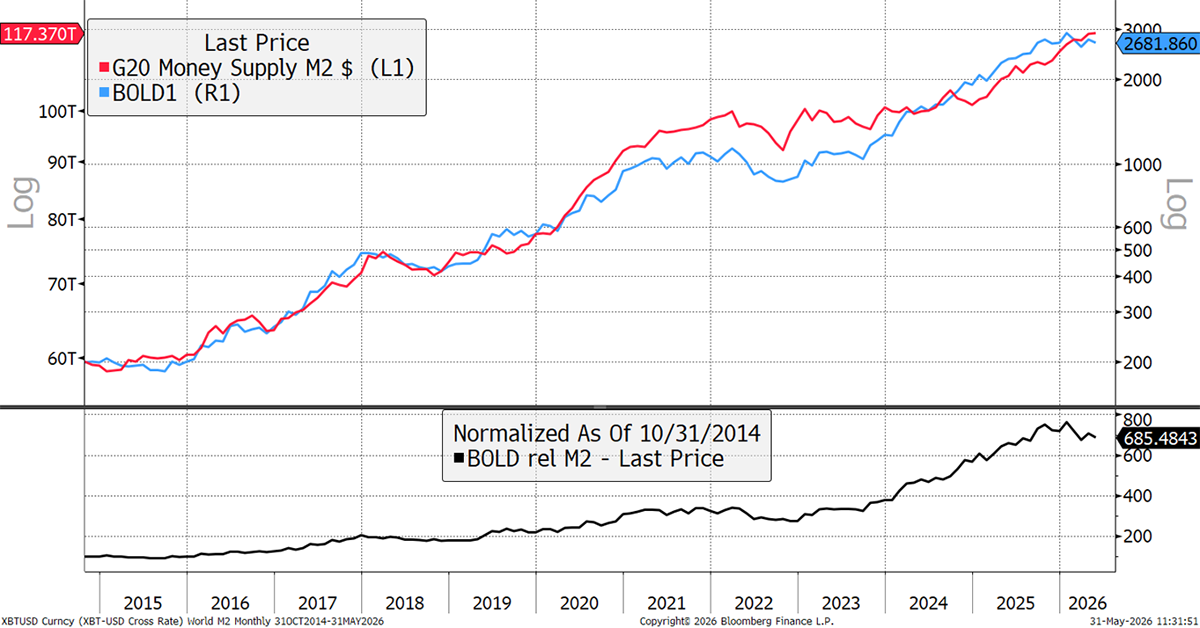
While Bitcoin and Gold travel along different paths, it is notable how BOLD has historically been highly correlated with the global M2 money supply, much more so than Bitcoin or Gold in isolation. BOLD has also been an efficient way to express this macroeconomic view. M2 has grown from $60 trillion in 2015 to $117 trillion today. In that time, BOLD has beaten M2 by 6.8x in a calm manner.
BOLD vs the Global Money Supply
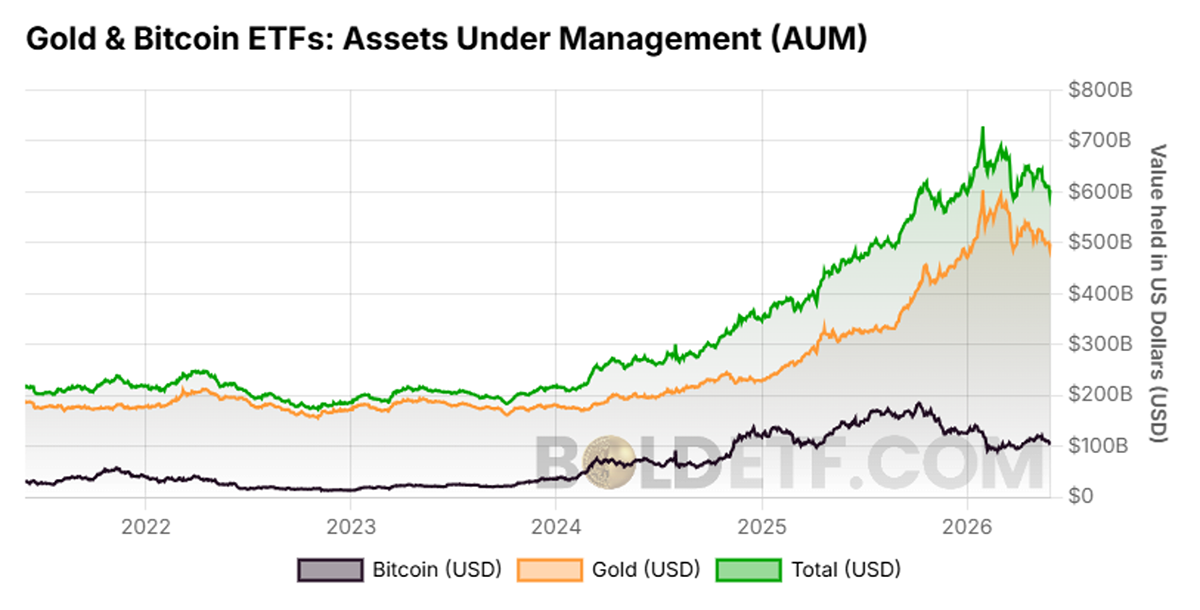
Bitcoin and Gold ETF Flows
Over the past 90 days, Gold ETFs have seen outflows, whereas Bitcoin ETFs have stabilised. The correlation between the asset flows has generally been negative.
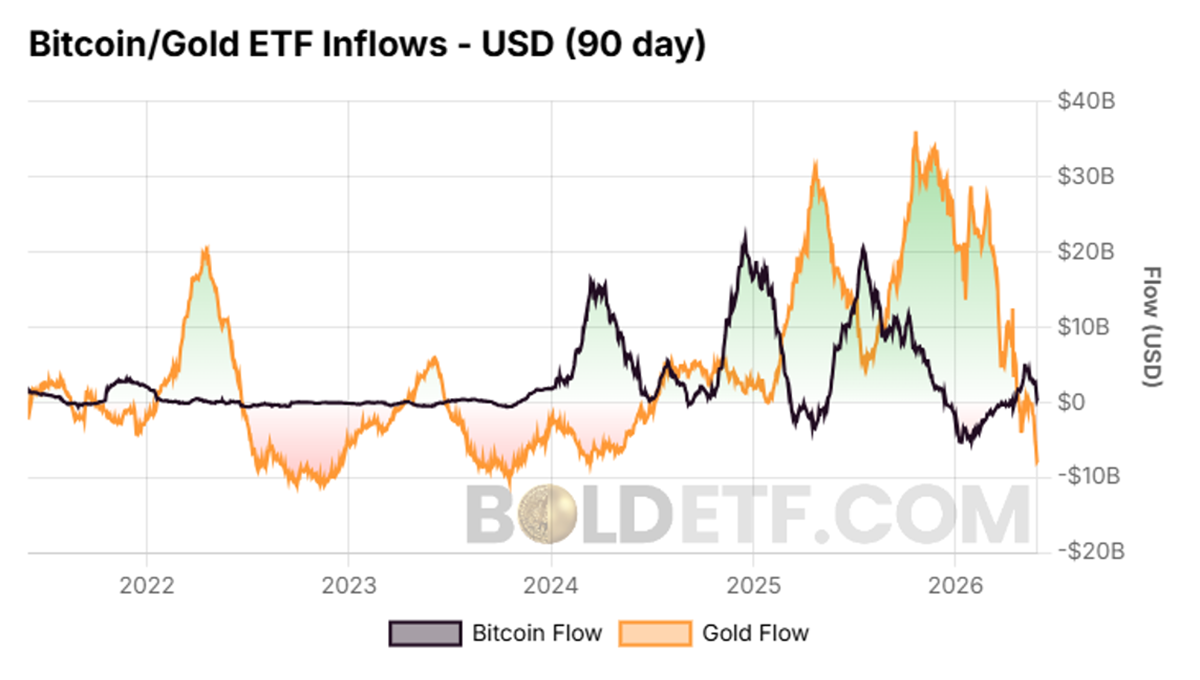
The total value of Bitcoin and Gold ETFs is $600 billion.
BOLD ETP
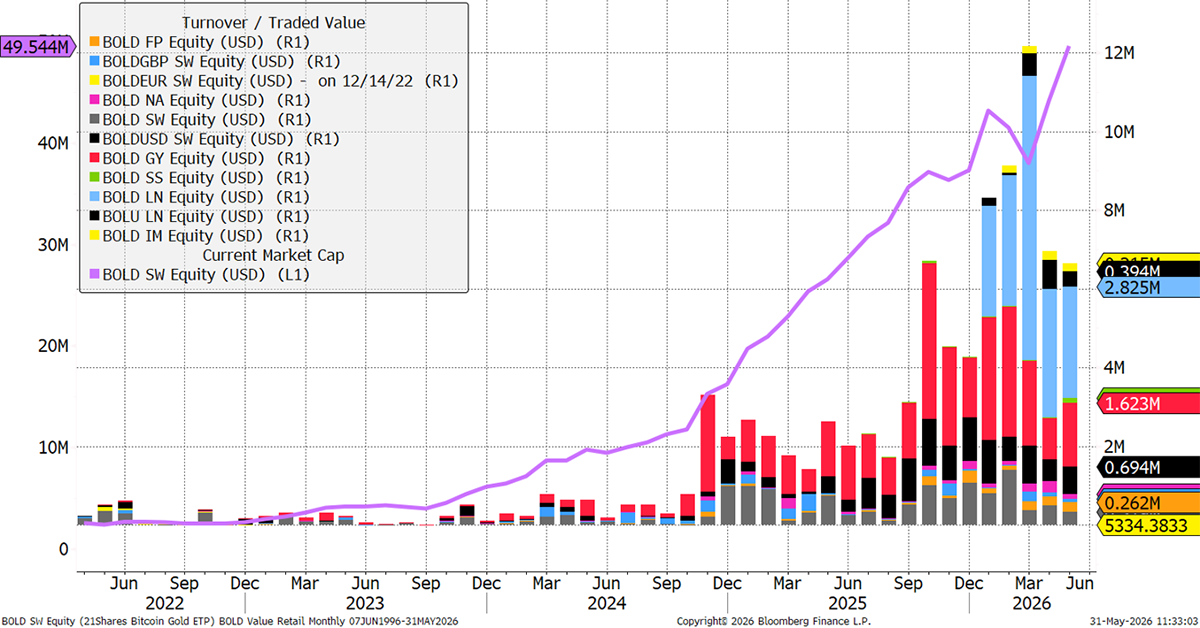
The 21Shares Bitcoin Gold ETP (BOLD) tracks the BOLD Index. The fund now holds $49.5 million in Bitcoin and Gold, held in safe custody with Copper for Bitcoin and JP Morgan for Gold. April saw lower trading volumes than March, due to market uncertainty, but it picked up again towards the end of the month. Assets continue to rise as investors embrace the BOLD strategy. The GBP volume is shown in blue.
21Shares ByteTree BOLD ETP Price and Volume by Share Class in US$
BOLD ETP Listings
The 21Shares Bitcoin Gold ETP (BOLD) is listed in Switzerland, Germany, the Netherlands, France, Sweden, Italy, and the United Kingdom, actively trading in CHF, EUR, USD, SEK, and GBP. The ticker is BOLD.
The 21Shares Bitcoin Gold ETP trades in the primary market, meaning that purchases and sales result in direct buy or sell transactions of Bitcoin and Gold from the market. For further information, please visit BOLDETF.com, which offers extensive data and charts to help investors better understand the benefits of the strategy.
Recent Videos
Please watch our recent videos with:
- Charlie Erith, Wiston Capital (March 2026)
- 21Shares with Max Michielsen and Darius Moukhtarzadeh (March 2026)
- Chris Wood, Chief Equity Strategist at Jefferies (February 2026)
- John Reade, Senior Market Strategist at the World Gold Council (January 2026)
- Izabella Kaminska, Founder of The Blind Spot (January 2026)
- Adrian Fritz, Chief Investment Strategist at 21Shares (January 2026)
Product Details
| Issuer | 21Shares AG, Switzerland |
| Launch Date | 27 April 2022 |
| Fee | 0.65% Per Annum |
| Custody | Copper Technologies (Swiss) for Bitcoin, JP Morgan for Gold |
| Investment Objective | Risk-weighted Bitcoin and Gold Exposure |
| Benchmark | Kaiko ByteTree BOLD Index |
| Rebalancing Frequency | Monthly |
| ISIN | CH1146882308 |
| SEDOL | BK81V89 CH |
| WKN | A3GYXW |
| Ticker | BOLD SW (Switzerland), BOLD GY (Germany), BOLD FP (France), BOLD NA (the Netherlands), BOLD SS (Sweden), BOLD LN (United Kingdom), BOLD IT (Italy) |
| Listings | Switzerland, Germany, France, the Netherlands, Sweden, United Kingdom, Italy |
| Currency | USD, EUR, CHF, GBP, SEK |
Contact
For information on investing in BOLD, contact bold@bytetree.com.
If your investment firm or media outlet would like a private briefing on BOLD, we will be happy to oblige. If a physical meeting is not possible, we can arrange a Zoom call.
