Bitcoin Macro and the Money Map


ByteFolio Issue 227;
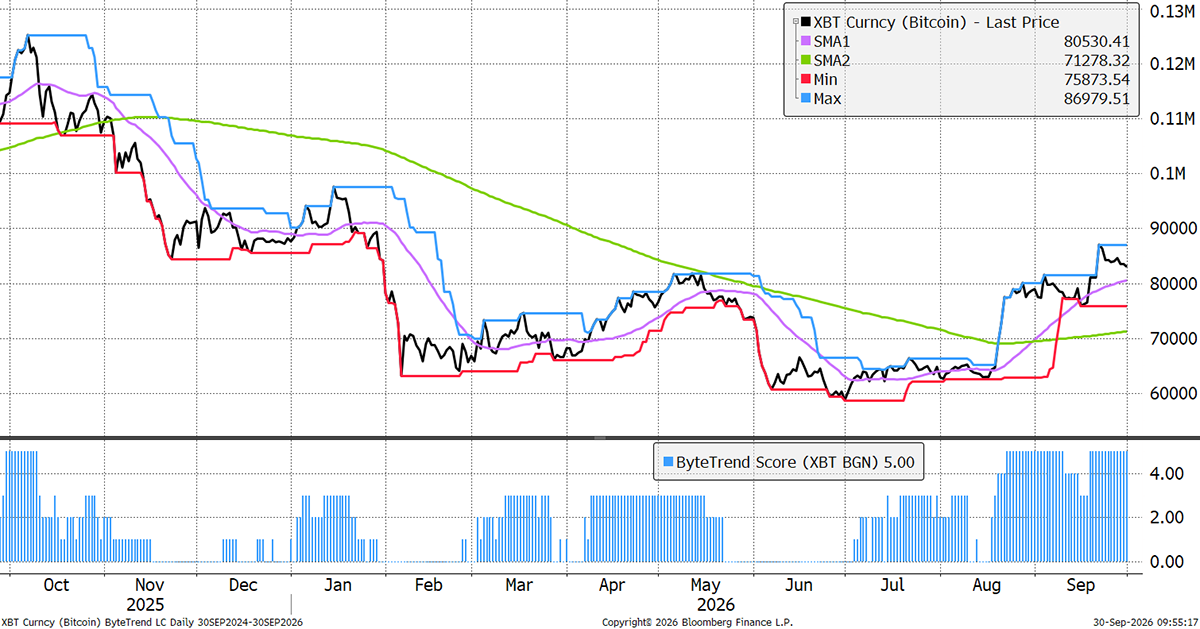
Bitcoin’s ByteTrend Score is a firm 5 (strong bullish) on the daily chart.
Bitcoin Daily
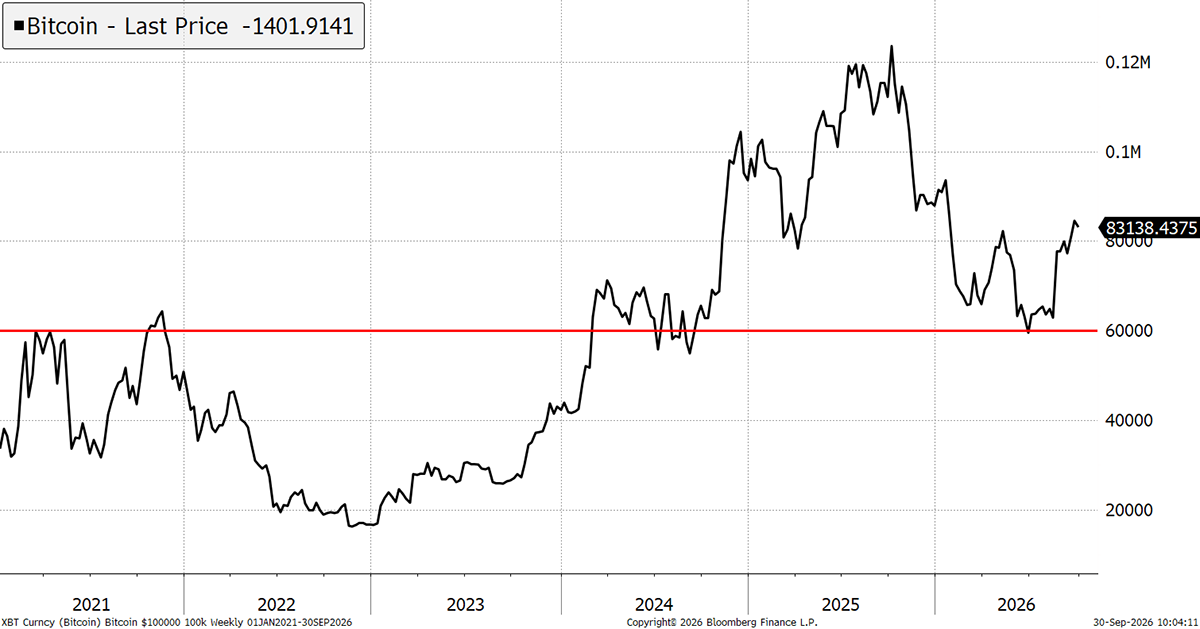
In the last cycle that peaked twice in 2021, the $60k level provided lasting resistance. In the latest cycle, that same level provided support. It was also the price consolidation zone in 2024 after the US ETFs were launched, before a 2x move to $120k. It should provide confidence that a breach below $60k is unlikely in the future.
Bitcoin Levels
More impressive perhaps is that Bitcoin is performing during a potential bond crisis. Many stocks are struggling with bond yields at a 20-year high. Crypto is dancing.
US 10-Year Bond Yield
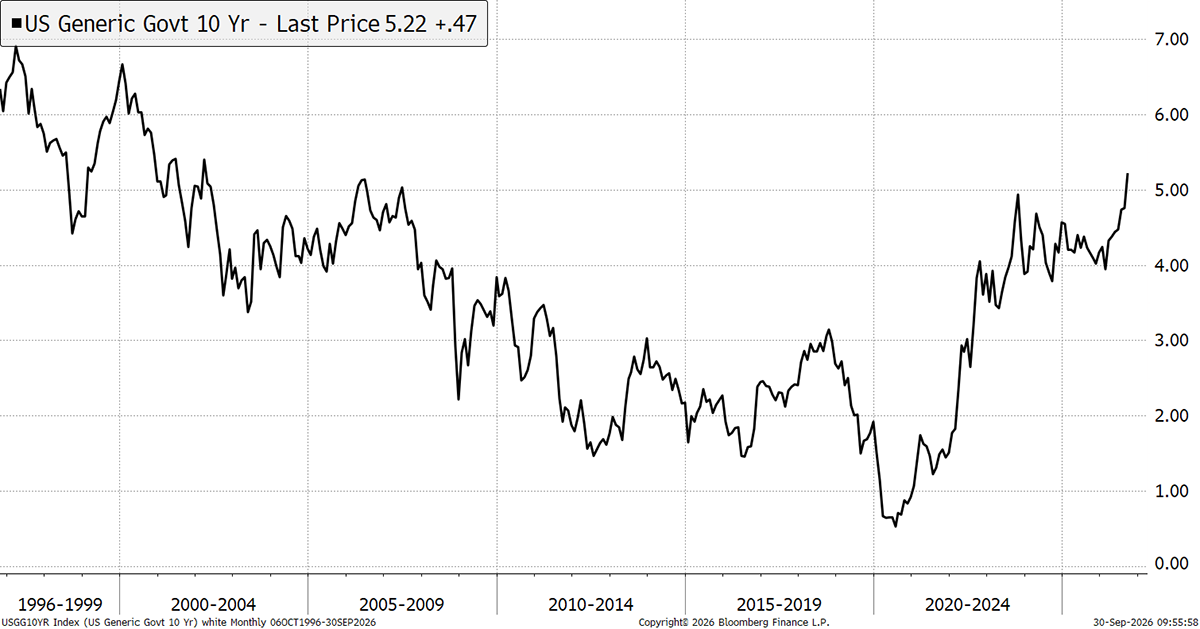
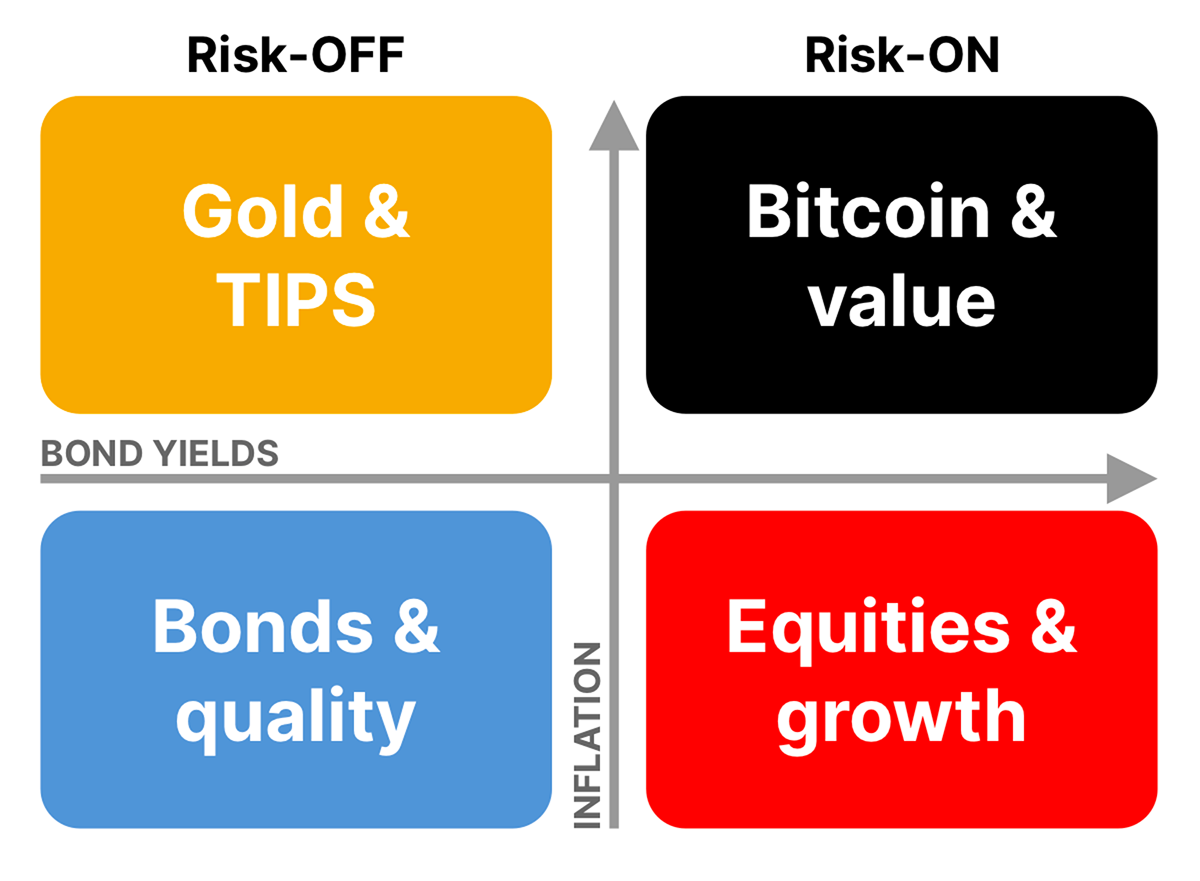
The Money Map has long stated that Bitcoin likes rates and inflation to be rising, because that reflects a strong economy awash with cash. Commodities and banks also like this environment, at least up to a point.
The Money Map
I show Bitcoin (black) plotted against inflation plus the 10-year bond yield (red). Many things impact the Bitcoin price, but this seems to have some influence. Bitcoin fell in 2022, which was a year of scandals. Other than that, the linkage is good.
Bitcoin, Inflation, and Rates
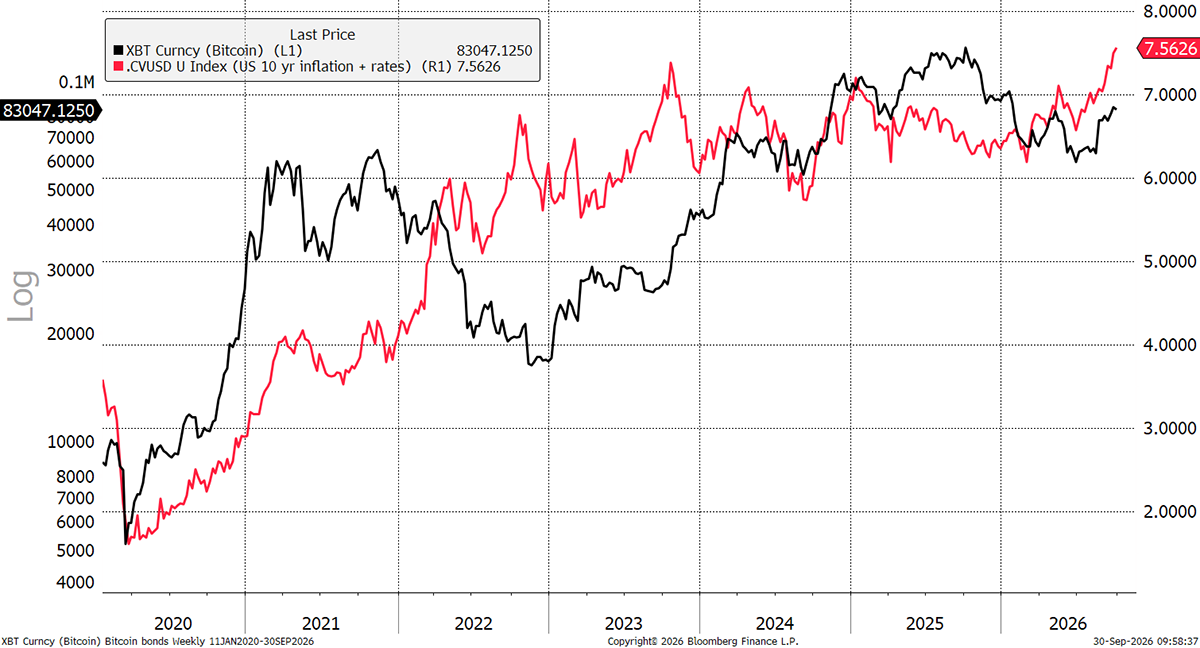
That’s just as well, because bond yields are rising, which is pushing growth assets at a time when other assets are struggling. The one thing we can be fairly sure of is that when the money is running hot, Bitcoin always seems to win.