
What Happened in 1974?

On 6 October 1973, Egypt and Syria launched a surprise attack on the Jewish holy day of Yom Kippur. Israel’s counter-offensive saw them push the invading armies all the way back to, and even beyond, the original borders. The US and Soviet Union were dragged into supporting each side, before the UN brokered a (second) ceasefire on 25 October 1973. Most of the fighting occurred in the Sinai Peninsula and Golan Heights, territories occupied by Israel in 1967.
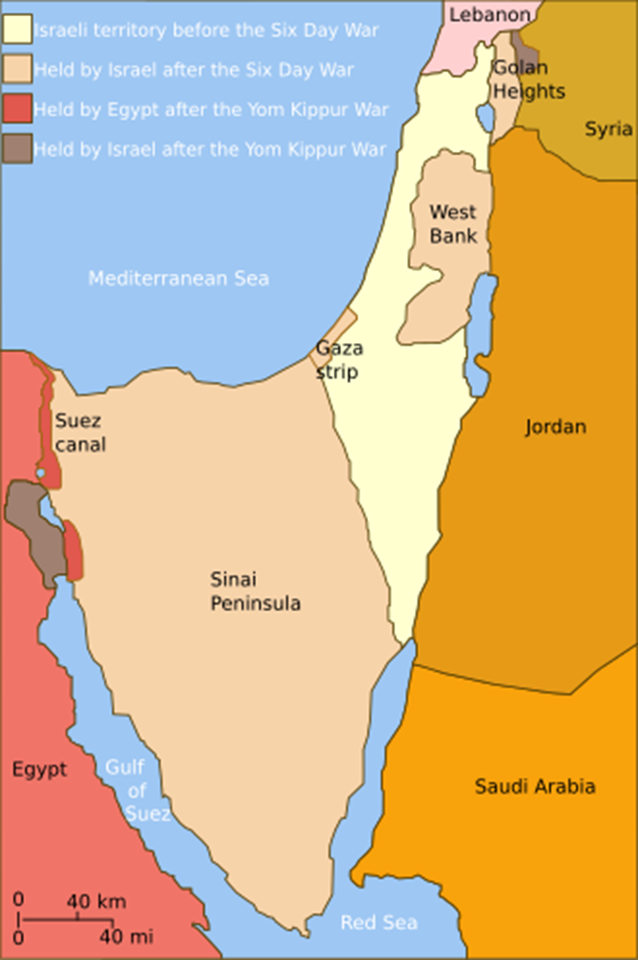
The energy crisis began when Arab oil-producing nations imposed an embargo on countries supporting Israel during this war. OPEC had been formed back in 1960 and enabled them to act with a single voice. The immediate cause was Nixon’s declaration of $2.2bn of support for Israel.
At this time, the US was a significant energy importer, reliant on Arab nations for most of its fossil fuels. Faisal bin Abdulaziz Al Saud, king of Saudi Arabia from 1964 to 1975, had been on US TV in the weeks leading up to the Yom Kippur war, saying, “Look, you have to choose, you can support Israel or have cheap oil, but you can’t have both.”
Before the embargo, a barrel of oil traded for around $3.56, rising to $10.11 by January 1974. This was achieved through repeated 5% production cuts over several months. The embargo was lifted in March 1974, but the “oil weapon” had been unleashed, and the world would never be the same. The oil price finally peaked at $39.50 in July 1980, in a second shock. Between 1947 and 1980, the real oil price had risen sixfold.
The Oil Price in Real Terms – Rebased to $100
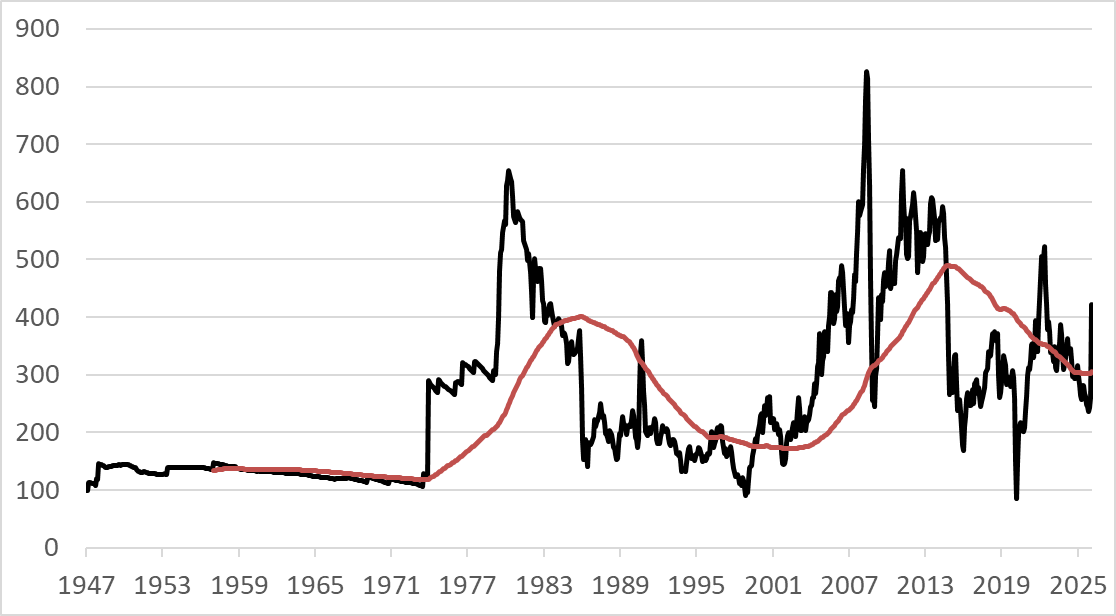
Looking at the real oil price against its 10-year moving average gives you a sense of the shock to the economic system. When the price moves to 150% above what the system normally functions at, the economy crashes. The shocks came in 1973/4, 1980, and, remarkably, the shock of 2008 was even worse. Times when the oil price was unusually low have led to lower inflation and higher growth, which partly explains the super-normal equity returns of the 1980s and 1990s. The teens were strong too, at least in the USA.
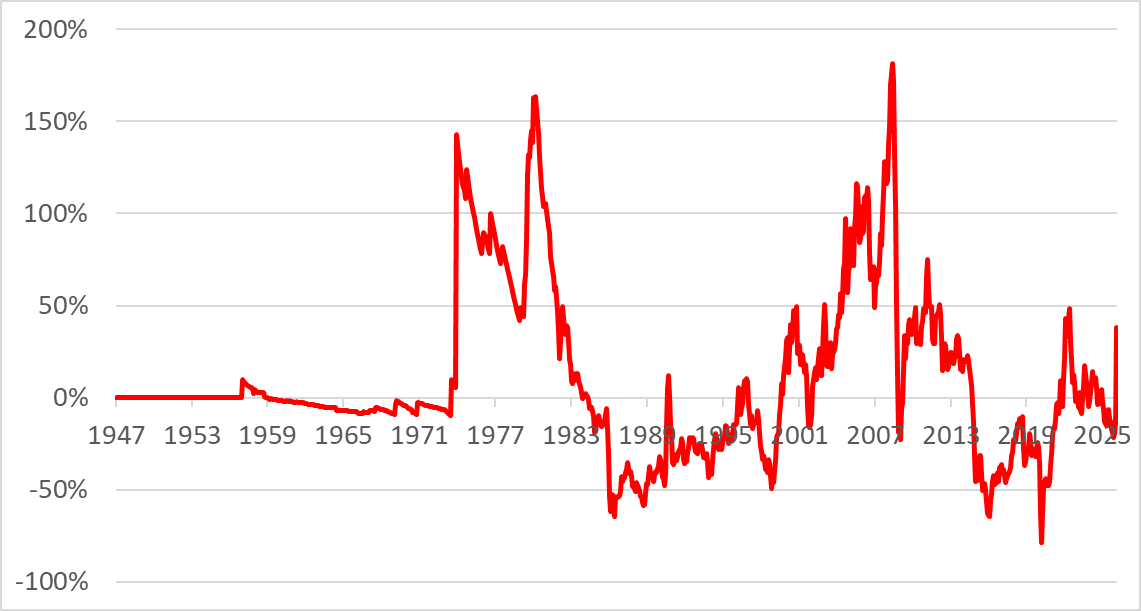
The Real Oil Price as a Percentage of the 10-year Moving Average
I was surprised to learn that in the developed world, the energy consumption per capita is roughly the same today as it was in 1970. Naturally, there will have been efficiencies over the decades, so we get more from it, but the big change has been the growing demand from the emerging world, where we can reasonably expect their consumption to catch up.
The current deviation from trend is 38%, which is a drag but not enough to be called an oil shock. A move to $150 today would see that rise to 100%, and $200 would be a comparable shock with 1974 and 1980, while 2008 would be comparable with 150%. We should assume that $100 oil implies a slowdown, $150 a recession, and $200 a depression.
The pseudonymous author, Adam Smith, in Paper Money, describes it as the greatest transfer of wealth in history. Hundreds of billions of dollars were sitting in developed nations’ bank accounts one day, and the next day, they were flowing into Gulf nations. It is difficult to overstate the extent to which oil-producing nations had only small pockets of development surrounded by undeveloped populations at that point. Suddenly, hundreds of billions of dollars were pouring in and generally being spent buying advanced military capabilities, as well as hotels, racehorses, and luxury yachts.
On the Yom Kippur invasion, President Nixon received two letters. One was from Israel’s Prime Minister saying, “Please send aid”, and the other from all the oil company chiefs saying, “Whatever you do, don’t send Israel aid”. Nixon was in the midst of the Watergate Scandal, leaving Henry Kissinger to make the big decisions. Edward Heath was the UK PM who had just joined the European Common Market, and was trying to get to grips with Post-Empire Britain.
The US anticipated a two-million-barrel-per-day shortage, the most acute energy shortage since WW2, leading to a 10% - 17% deficit versus demand. The short-term impact of a higher price was to choke off consumption, causing a recession. There were other complications, such as the war in Vietnam, and the gold standard had ended in 1971, which also contributed to higher inflation.
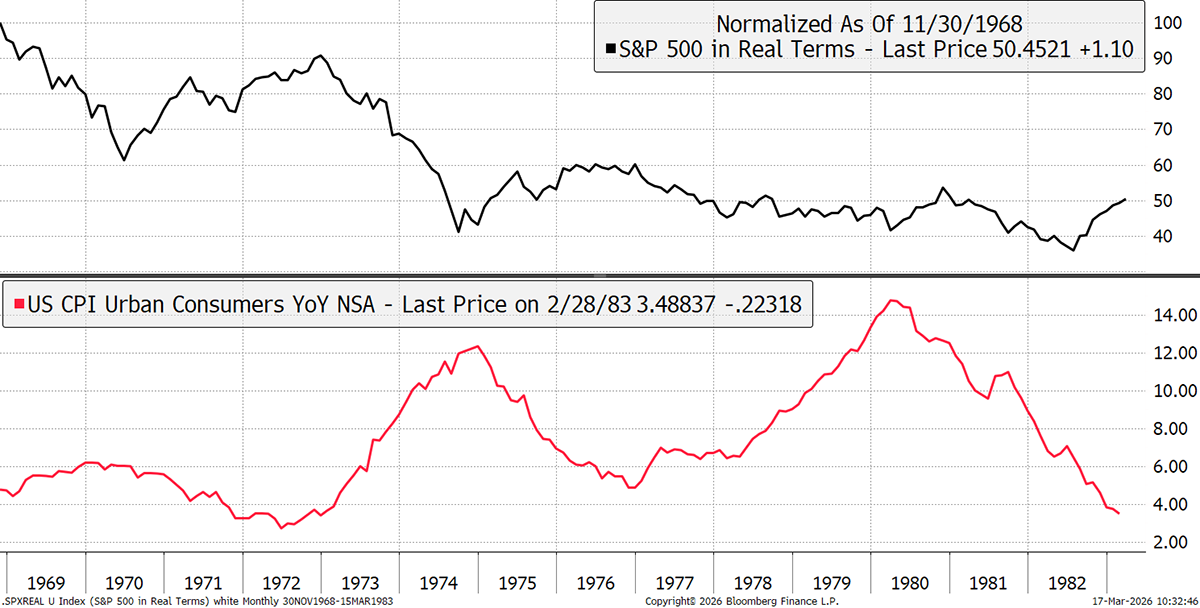
The impact on the stockmarket was excruciating. The market had peaked, in real terms, in November 1968. As inflation cooled coming into 1972, the market rallied. But as mentioned, the US came off the gold standard in 1971, so inflation was already rising. The oil embargo poured fuel onto the fire, and inflation rose to 12% by late 1974. The S&P 500, in real terms, fell by 59% from the 1968 peak into 1974, and didn’t make a final low until 1982, which was 64% lower than the peak 13 years earlier. Dividends would have offset some of this, but still, it was a terrible time for investors. Oh, and equities beat bonds.
US Equities Real Returns and Inflation in the 1970s
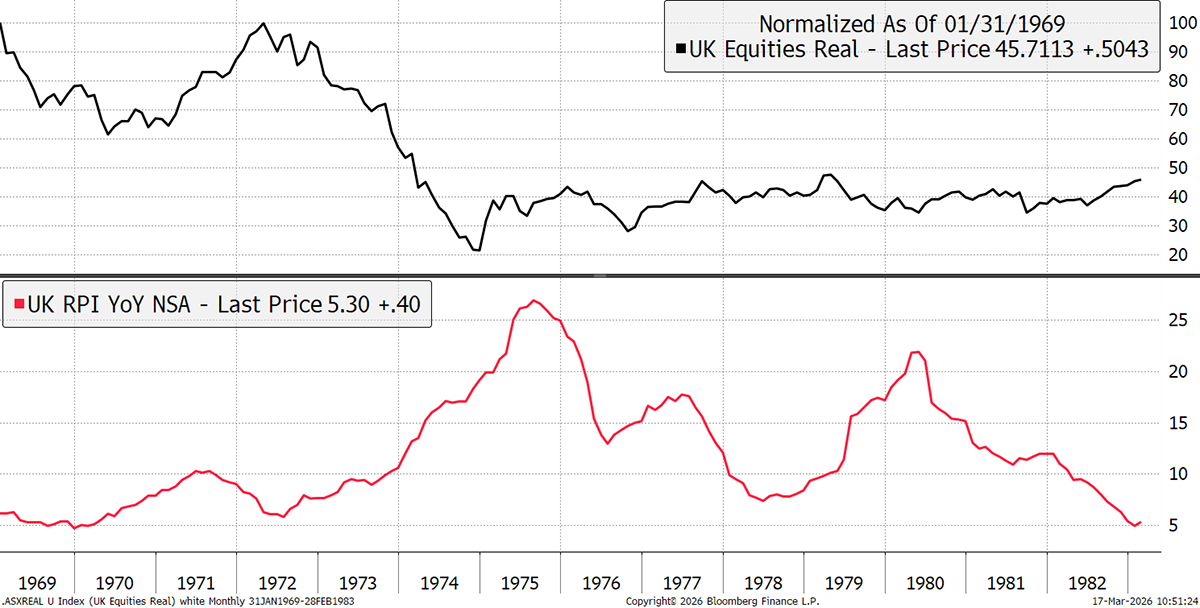
If you think that was bad, let’s take a look at the UK. The FTSE All-Share peaked in 1969, only to retest that high in 1972. Inflation rose to 27% by 1975, and the UK stockmarket fell by 80% in real terms. Now that’s a bear market for the history books.
UK Equities Real Returns and Inflation in the 1970s
1982 followed the 1970s oil shock, which brought the bear market to an end. 1982 was widely regarded as the cheapest time to buy equities in modern history, and two fabulous decades followed. Using Robert Shiller’s cyclically adjusted price to earnings ratio (CAPE), equities were only cheaper in 1921 and 1932, after the Wall Street Crash. The 1982 low followed the 1966 high, a period of high equity valuations.
Shiller CAPE Ratio
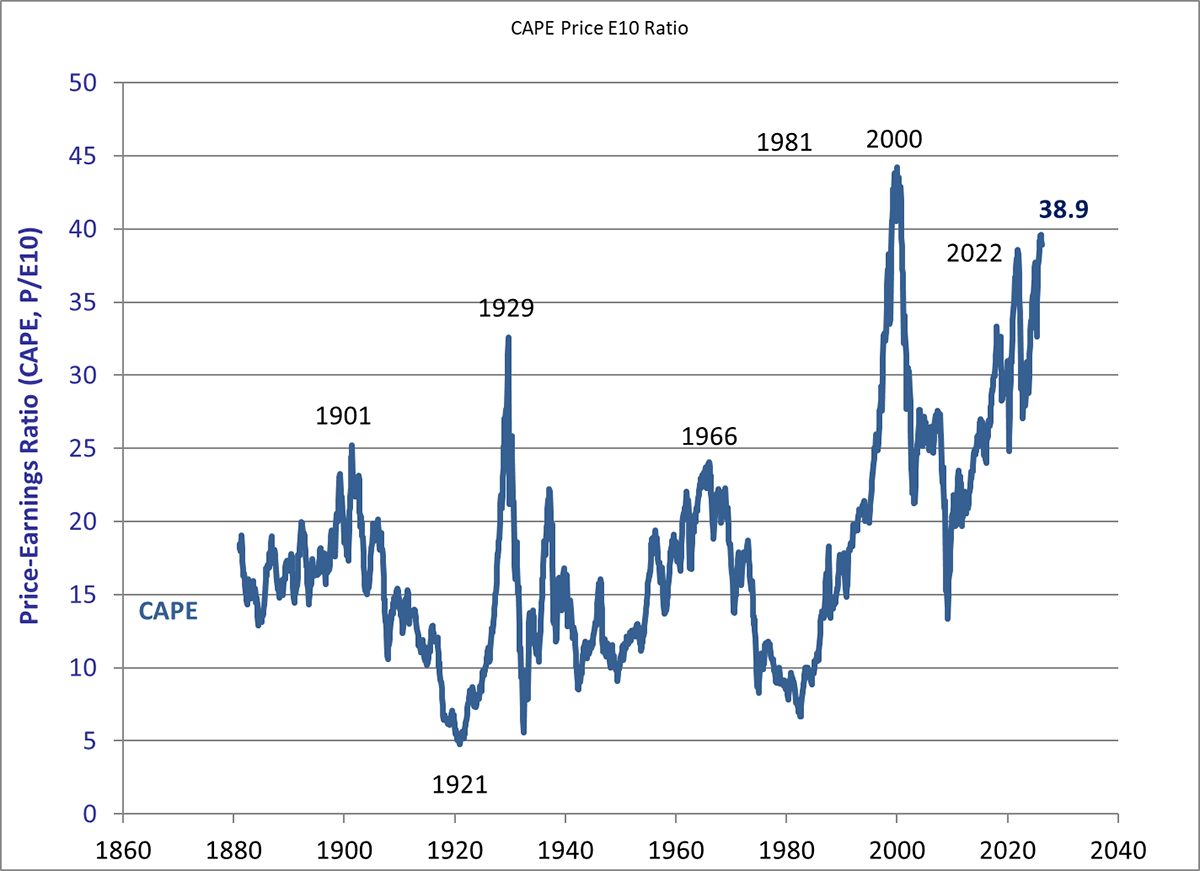
Today is another time of high valuation, and that increases the risk too. If equities are cheap, they can withstand much more bad news and economic shocks than when they are priced for perfection. To defend today’s high CAPE ratio, some would say that companies have much higher margins these days, not just from technology, but from the general monopolistic behaviour of many blue-chip companies. But history tells us that when valuations are high, we should be cautious.
The portfolio you wanted to own in the early 1970s was very different from the one you wanted to own in 1982. The 1970s portfolio would be dominated by value - hard assets and commodities. These held up while the growth stocks would have been kiboshed. Then, in 1982, as inflation, rates, and oil prices started to fall, the right portfolio would have been the exact opposite: filled to the brim with growth stocks and even bonds.
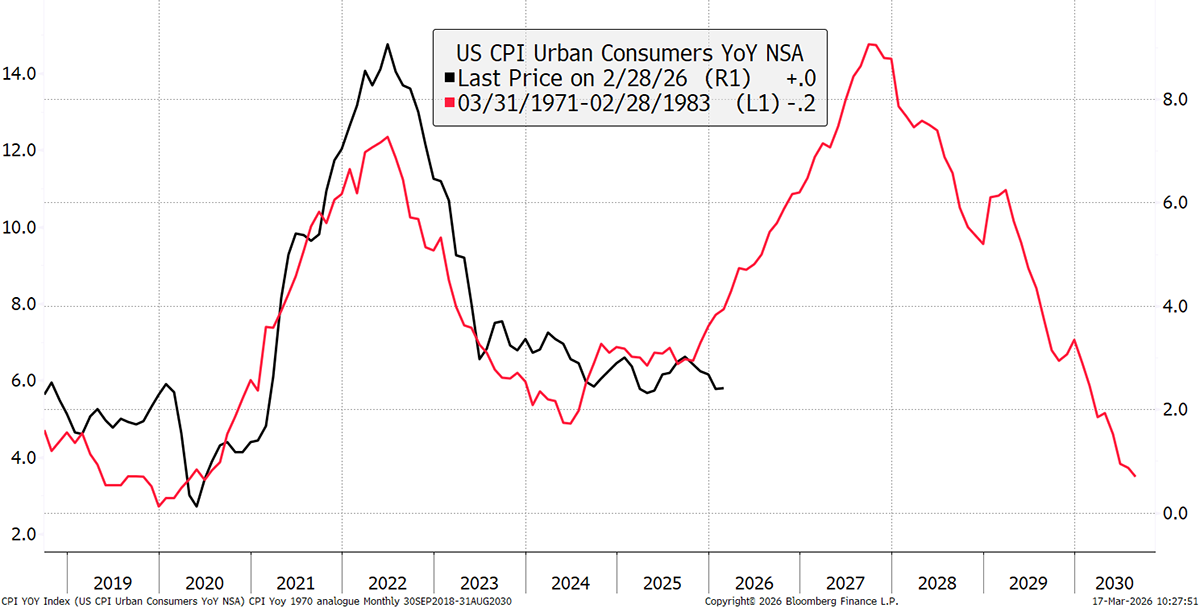
This inflation chart has been doing the rounds, showing US CPI in the 1970s, with the past six years overlaid. We shouldn’t take past analogies too seriously, but our worst nightmare has happened before and could happen again.
US Inflation in the 1970s and Today
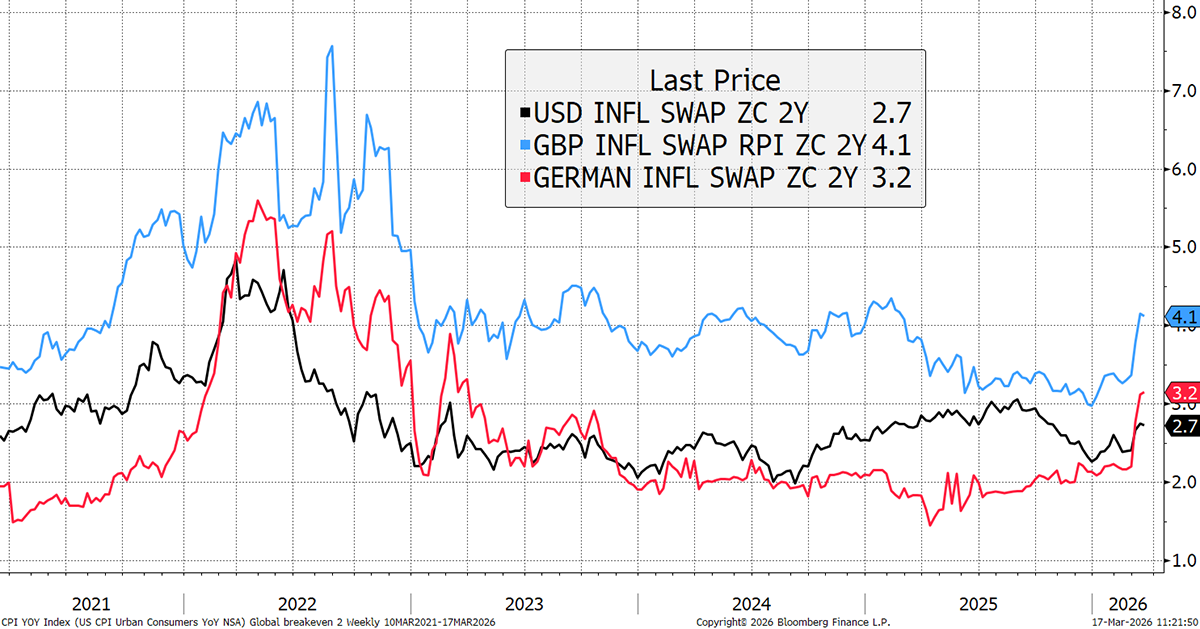
It’s still early days, but two-year expected inflation is rising. This is not yet significant, but if the oil price keeps rising, it soon will be.
Two-Year Inflation Expectations
What are the chances of that happening? On the one hand, Iran’s military has been badly damaged, and their ability to fight back is much reduced for fighting a conventional war. But they have adopted guerrilla tactics, focusing on neighbouring oil and water infrastructure, and closing the Straits of Hormuz. This is highly disruptive and harder to stop. Even if the foreign fleets arrive, it will still be costly and disruptive.
The chance of oil shooting much higher seems lower than two weeks ago, but cannot be ignored. On the other hand, the dream of oil returning below $70 anytime soon is close to zero. Life gets tougher regardless.
I thought it would be a good time to check in on the Middle Eastern stockmarkets and see what the financial impact has been in the region. The Israeli market is up 19%. Saudi Arabia, Jordan and Egypt are flat, and Dubai, Lebanon, and Bahrain are down 10%.
Middle Eastern Markets in 2026
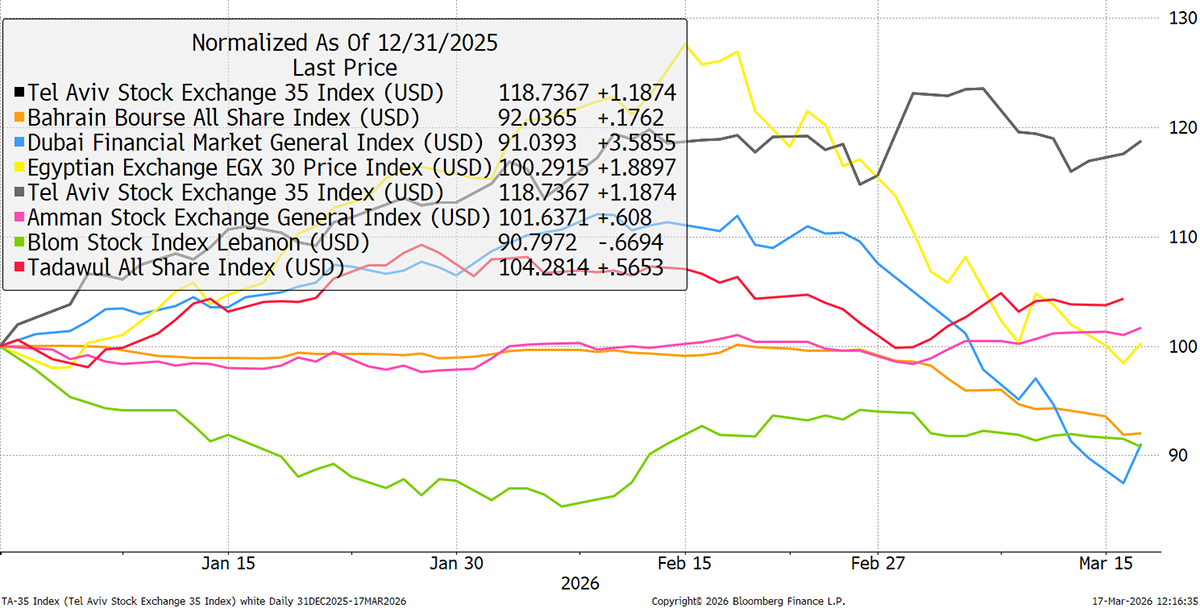
The Israeli market is full of defence, energy, and tech companies. It’s an impressive list, but sadly, the only Israel ETF was shot down by BlackRock in 2021. Egypt has fallen from a currency devaluation that started in mid-February. Dubai has fallen, but not by as much as you might think. I would think that the negatives of the war are somewhat offset by the higher oil price that benefits the region.
General - Your capital is at risk when you invest, never risk more than you can afford to lose. Past performance and forecasts are not reliable indicators of future results. Bid/offer spreads, commissions, fees and other charges can reduce returns from investments. There is no guarantee dividends will be paid. Overseas shares - Some recommendations may be denominated in a currency other than sterling. The return from these may increase or decrease as a result of currency fluctuations. Any dividends will be taxed at source in the country of issue.
Funds - Fund performance relies on the performance of the underlying investments, and there is counterparty default risk which could result in a loss not represented by the underlying investment. Exchange Traded Funds (ETFs) with derivative exposure (leveraged or inverted ETFs) are highly speculative and are not suitable for risk-averse investors.
Bonds - Investing in bonds carries interest rate risk. A bondholder has committed to receiving a fixed rate of return for a fixed period. If the market interest rate rises from the date of the bond's purchase, the bond's price will fall. There is also the risk that the bond issuer could default on their obligations to pay interest as scheduled, or to repay capital at the maturity of the bond.
Taxation - Profits from investments, and any profits from converting cryptocurrency back into fiat currency is subject to capital gains tax. Tax treatment depends on individual circumstances and may be subject to change.
Investment Director: Charlie Morris. Editors or contributors may have an interest in recommendations. Information and opinions expressed do not necessarily reflect the views of other editors/contributors of ByteTree Group Ltd. ByteTree Asset Management (FRN 933150) is an Appointed Representative of Strata Global Ltd (FRN 563834), which is regulated by the Financial Conduct Authority.
© 2026 ByteTree Group Ltd