

Trade in Whisky
Things are not what they seem. In recent months, a trillion dollars of stimulus from Europe, Japan, and China has more than neutralised the Fed’s tightening. Strange though it may seem, this appears to have been enough for markets to shrug off the recent banking crisis. To add fuel to the fire, OPEC has slashed the oil supply by 500 thousand barrels per day. If nothing else, it will confuse the deflationists.
These are strange times, and evidence grows, if it wasn’t already obvious, that fundamentals are no longer driving markets. We are living in a vast tsunami of money, which keeps the system afloat. With the printing presses carrying on at full speed, I will be further increasing exposure to precious metals, where all paths seem to lead.
A few months ago, I recognised it was time for the Multi-Asset Investor to embrace international stocks, principally for a larger pool of liquid assets. (Just because I haven’t yet recommended one doesn’t mean I am not looking). I have been crunching the numbers and have lots of ideas for the future, but I just don’t trust this market. The cheap stocks seem to stay cheap, while the popular stocks keep on being inflated back up to dangerous levels.
The NASDAQ is up 12.5% this year, while the old school DOW Jones is down 2%. It’s not fundamentals but money flows that got us here. See how the NASDAQ has simply followed the long bond. Bonds and tech have been joined at the hip.
Spot the Difference
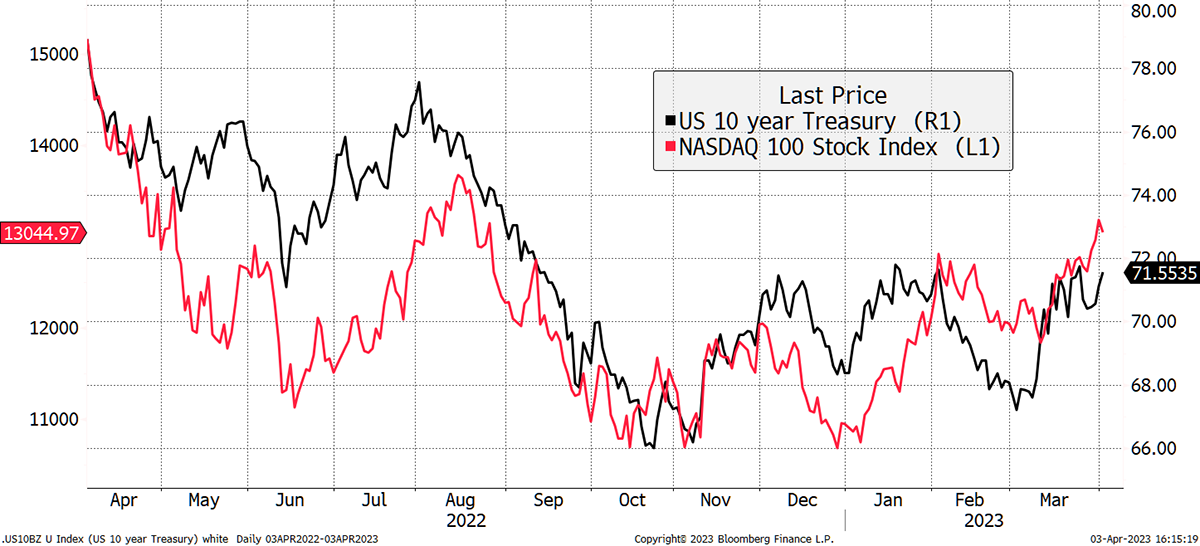
Source: Bloomberg
The world’s largest 1,100 companies (in my model), worth $51 trillion, have appreciated by $5 trillion this year. $3.2 trillion of the gains have come from just ten companies, all of which are senior members of the NASDAQ. It is a remarkable concentration and not what you could describe as normal market behaviour.
Wasn’t the Fed Supposed to Be Tightening?
Matt King, Citigroup’s multi-asset strategist, wrote a note that could have been written by a conspiracy theorist.
As usual when price action diverges from policymaker rhetoric, the origins of this year’s risk rally lie in obscure technicals driving central bank liquidity. This time the culprit is not the Fed balance sheet, but rather a decline in government deposits at the ECB, and surges in reserves at the BoJ and PBOC. Since October, these have collectively added >$1tn in liquidity. While the sheer size of potential further interventions demands attention, at this point we think most of the boost to reserves is done. This implies that the story for the rest of this year should return to being one of liquidity drainage and risk weakness.
What caught my eye was how King sounded more like a blogger than a member of the establishment. Linking asset prices to money printing is something the central banks have always denied, but if the big banks are now openly saying it, things must be coming to a head.
Japan, China and Europe have seen their money supply surge since October, despite the US attempting to tighten policy. That worked right up until the last fortnight, courtesy of the banking crisis, and US reserves have ballooned again.
Some of the growth in the money supply outside of the US came about as a result of a weaker dollar, but even after taking that into account, King identified a new trillion dollars that is now circulating in the financial system. The system really is addicted to money printing.
Money Supply Grows
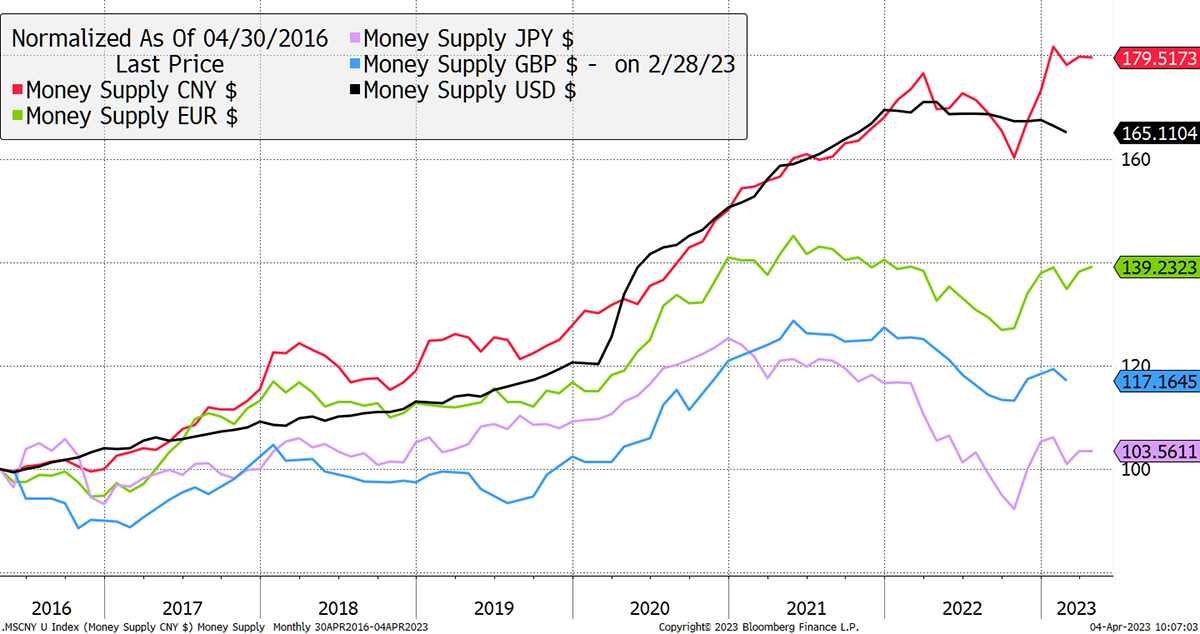
Source: Bloomberg
Incidentally, the Bank of England has been quite restrained, which would partially explain the recent strength in sterling. The sterling index looks at the pound against a basket of currencies, mainly the dollar and the euro. From this perspective, the Truss/Kwarteng low wasn’t that bad, as the euro was also weak at the time. The pound is on the up, which presumably means UK politics is going relatively well for a change.
Sterling Robust
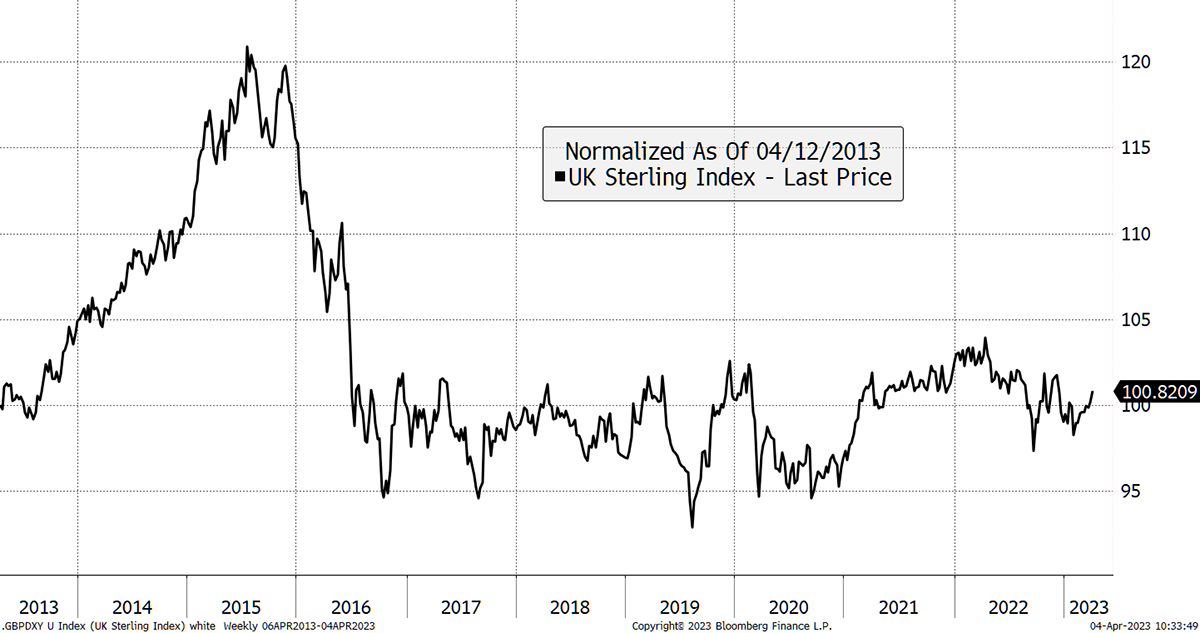
Source: Bloomberg
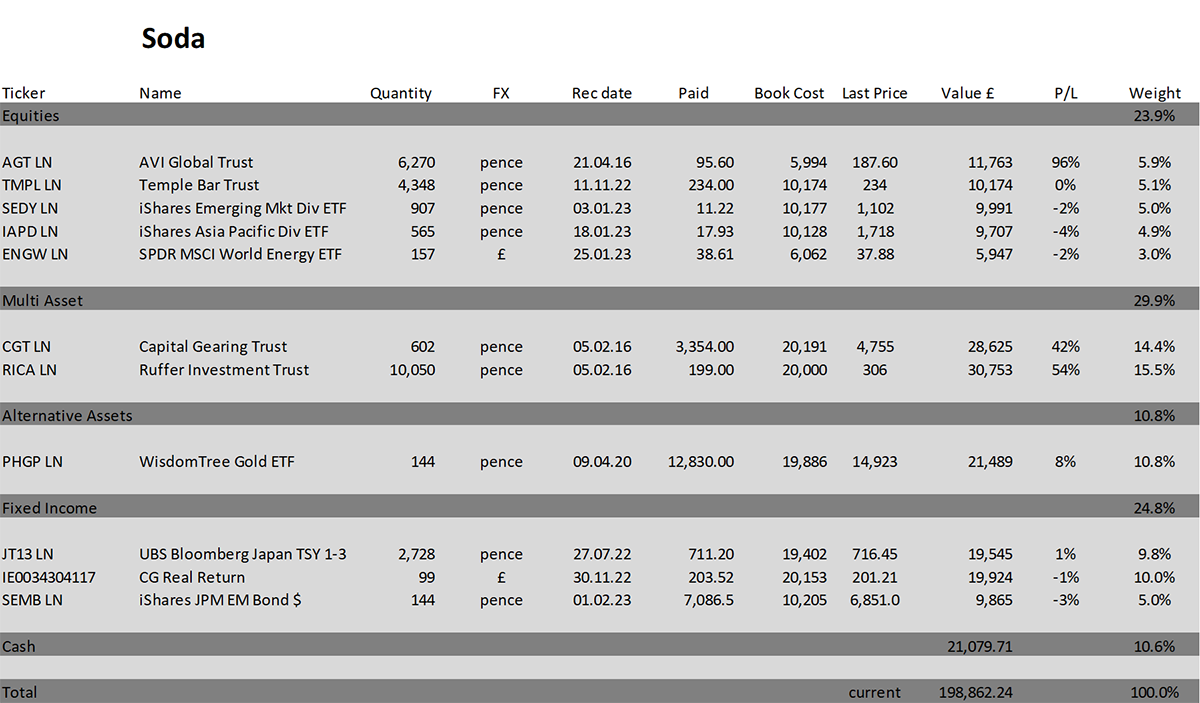
Yet the pound is close to the top of the range, and it may be a good time to take advantage of that. In recent weeks, I increased exposure to gold in Soda, so it is just above 10%, which in conjunction with TIPS, feels right. I may do more in time, but not at this point.
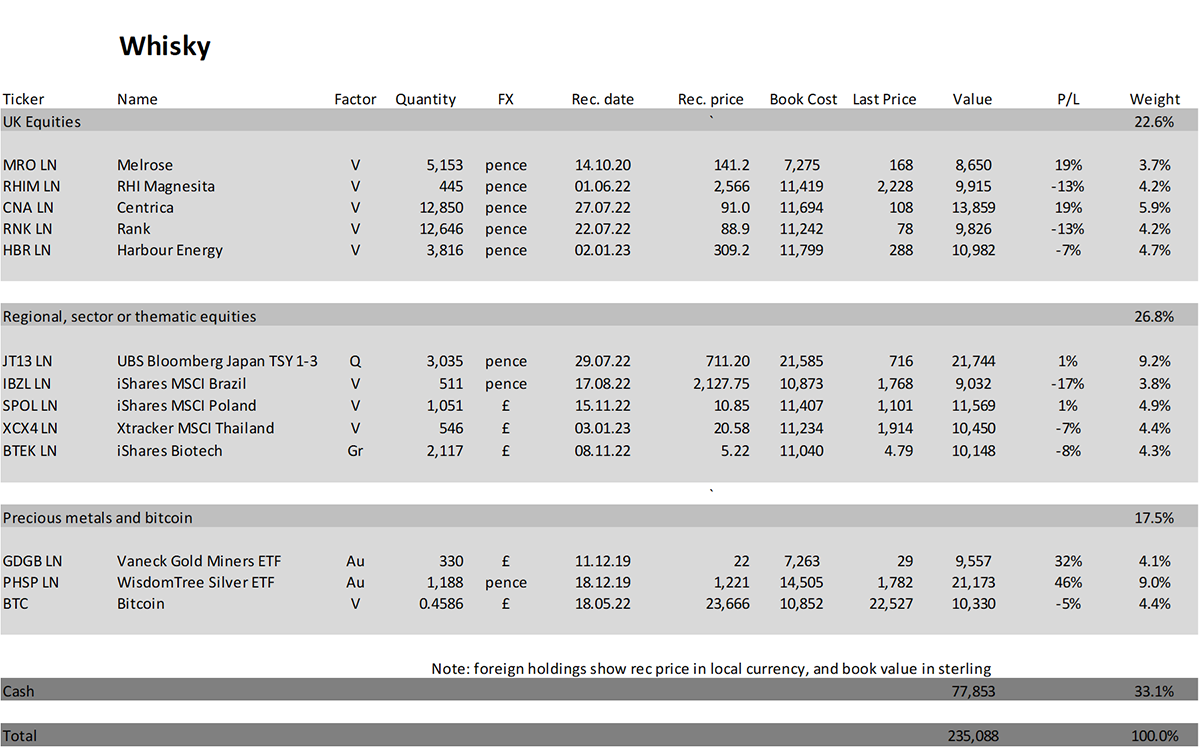
Buying 6% iShares Silver (SSLN) in Whisky
For the Whisky portfolio, I will increase exposure to silver by 6%, so the new total is 15%. SSLN will sit alongside our current holding PHSP. These ETFs are identical as they both hold physical silver. However, SSLN charges 0.2%, whereas PHSP charges 0.49%. A reader pointed this out, and other than not wanting to look like the portfolios are sponsored by iShares, which they are not, the cheaper one makes sense. iShares seem to undercut everyone.
Following the Fresnillo (FRES) sale, we have 13% in precious metals (silver and miners), which given the strong pound and tsunami of printed money, could be higher. There is also a large cash position in Whisky, and it makes sense to reduce it when suitable opportunities arise.
Above all, silver is cheap gold. The gold-to-silver ratio has averaged 66 this century, and today is 82. A move back to the average would see a 20% excess gain from silver. And when precious metals come back in favour, it could significantly overshoot. Remarkably, institutional investors are lightly positioned in gold and silver.
Gold to Silver Ratio
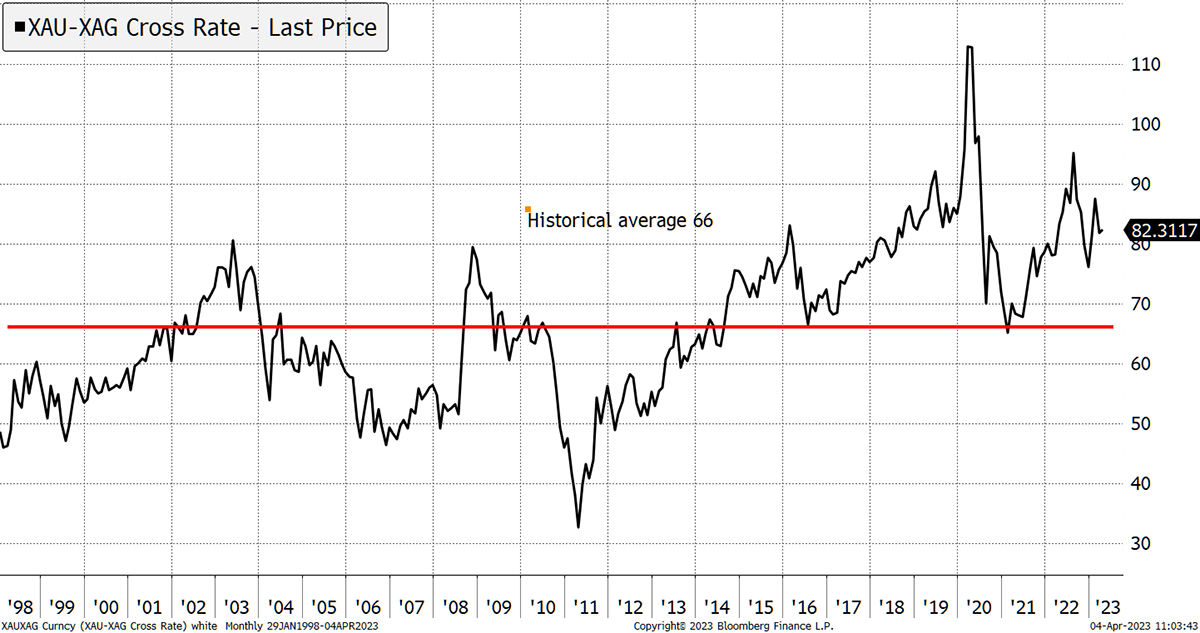
Source: Bloomberg
We mustn’t forget oil either. The recent actions by OPEC remind us that the death of inflation is no slam dunk. The oil market is tighter than in previous cycles because there has been little incentive to secure new supplies. It is an example of inflation volatility which we should get used to.
Risk
The Whisky portfolios have generally had 20% or more in precious metals, typically silver and gold mining shares. This purchase takes us back towards normal. Silver is a liquid asset that offers reasonable value. However, if we went into a period of severe monetary policy, i.e. much higher interest rates, then the price could fall.
Action:
Buy 6% iShares Silver ETF (SSLN) in Whisky.
Postbox
Please can you superimpose your views on property, as a whole, and the different types of property (described below in your email dated 22nd Mar 2021) on the Money Map. This will be extremely helpful in giving us a mental model to think about property.
To recap from last week, I stated that land is a real asset, a building depreciates like plant or machinery, the income stream is economically sensitive (although often inflation-linked), and the financing is sensitive to credit conditions.
There is no simple answer to the question, and I don’t think you can pick a regime for property “as a whole”, just as you can’t for any other asset class.
Office and retail property sit in “quality” or “growth” as they are largely financial assets. That is because the value of the leases can exceed the value of the land and buildings. Many property entrepreneurs have made their fortunes this way.
They bought a building and then signed up tenants with good credit (doctors and governments are highly sought after) with long leases. Thanks to an increasingly low-interest rate environment, those leases became worth more than the building purchased. The higher quality of the tenants’ creditworthiness, the less exposed it is to the economy. Furthermore, the longer the leases are signed, the better. Good tenants with long leases, and no debt, lean towards quality. If the tenants were more economically exposed, with shorter leases, and some debt, the asset would lean towards growth. The leases and financing arrangements are instrumental in assessing the asset, and so the same building could sit in quality or growth depending on other factors.
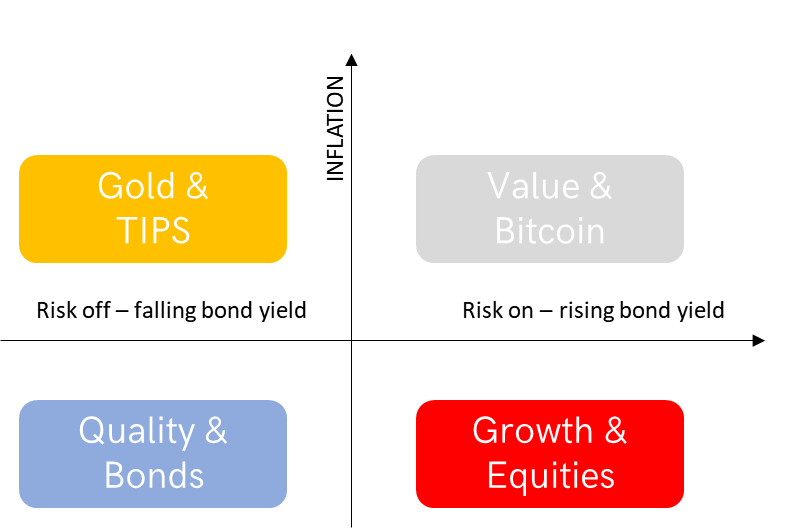
For industrial property (including agriculture), where the rents are lower, and the buildings simpler, the dominant value is the land. This is likely far from the city centre. Industrial property is a real asset and sits firmly in value.
As I said last week, house builders seem to have long-term gold-like qualities, assuming the business has no debt. The simple model of a land bank and building houses lives in the top left, as discussed last week. But the more business-like (wages, high volumes, marketing expenses etc.) the house-building company, the more economically exposed it becomes (growth).
If your property has no debt, it will still fall in value when times get tough because other property portfolios around you will be overloaded with debt, and their forced selling sets market prices.
There is no simple answer as to where property sits on the Money Map because land, buildings, rents, leases and debt cycles all have a different impact. Industrial property and farms are the inflation hedge, while retail and offices are the money makers during the good times.
What do you think about listed UK residential property funds? The PRS REIT (PRSR) is trading at a 35% discount to NAV. Given the well-publicised shortage of rental homes, the income side seems secure, and more than half of its debt has a fixed interest rate for 15+ years. Similarly, RESI is at a 43% discount with an 8% yield. The risks to residential property are obvious, but this type of discount seems to price an awful lot in. Am I missing something?
No, there is value in property shares, as I wrote last October. The trouble is the financial side of property is now firmly under pressure. I was hopeful that IUKP, the UK REIT ETF I recommended, would have lasting promise, but the recent bank failures have changed that.
The current price of PRSR is 30% below book value, which was reported at 114.9p per share at the year end. The discount is the stockmarket’s view of where the asset value is headed, not where it has been. Also in the statement, PRSR missed their earnings forecast by 11% due to higher financing costs.
PRS REIT
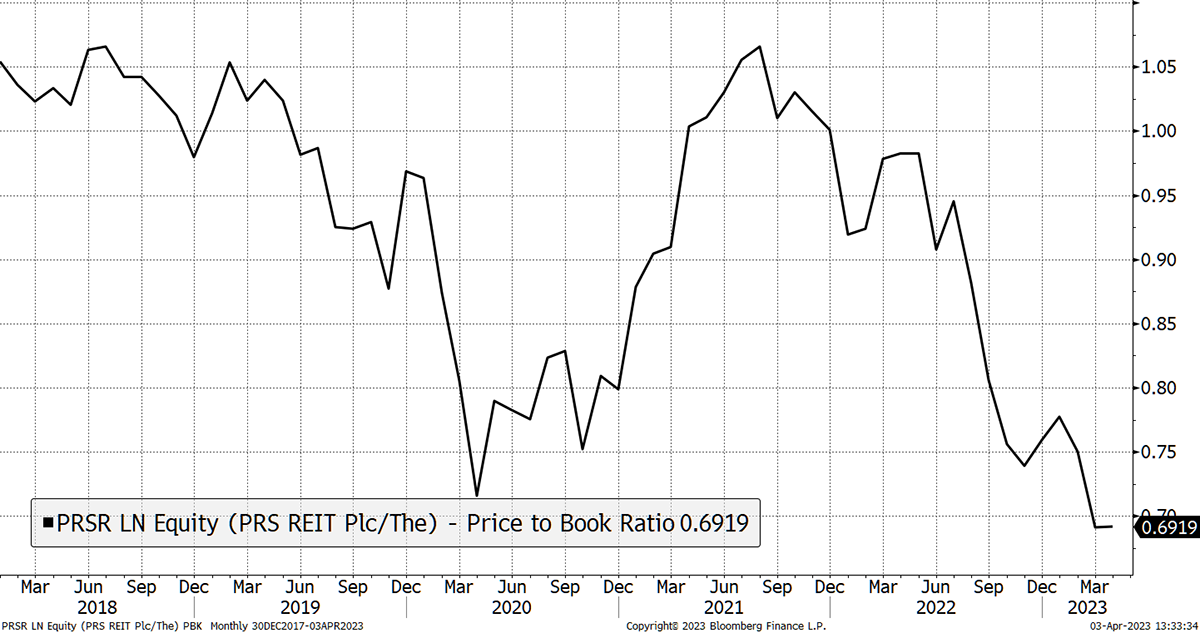
Source: Bloomberg
Look to similar companies in Germany, such as Vonovia (VNA GY) and LEG Immobilien (LEG GY), which both now trade more than 50% below net asset value. Few doubt the value, but many recognise the financial risks which have ballooned. If interest rates keep on rising, we will likely see a significant fall in valuations, and this is why investors are worried. If prices fall, and liquidity dries up further, listed property will remain under pressure.
But when things settle down, I will be very keen to find bargains in property. It is yet another example of the carnage created by volatility and uncertainty in bonds.
I loved the Ruffer review. All good, but Alexander Chartres’ piece particularly so. Whilst the piece pointed to a bank merger as the cause, it chimed with the quote by Russell Napier that the response to the Asian Sovereign debt (and LTCM) crisis in 1997 ‘paved the way for the age of debt’ that we are ‘enjoying’ now.
It was excellent and sets Ruffer apart from most other investment firms, which would not be able to put together such a thought-provoking document. If you haven’t seen it, you can read it here. Get comfortable; it’s a long one.
Portfolios
Note for New Readers
The design of The Multi-Asset Investor investment process is to blend Soda and Whisky according to the level of risk you wish to take. Hopefully the clue is in the names as to which portfolio carries more risk. Most investors would be best suited to 80% in Soda and 20% in Whisky (a less risky blend) or 60% in Soda and 40% in Whisky (a riskier blend).
Example
A recommendation is often, but not always, 5% of either portfolio. If I added 5% of ABC in Whisky and you followed a 40/60 Whisky/Soda approach, then ABC would be 5% x 40% = 2% of your overall pot. If you followed a 20/80 Whisky/Soda approach, then ABC would be 5% x 20% = 1% of your overall pot.
This approach enables the Whisky Portfolio to pursue more adventurous opportunities than if it was designed to be the entire strategy. The inevitable, and hopefully infrequent, failure of some individual recommendations means the maximum loss is limited to between 1% and 2% of the overall pot which is within reasonable scope. Cautious investors can be 100% Soda, but a little Whisky brings your investment journey to life and will hopefully boost returns in the long run.
Soda - a long-term, low turnover portfolio investing in funds, exchange-traded funds (ETFs) and investment trusts (including Berkshire Hathaway). The Soda portfolio is down 0.6% this year and is up 98.9% since inception in January 2016.
| 2016 | 2017 | 2018 | 2019 | 2020 | 2021 | 2022 |
| +21.7% | +8.8% | -1.8% | +19.6% | +8.9% | +14.3% | +3.5% |
Whisky - a tactical, actively traded portfolio investing in stocks in the FTSE 350 Index, investment trusts, global ETFs and bitcoin. The Whisky portfolio is up by 5.2% this year and up 135.1% since inception in January 2016.
| 2016 | 2017 | 2018 | 2019 | 2020 | 2021 | 2022 |
| +24.7% | +5.4% | -4.3% | +21.4% | +20.4% | +12.9% | +8.0% |
Summary
We are back to those uncertain times which require patience. We are in some kind of bull market, but it is precarious and driven by money printing - which is finally becoming a more mainstream view - as opposed to fundamentals.
There will be no issue next week due to the holidays but be sure I will send flash notes if required. I wish you a very Happy Easter.
Please let me know your thoughts by emailing me at charlie.morris@bytetree.com, or tweet me @AtlasPulse.
Many thanks,
Charlie Morris
Editor, The Multi-Asset Investor
General - Your capital is at risk when you invest, never risk more than you can afford to lose. Past performance and forecasts are not reliable indicators of future results. Bid/offer spreads, commissions, fees and other charges can reduce returns from investments. There is no guarantee dividends will be paid. Overseas shares - Some recommendations may be denominated in a currency other than sterling. The return from these may increase or decrease as a result of currency fluctuations. Any dividends will be taxed at source in the country of issue.
Funds - Fund performance relies on the performance of the underlying investments, and there is counterparty default risk which could result in a loss not represented by the underlying investment. Exchange Traded Funds (ETFs) with derivative exposure (leveraged or inverted ETFs) are highly speculative and are not suitable for risk-averse investors.
Bonds - Investing in bonds carries interest rate risk. A bondholder has committed to receiving a fixed rate of return for a fixed period. If the market interest rate rises from the date of the bond's purchase, the bond's price will fall. There is also the risk that the bond issuer could default on their obligations to pay interest as scheduled, or to repay capital at the maturity of the bond.
Taxation - Profits from investments, and any profits from converting cryptocurrency back into fiat currency is subject to capital gains tax. Tax treatment depends on individual circumstances and may be subject to change.
Investment Director: Charlie Morris. Editors or contributors may have an interest in recommendations. Information and opinions expressed do not necessarily reflect the views of other editors/contributors of ByteTree Group Ltd. ByteTree Asset Management (FRN 933150) is an Appointed Representative of Strata Global Ltd (FRN 563834), which is regulated by the Financial Conduct Authority.
© 2026 ByteTree Group Ltd