
Week 27 2021
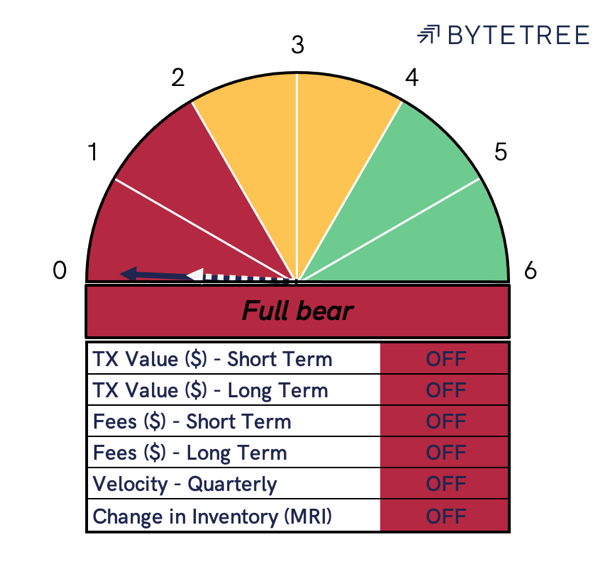
The Network demand model remains fully OFF this week, as price closed yesterday at $35,308. The Network Demand model remains in cash after selling bitcoin when the model moved to a 2/6 on 2nd June at $36,706.
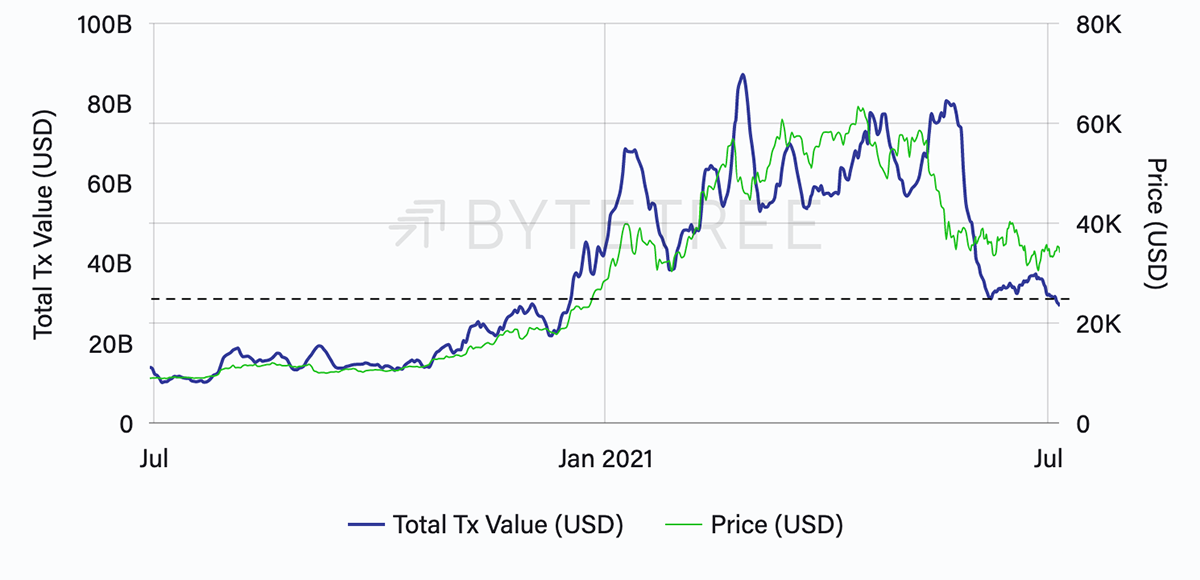
On-chain transaction value has continued to fall again this week, despite price holding around the $34k level. Last week, we commented that a base was forming around $30bn of settlements per week, indicated by the black line below. However, this trend was broken yesterday.
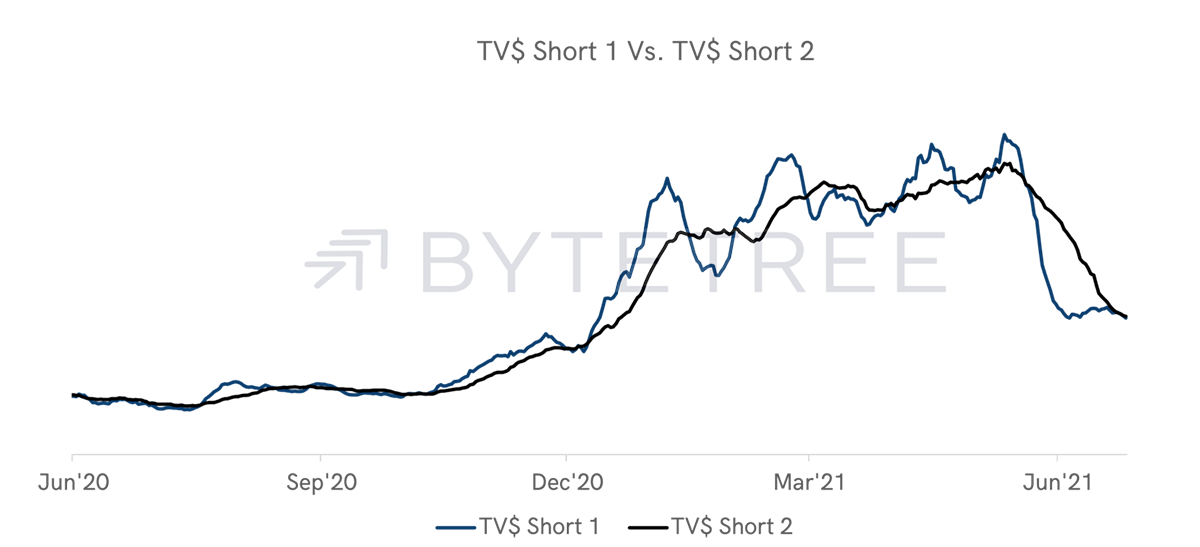
Last week we also commented that the short-term TV$ could turn “ON” in the coming week. While it did briefly turn “ON”, the break of the trend above means that it turned back “OFF” the following day, as shown on the chart below. Remember that this is the quickest signal in the model and is therefore not indicative of the longer-term trend.
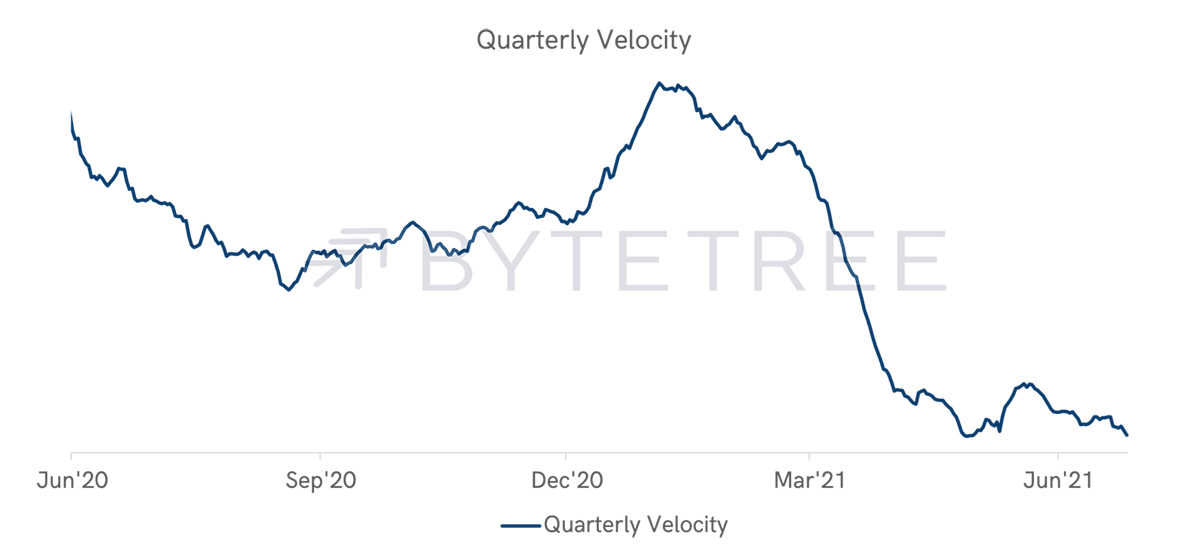
Zooming in on TV$ over the past month, the downtrend becomes more evident.
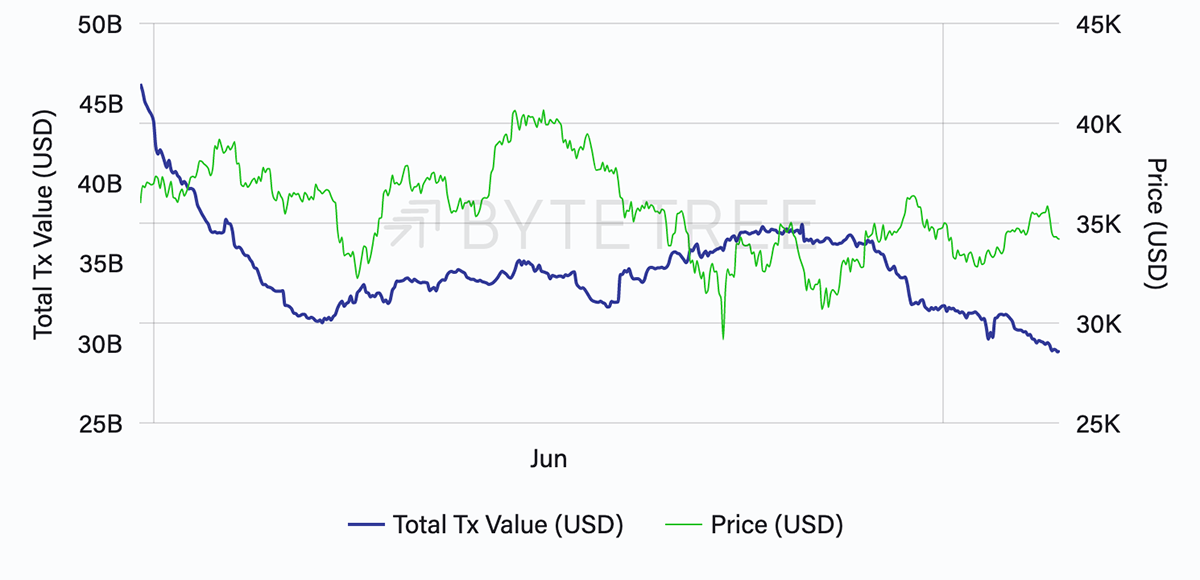
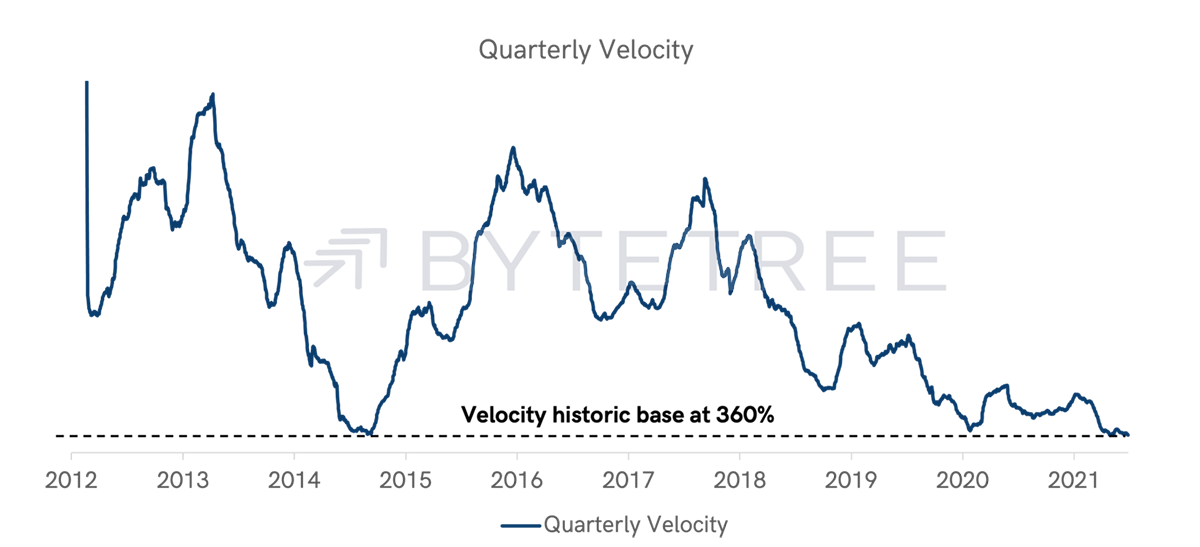
Falling TV $ along with a flat or rising price indicates that fewer Bitcoin are circulating through the economy. This is measured by velocity, which continues to fall.
Quarterly velocity currently sits at its historic base around 360%. The only other time this happened was in mid-2014, with Bitcoin trading at $460.
Transaction fees have changed direction this week after block intervals rose to almost 15 minutes per block (+50% Vs the target time). Fees in USD terms are building a trendline base around $1.25M per day, or $8.8M per week, indicated by the black line below.
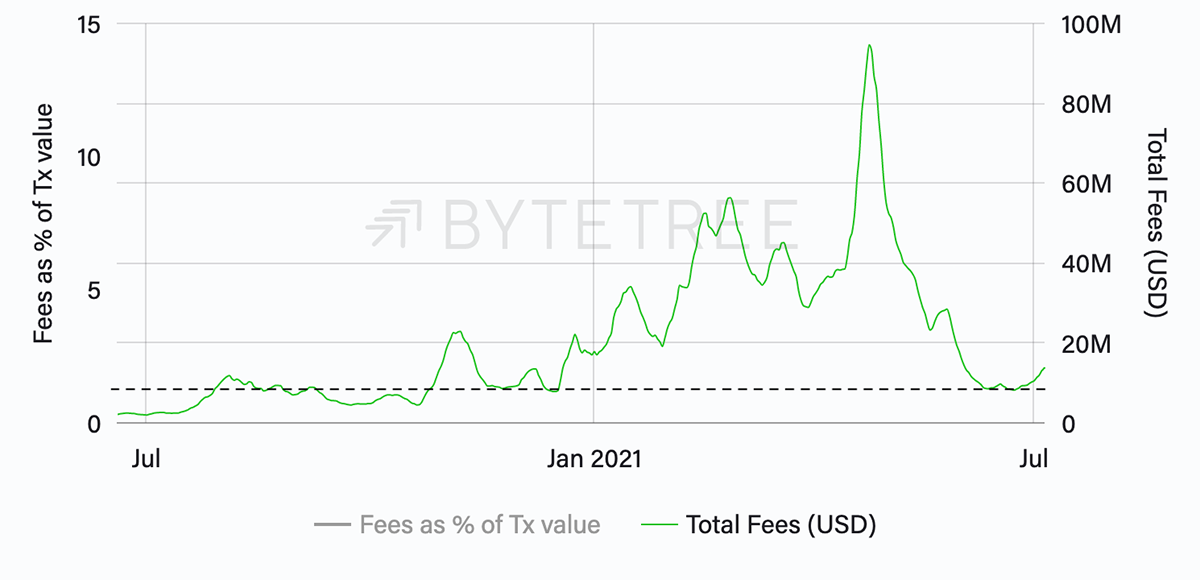
While fees remain significantly lower than the rest of the year to date, the forming of a trend indicates a core level of demand at this price level. This recent uptick in fees sees the short-term Fees $ indicator moving in a positive direction for the first time since early April.
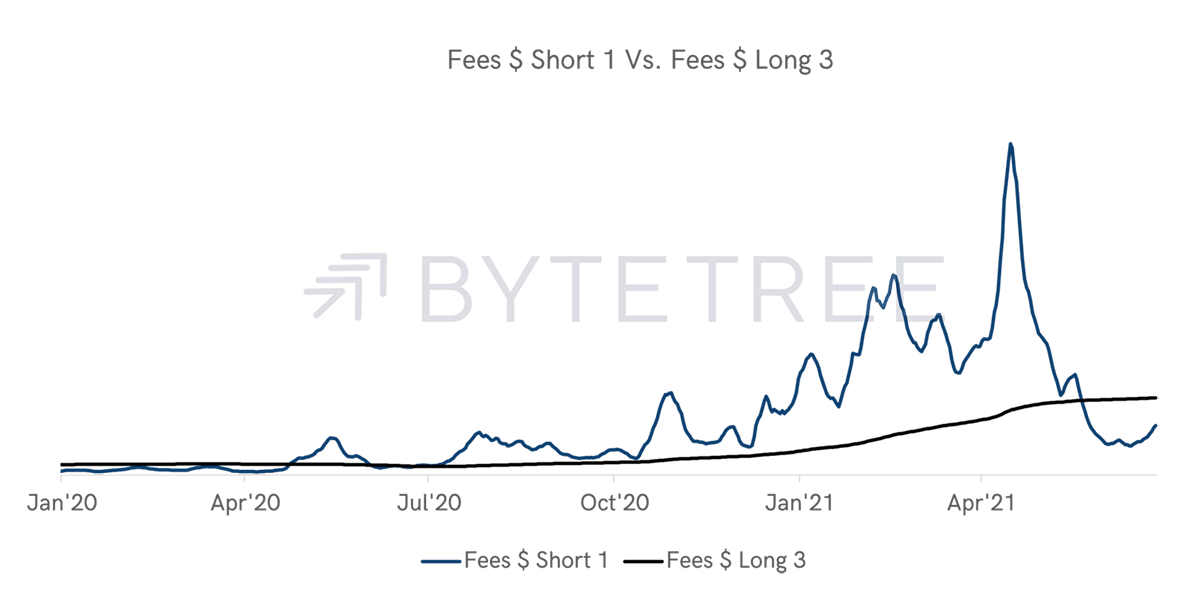
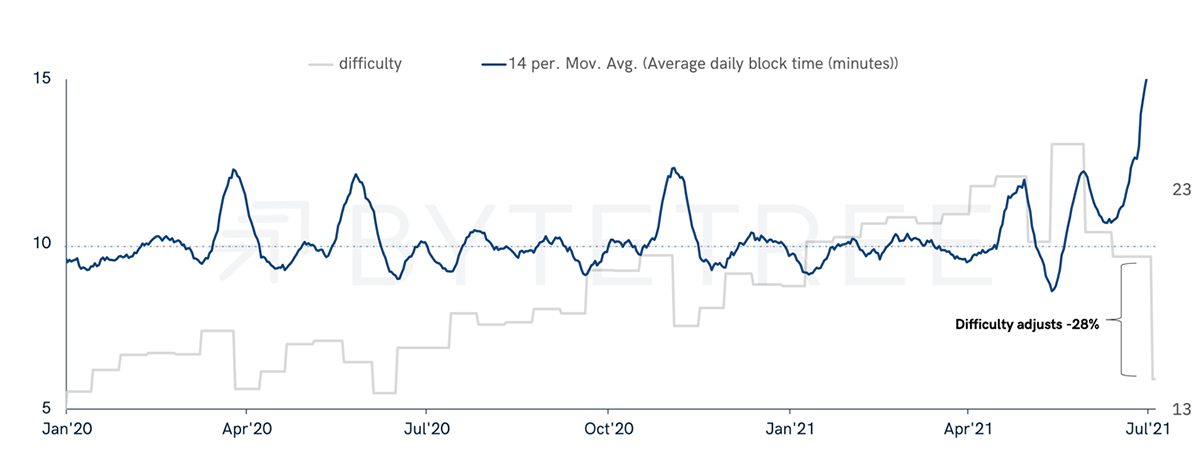
Out of context, this move looks positive. However, we will have to wait and see how this trend plays out now that difficulty has adjusted downwards by 28%. This is the largest ever negative difficulty adjustment in Bitcoin’s history and will significantly increase throughput on the Bitcoin blockchain. Increasing throughput relieves pressure on the mempool, the waiting room for transactions, and thereby reduces fees. The average block time can be seen below in blue, with the difficulty rate in grey.
While exogenous events have caused a short uptick in fees, overall network demand remains uninspired this week. With transaction throughput back on the rise, we will be looking closely at TV$ and Fees$ to see how network participants react.


