
Week 26 2021
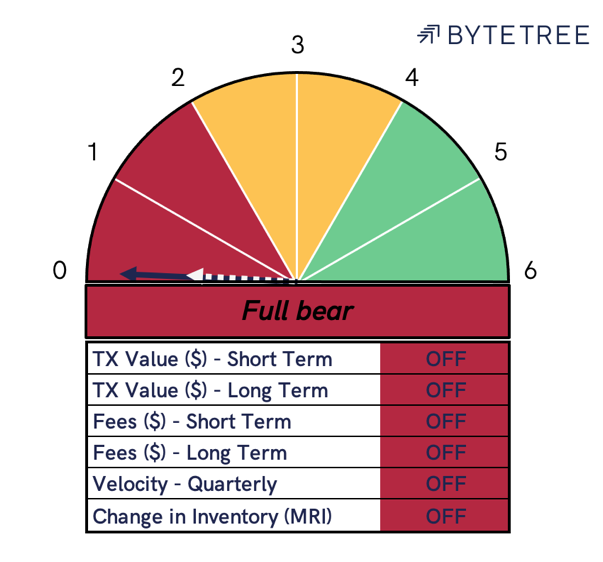
The Network Demand Model remains fully OFF this week, as price closed yesterday at $34,652. The Network Demand model remains in cash after selling bitcoin when the model moved to a 2/6 on 2nd June at $36,706.
On-chain transaction value has stabilised, currently transferring close to $5Bn per day. While this marks a 62% fall from mid-May, it is positive to see a base starting to form.
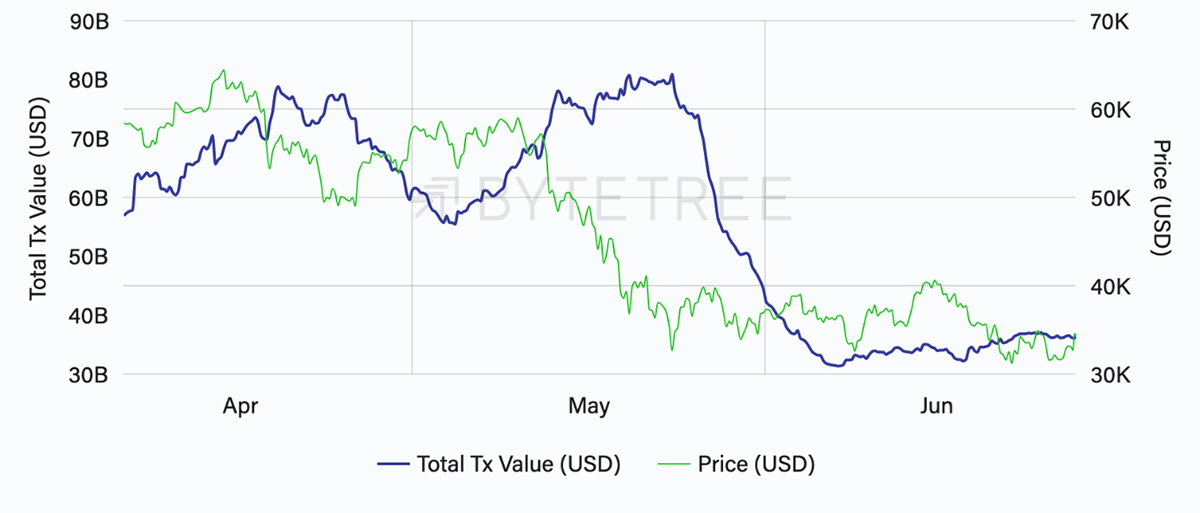
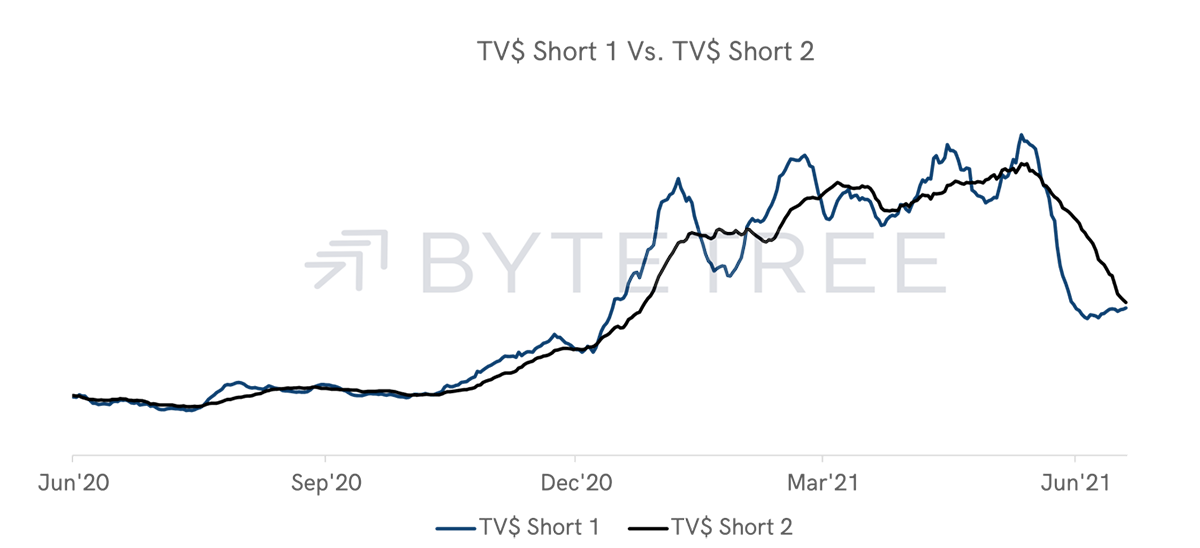
The stability in transaction value $ means that the short-term indicator (below) is the only one likely to move back towards ON in the week ahead. It is important to note, however, that this is the quickest signal in the model and is therefore not indicative of the longer-term trend.
The strongest indicator of bitcoin’s long-term trend has historically been fees (below). As we have often said, fees are paid to miners to prioritise the order of transactions in a block. Higher fees directly correlate to higher network demand.
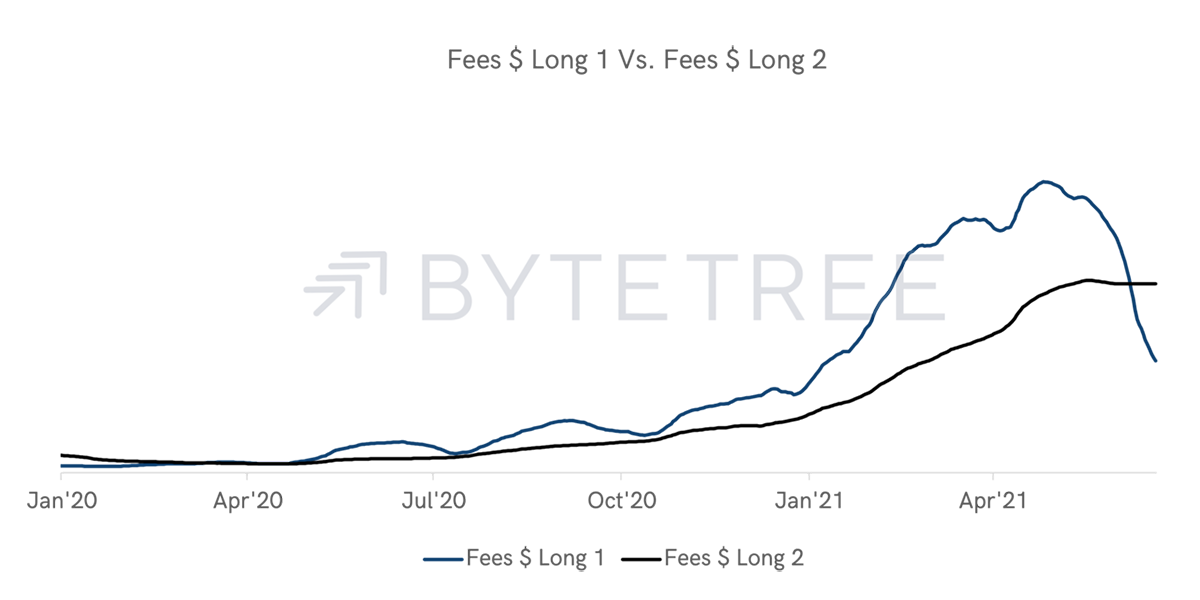
Transaction fees have continued to decline this week, having initially moved to OFF on the 16th June with bitcoin trading at $40,106. You will notice on the chart above that the long-term fee indicator remained ON throughout the bull market starting in April of last year.
All other indicators remain firmly OFF this week. Network velocity, long-term Fees $ and long-term TV $ show little sign of recovery for the time being.
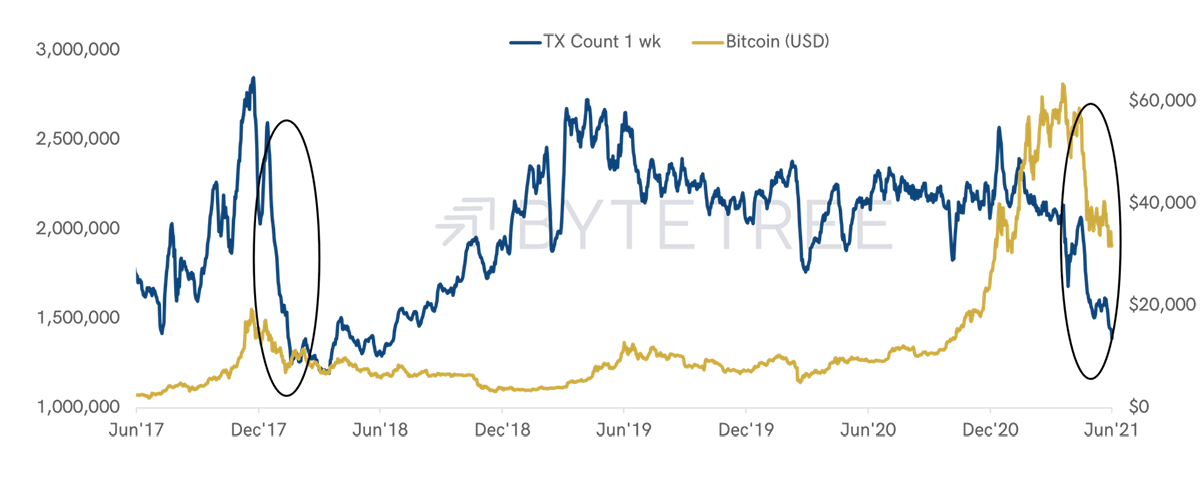
The number of transactions occurring on the Bitcoin Network also suggests that demand is falling.
While the number of transactions does not currently feature in our demand model, it has visually been a leading indicator of price in prior cycles.
The chart below shows 1-week transaction count since mid’17. Notable events include the sharp fall in transactions following the Dec’17 peak and a similar pattern emerging over the last few weeks.
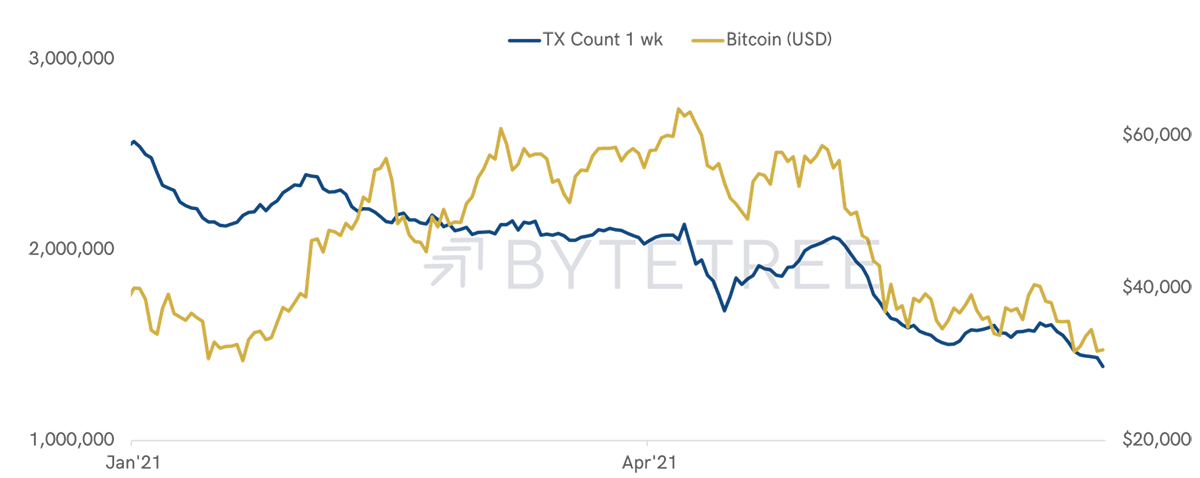
Zooming in on 1-week transaction count year-to-date (below), there is a clear pattern to observe between short-term price peaks and surges in the number of transactions.
It is worth remembering that a single transaction can vary between $0.001 and +$1Bn, and that service providers often batch transactions to save on network fees. We track the transaction value $ of these batched transactions on the Terminal to help us contextualise a fall in transaction count.
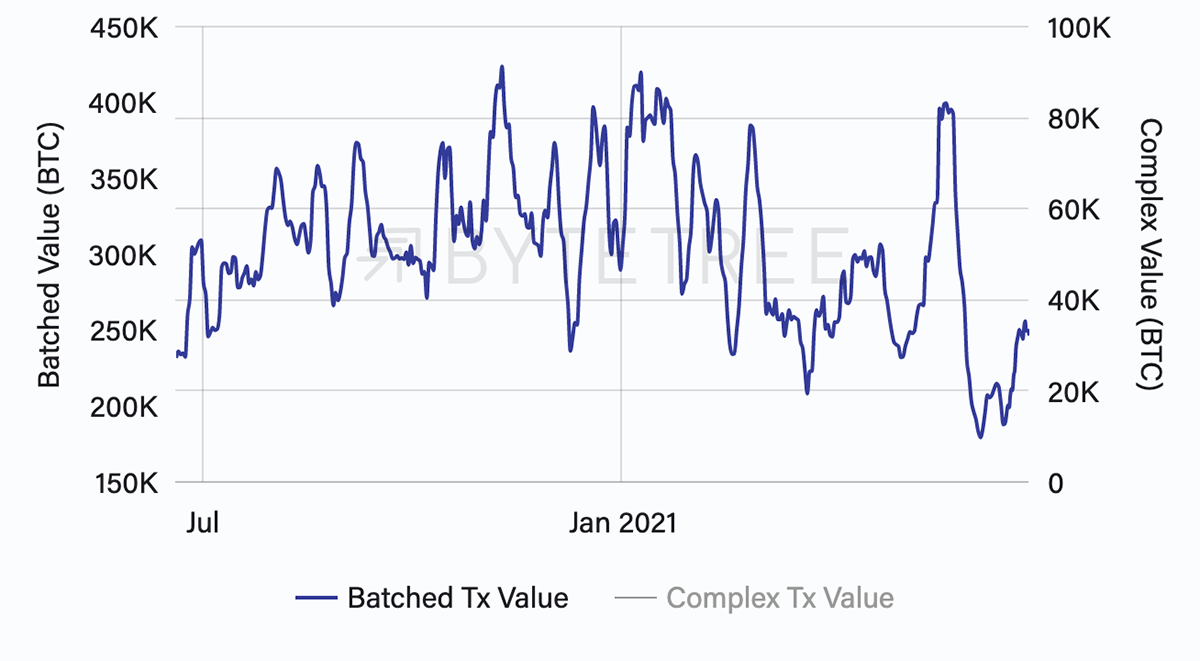
As can be seen above, the fall in transaction count has been partially offset by an increase in batched transaction volumes. However, this increase is not significant when viewed in context of the last 12 months.
The overall picture shows lacklustre demand across the Bitcoin Network and the model remains bearish.


