
Gold Driven by Geopolitics, not Macroeconomics

Atlas Pulse Gold Report Issue 110;
I have little doubt that this boom in precious metals, while clearly overbought and excitable, is not a normal bubble. It cannot be easily attributed to macroeconomic factors, but to geopolitical shifts.
Atlas Pulse Issue 109 was written 50 days ago, calling for silver at $175 by 2030. These days in precious metals, much can happen in such a short space of time. In December 2018, when I last turned bullish on gold, it was trading at $1,250, and silver was just below $15. Today, those prices are $5,162 and $106, and that’s after a Thursday afternoon crash. In Shanghai, they trade silver at $123.
When I said $175 silver by 2030, the idea was that it could happen over the next four years, rather than months.
Gold and Silver since the October Peak
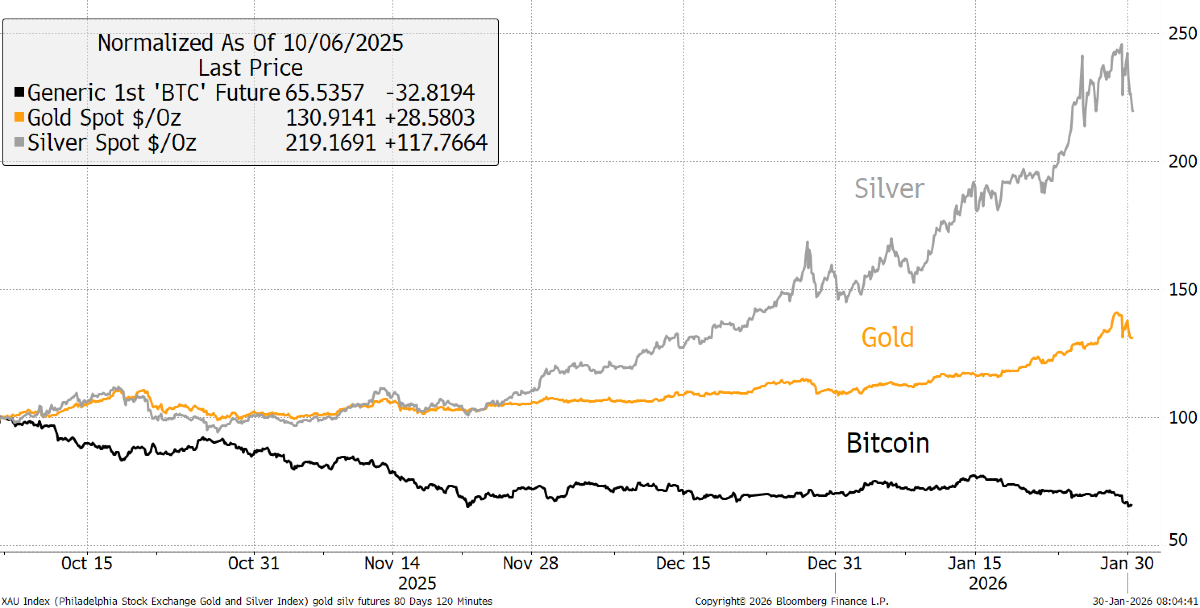
We’ll get to Bitcoin, but we can’t ignore that “Digital Gold” is down 35% since its all-time high on 6 October, while “Physical Bitcoin” is up 32%. These are indeed interesting times, and the phrase "one in a million" springs to mind. It’s always one in a million, then the unthinkable actually happens. Silver is up 120% since the Bitcoin high.
In December 2018, when I called the gold bull market, Bitcoin was trading around $3,500. Today it has “crashed” to $82,000. In other words, since the gold bull call seven years ago, gold is up 313%, silver 607%, and Bitcoin 2,243%. Whoever said alternative assets were dull?
To understand recent events in gold, I want to go back to basics and see how we got here. We know from history what Gold likes:
- Inflation drives the intrinsic value
- Falling real interest rates boost the present value
- Speculation boosts demand
- A weak dollar helps a bit, but is overstated as a driver
- Gold beats the stockmarket
- Demand from the East
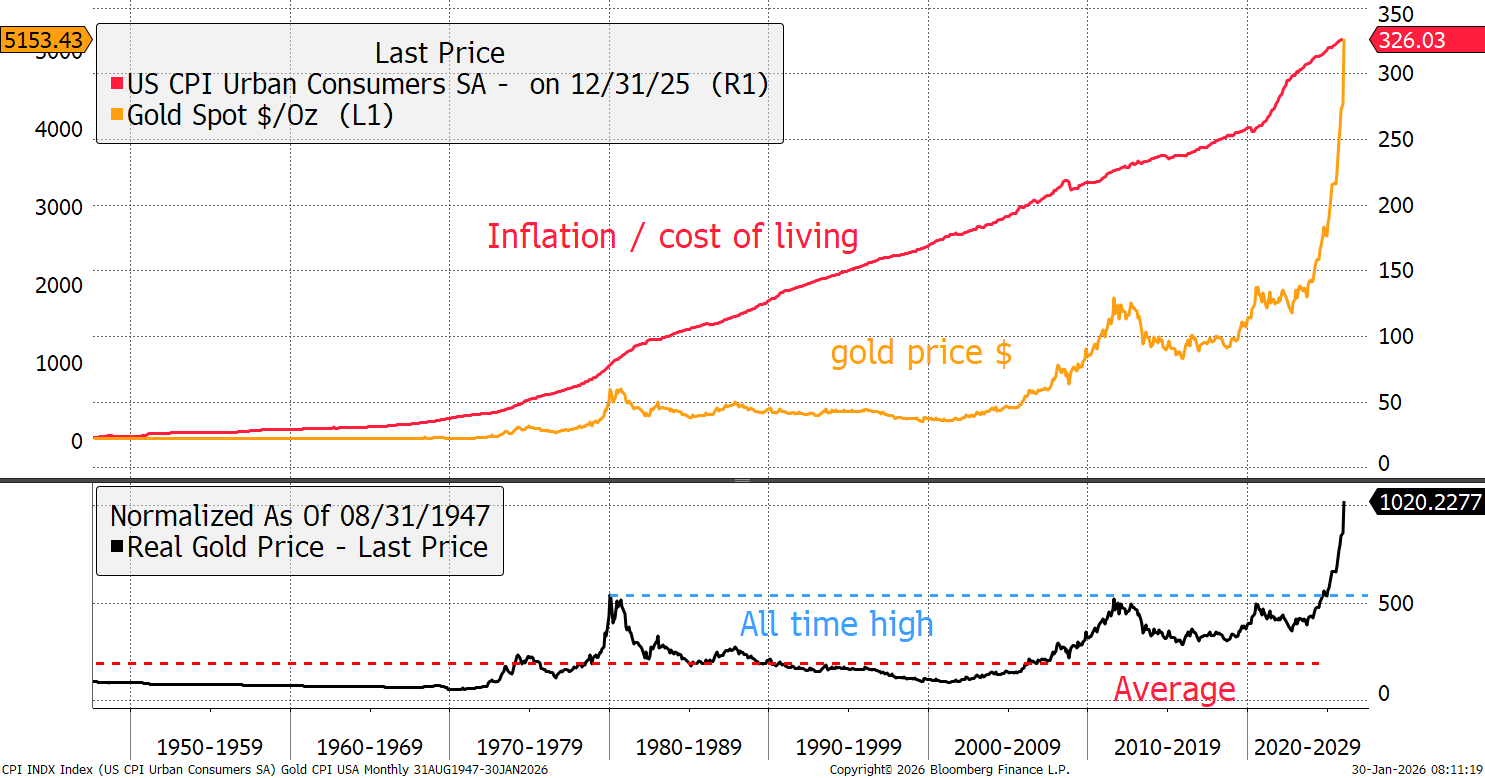
The Real Price of Gold
Gold is twice the level of 1980 high in real terms, but of course, many say inflation is not the cost of goods and services, but the money supply.
Gold (left axis) versus Inflation (right axis)
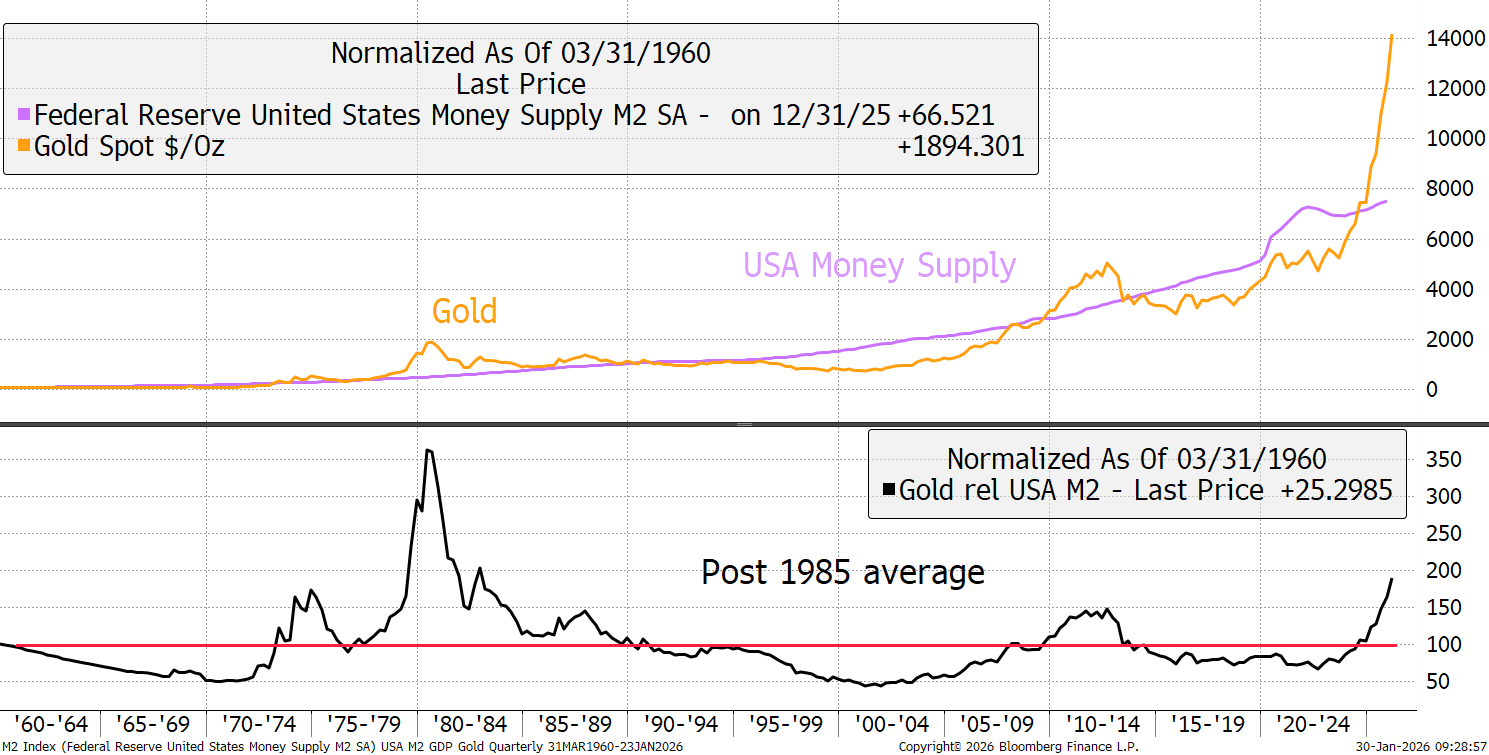
Gold and the US Money Supply
Going back to 1960, this chart now shows gold at twice the long-term average, which is punchy, but still below the late 1970s high. The bulls will note that M2 is turning up again after a lengthy pause. How strong will it be? With Trump in the White House, I suspect they’ll print until they run out of ink.
Real Interest Rates
Gold likes falling real yields, which explains the 2019/20 bull run. Curiously, the gold price shook off the hike in real rates, one of the largest moves in history, in 2022. According to the real-rate-gold theory, that should have seen gold crash by 40%, but it didn’t. It fell peak-to-trough by just 17% and soon recovered. Since 2023, real rates have been broadly stable.
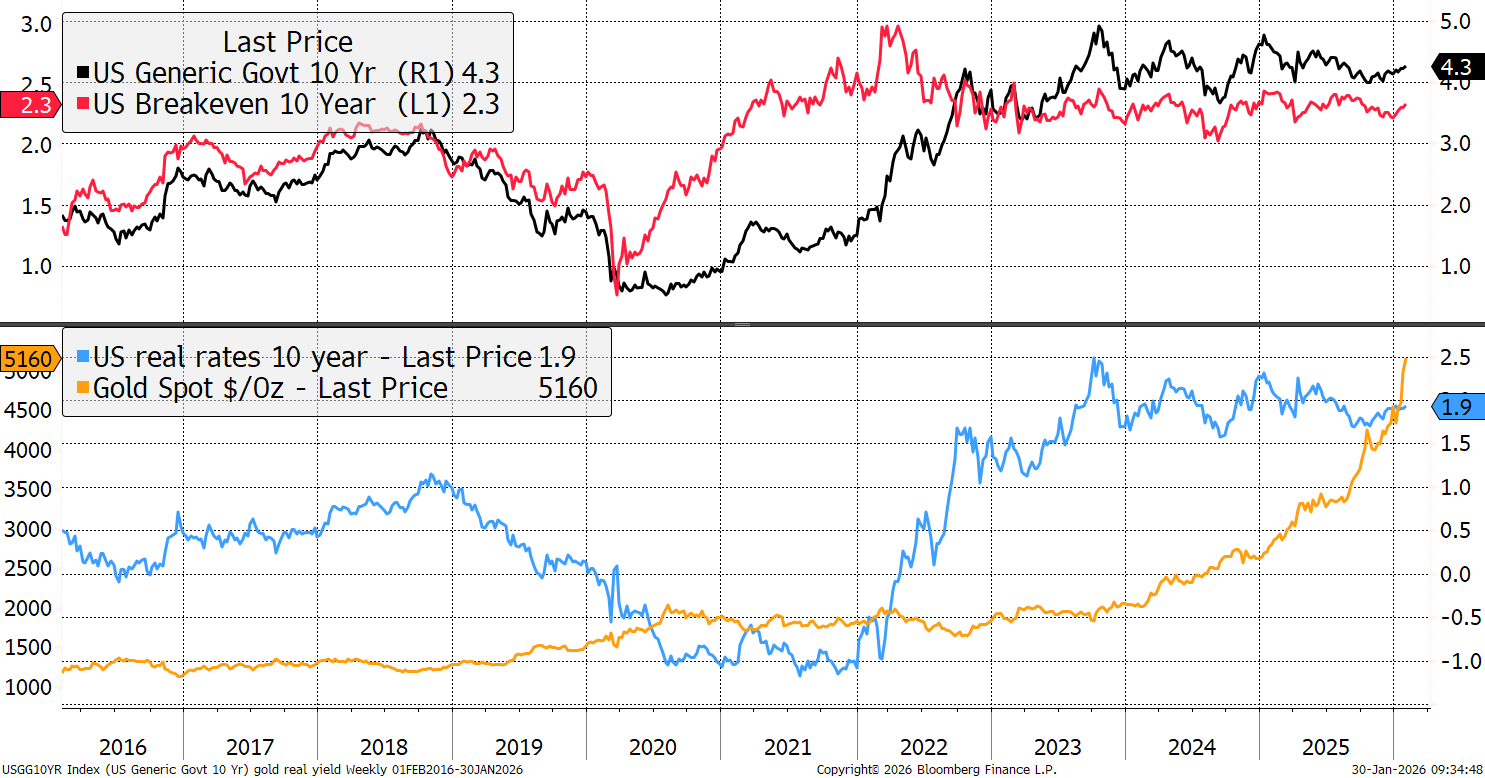
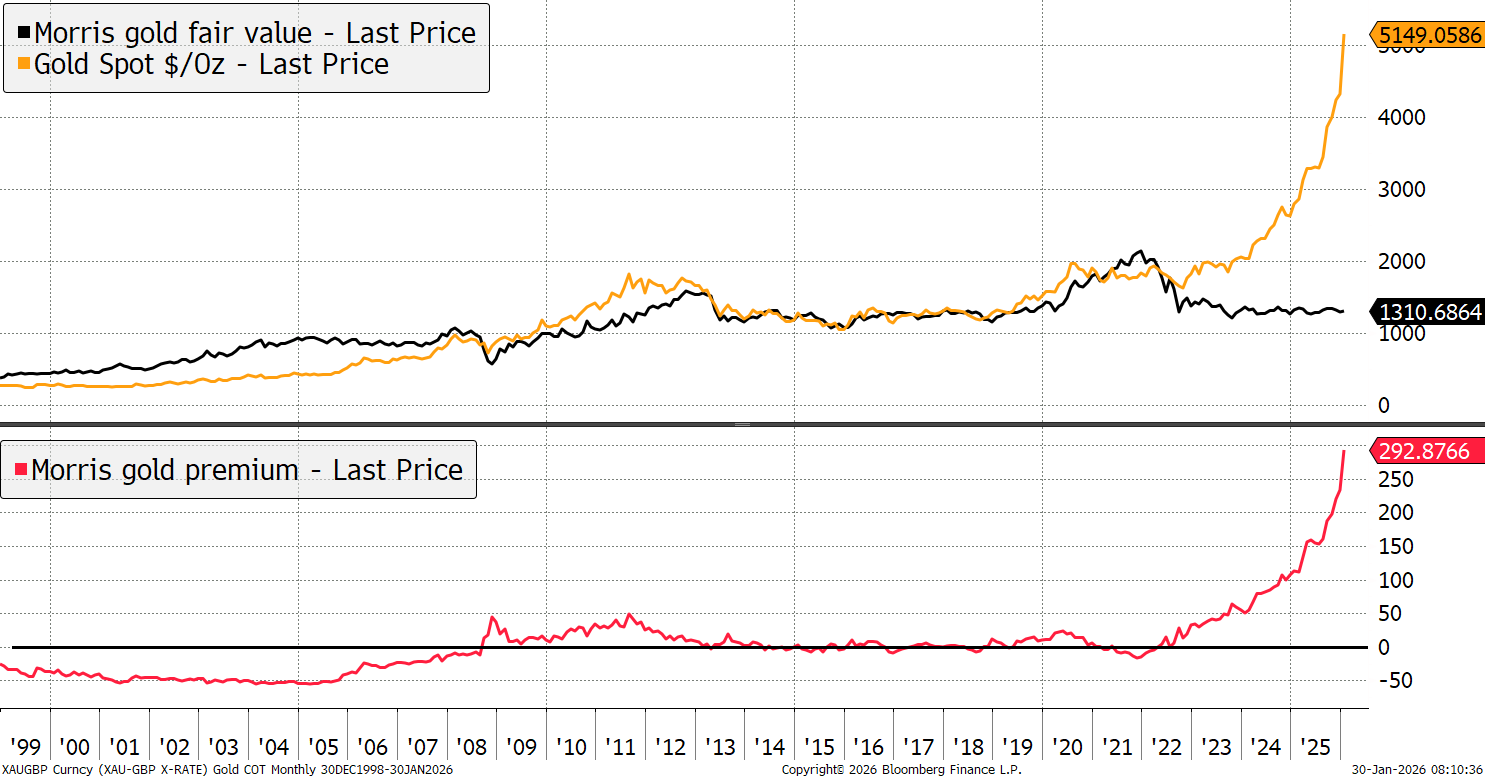
Gold-Real Rate Theory
This theory had worked so well until 2022, when the gold price closely mimicked the price of 20-year TIPS. Then all hell broke loose, and gold locked onto a new regime. It is commonly attributed to the confiscation of Russian assets after the invasion of Ukraine.
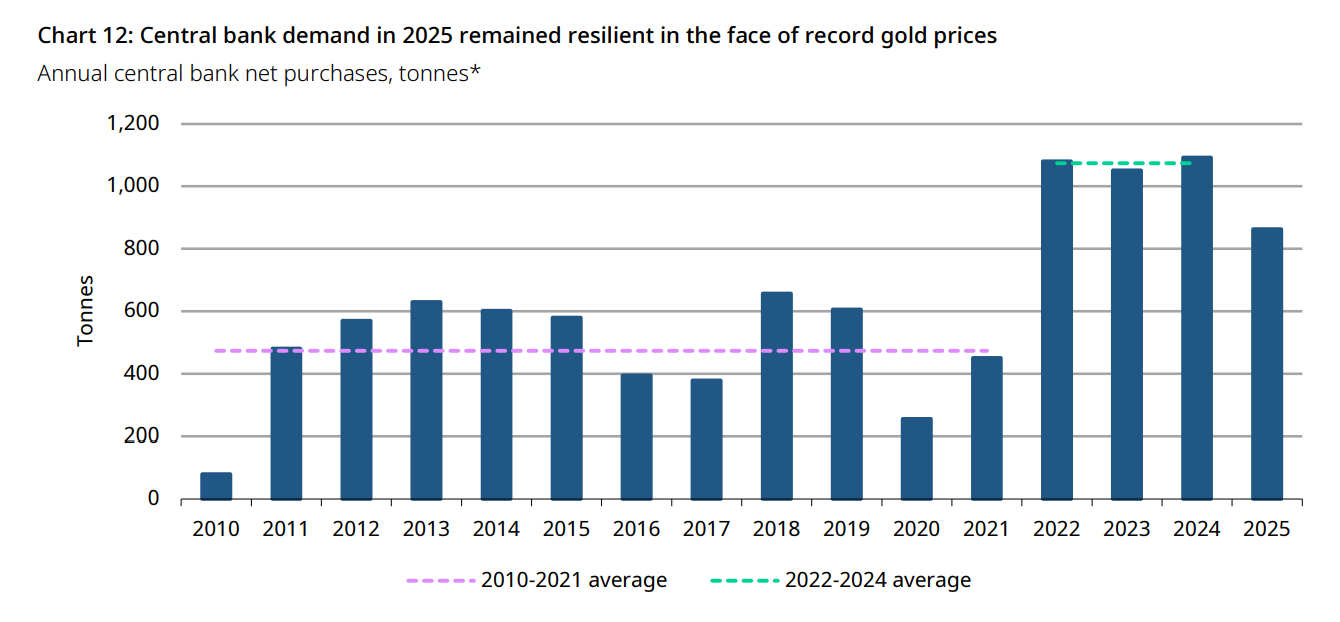
Central Bank Demand
The evidence is clear. The central banks had been steady new buyers up until 2021, and then more than doubled their purchases since 2022. Data on central bank demand in 2025 has just been released, and it was 20% down on 2024, presumably due to higher prices. They are price-sensitive buyers and are known to be a stabilising source of demand. The CBs are perhaps better at underpinning the gold price rather than driving it higher. For that, we depend more on speculators.
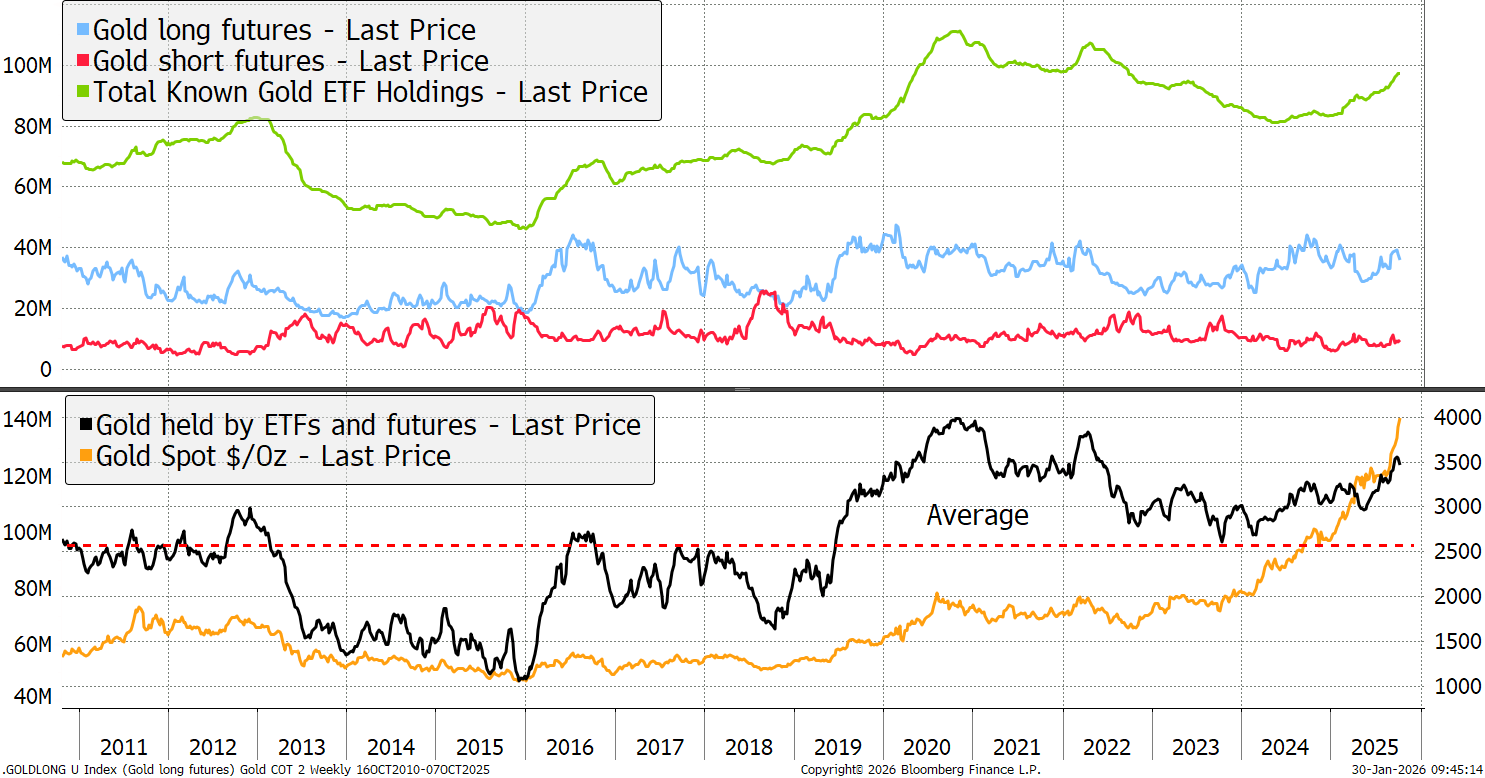
Gold ETFs and Futures
The ETFs (green) gold 105 million ounces, an amount that has not been rising that much, given the scale of the rally. This is a curious thing. The long speculative futures (blue) are high, but not that high either, and the shorts (red) have disappeared. Total Western speculative ounces sit at 110 million, which is below the peak in 2020, when we thought $2,000 was a high gold price. You can’t attribute the gold move above $5,000 to western speculators, bigger forces are at play.
Gold and the Dollar
A weak dollar can be fun, but generally, it has been little more than an inverse relationship. In other words, a 10% fall in the dollar equates to a 10% rise in gold in dollar terms. That said, when a weak dollar is accompanied by other factors, such as high demand or falling real rates, the impact can appear much larger. The US dollar is now in a long-term downtrend. What about the relationship with stocks?
Gold and Dollar Deviation from Trend
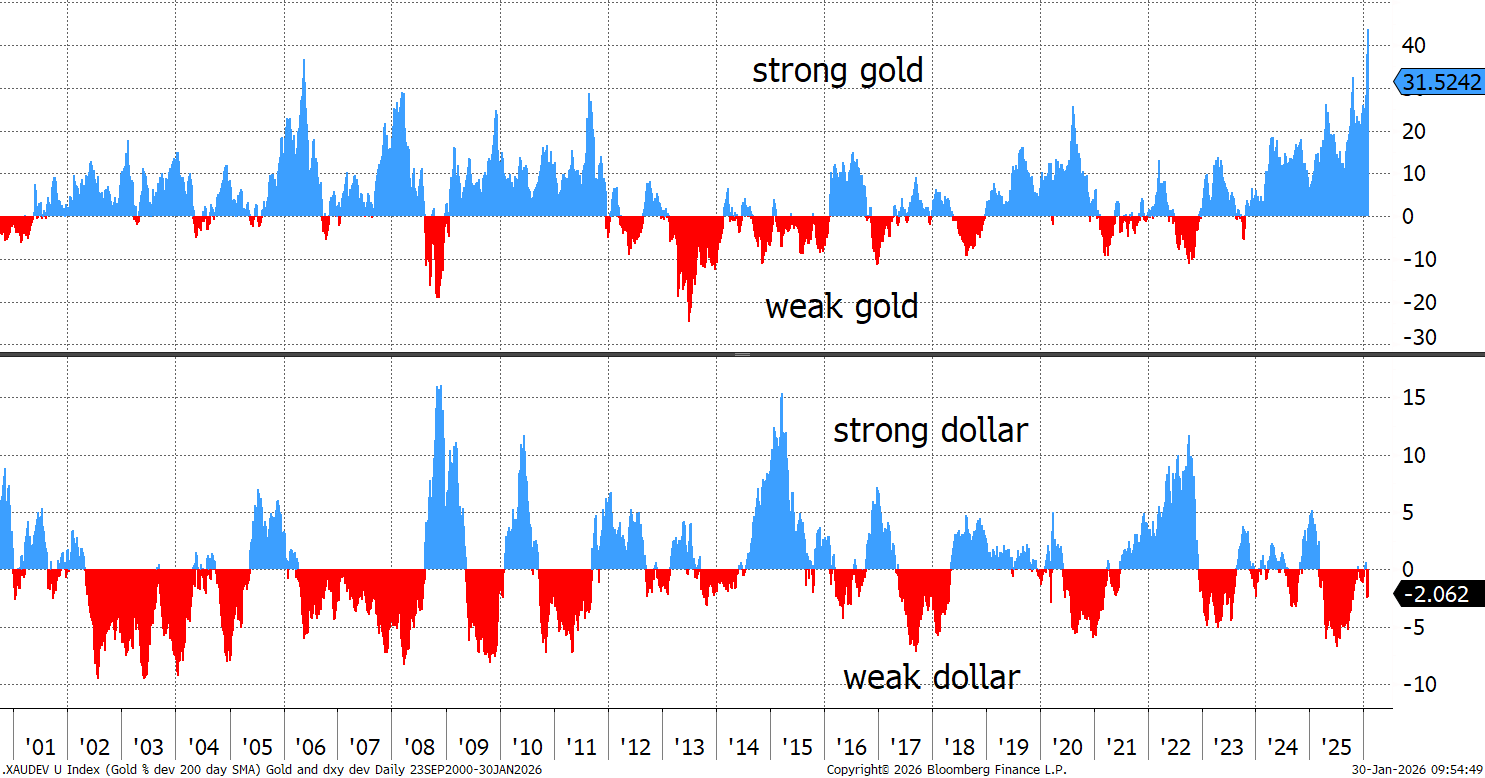
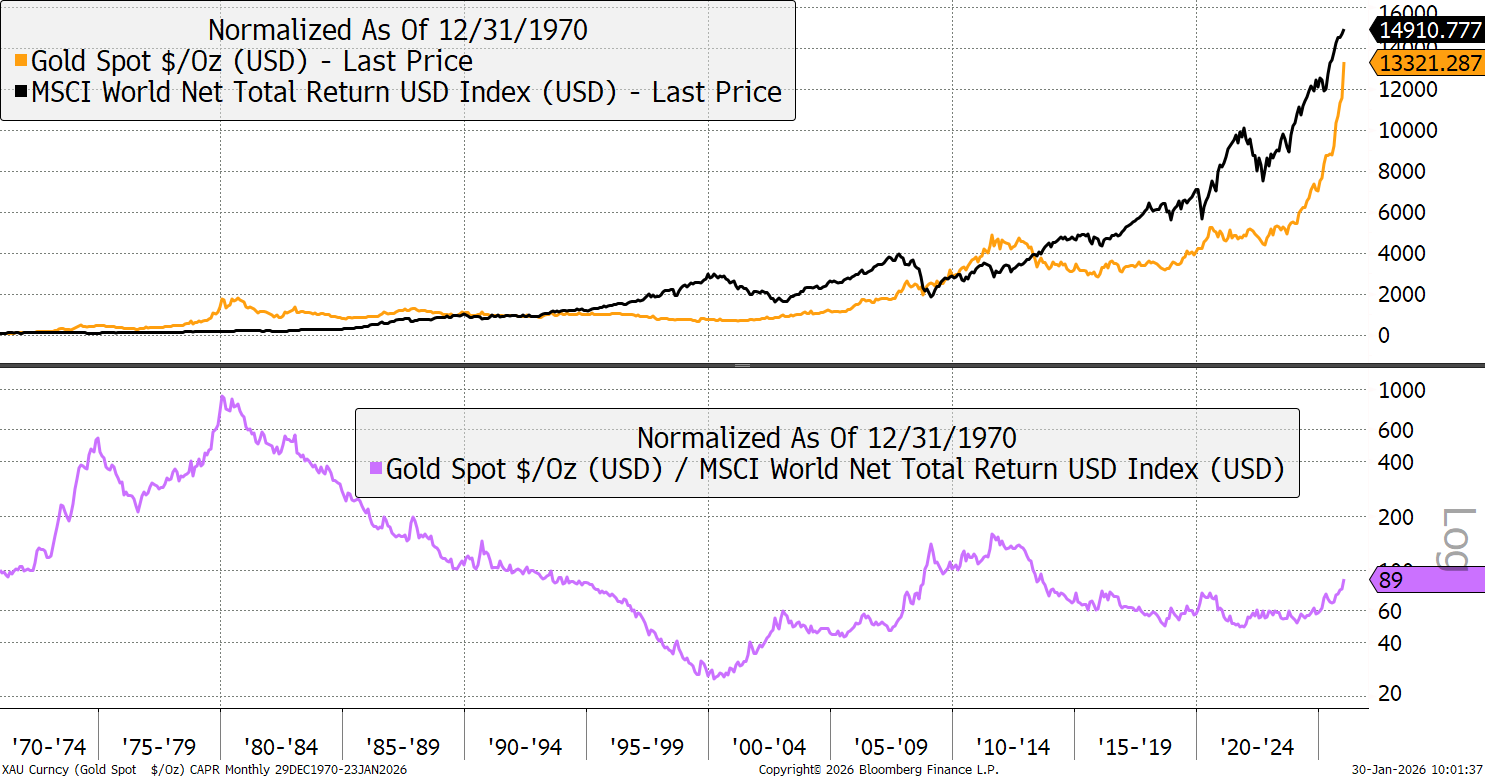
Gold and the Stockmarket
Going back 55 years to 1970, gold and global equities have delivered roughly the same return, including dividends. Gold was ahead of equities in the 1970s, and the 2000s. In 2025, we had a breakout. Gold is in a firm uptrend against the stockmarket.
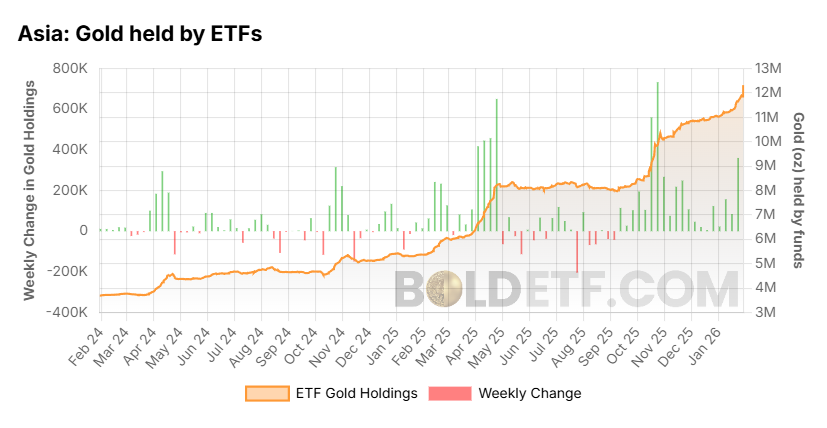
Demand from the East
Global gold ETF demand is understated by 5 million ounces on Bloomberg. Fortunately, ByteTree has come to the rescue and can demonstrate this. That data set shown three charts up misses out on somewhere very important: Asia. Over the past two years, retail investors in India, Hong Kong, and China have added 12 million ounces of gold to their stash. Note how they stepped up last October, after the price correction. It already looks like they are doing just that.
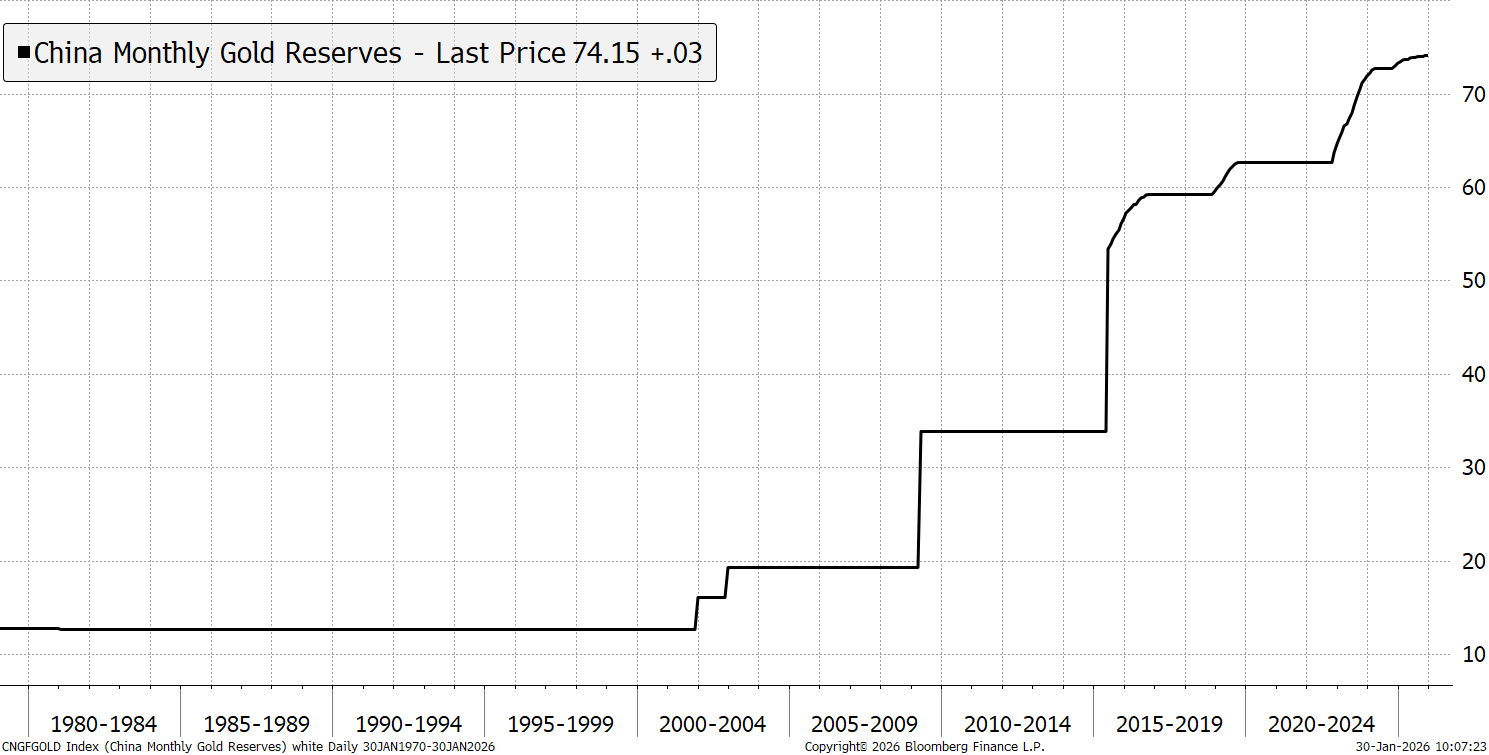
We have already discussed the central banks, but all those who have looked into it suggest that Chinese reserves are understated by between 2x and 10x. It’s a big number. All of the charts above do not have a smoking gun, and there isn’t one. But if Chinese reserves really are understated to this degree, this is it.
Is it a Bubble?
Maybe, maybe not. I would say that bubbles are driven by speculation. This rally is hardly free of that, but it’s not that high, as seen by the discount of gold miners to gold, the Sprott Physical Gold and Silver Trust (CEF), which trades at a 10.5% discount to NAV, and the outflows from things like silver ETFs.
I have little doubt, therefore, that this boom in precious metals, while clearly overbought and excitable, is not a normal bubble. It cannot be easily attributed to macroeconomic factors, but to geopolitical shifts.
The non-OECD central banks are increasing gold as a percentage of their reserves. Global reserves amount to $12.5 trillion, and the gold held by central banks is now worth $3.4 trillion. During the pre-1971 Gold Standard, this stood at 78%, peaking at 150% in 1980. For much of the noughties, gold’s share averaged 10%, and 15% at the peaks. Today it is 27% and rising.
Gold Reserves Versus Total Reserves
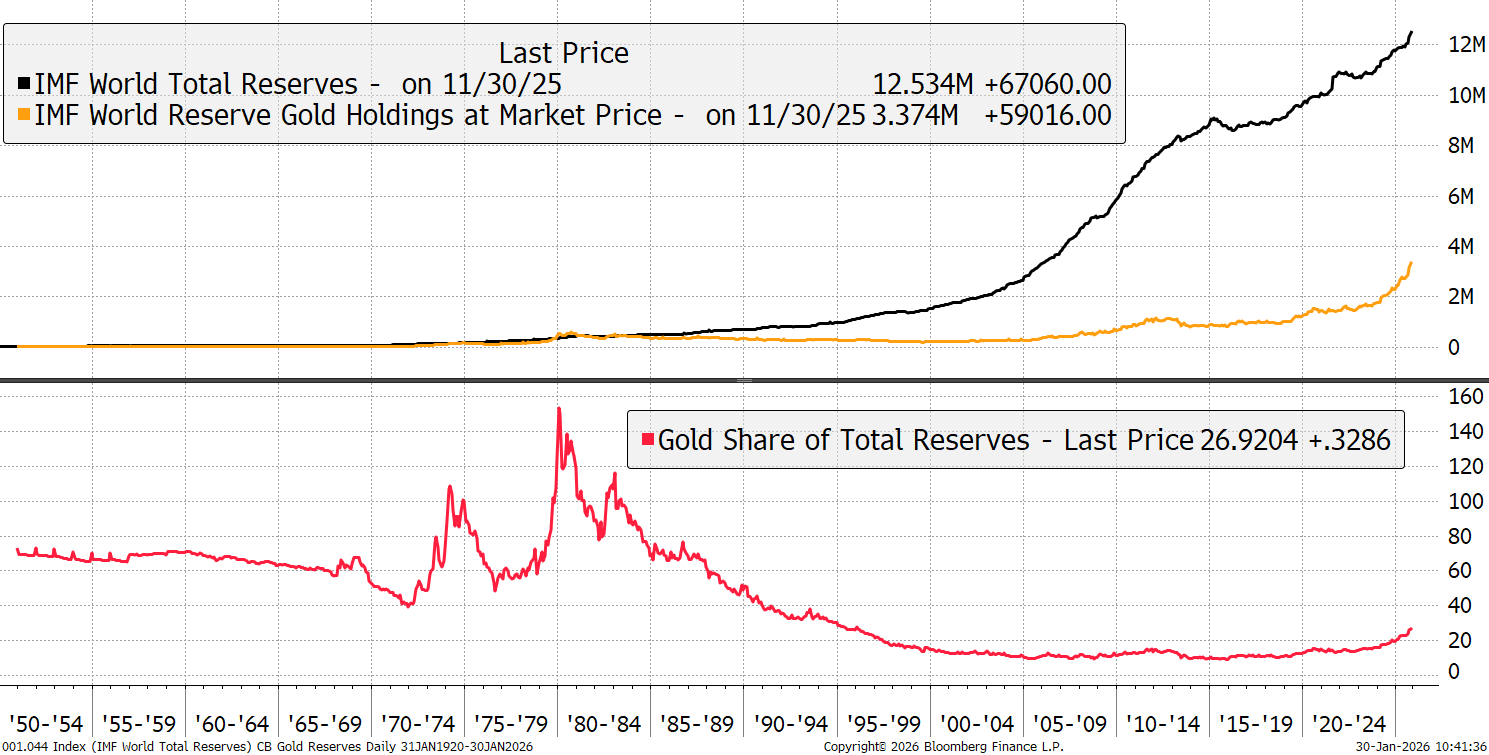
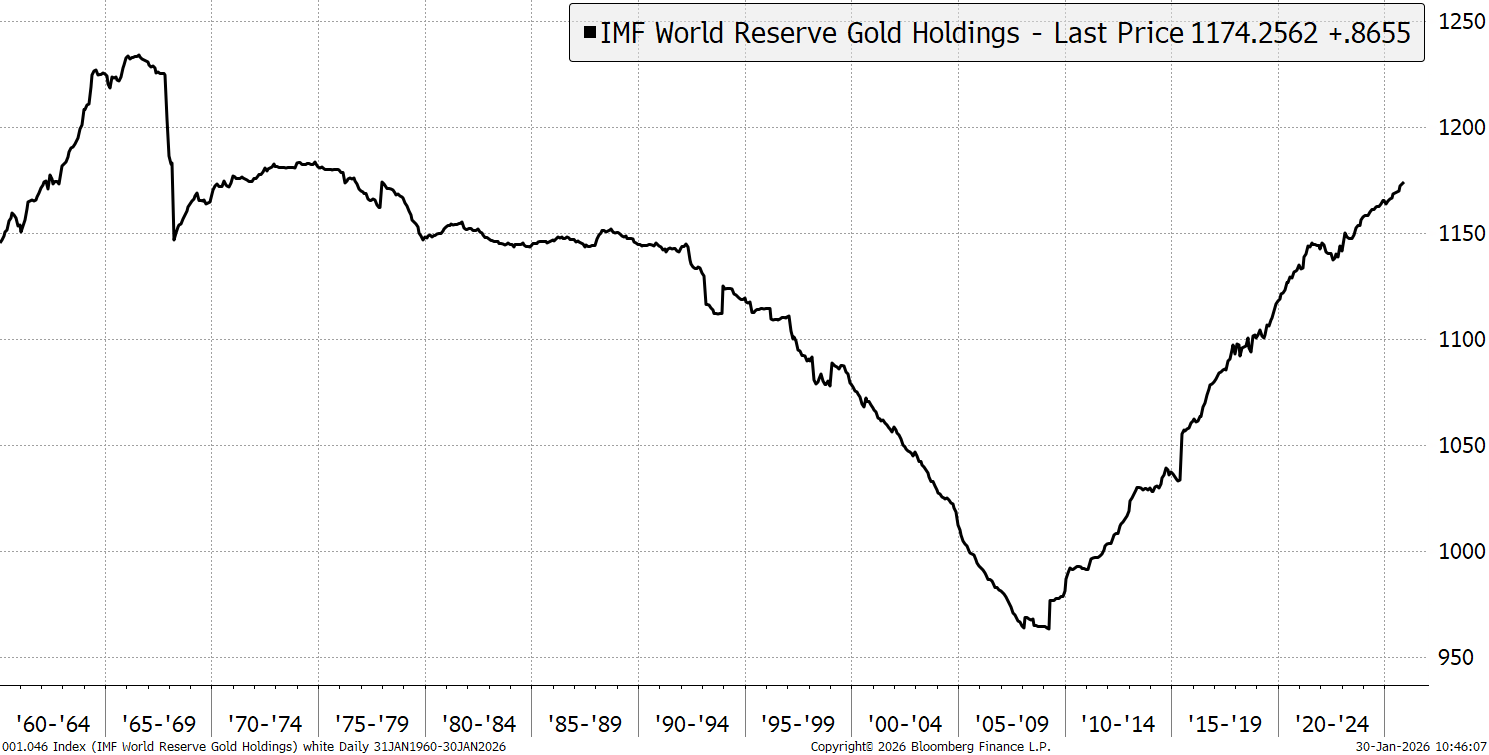
Part of this increase has come from a higher gold price, but it has also been accompanied by purchases. The central banks were selling gold into 2009 and then started to accumulate. This is overwhelmingly led by the non-OECD countries, which have grown gold reserves rapidly in recent decades. Gold reserves, by weight, are approaching an all-time high. Let’s not forget that many central banks underreport their true holdings.
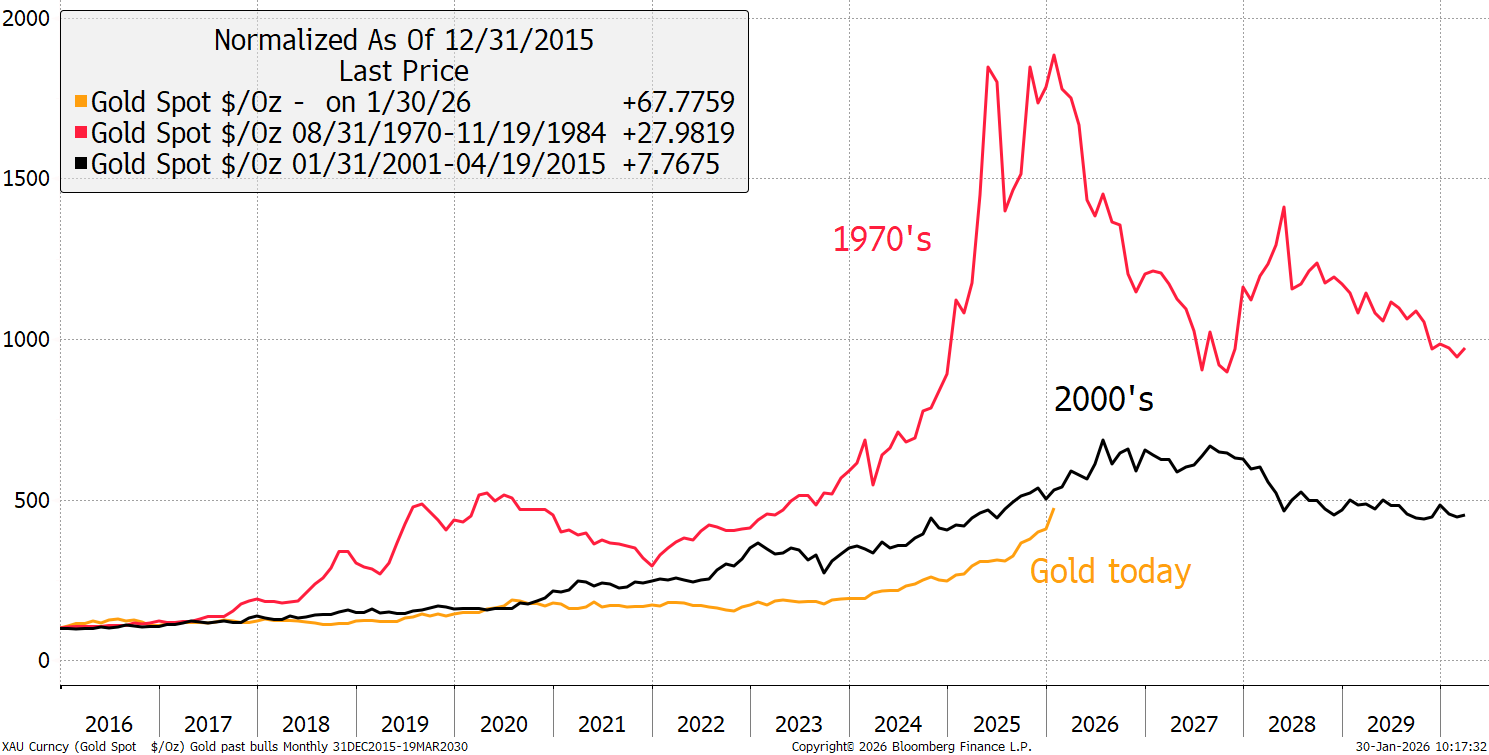
And let’s face it, this gold bull market might feel like rocket fuel, but it has still lagged the other two witnessed in living memory. Maybe 10 years is enough time, but the previous rallies have done much more.
Past Gold Bull Markets
You could also add another $5 billion of gold demand from gold tokens where Tether Gold (XAUt) holds $2.4 billion, and PAX Gold (PAXG), $2.2 billion. There are many other gold token projects, which are becoming notable. Then there’s Tether’s own reserves, which were reported to be growing at $1 billion per month and amount to $24 billion according to recent news stories. This is becoming increasingly important.
Bitcoin and Gold
Bitcoin is dead of course, yet somehow it is still the best performing asset in recent years, even after stripping out its bionic earlier years. Just as gold is the reserve asset of the real world, Bitcoin is the reserve asset for the digital world. These are fundamental differences.
Bitcoin Maxis make the same end of the world arguments as the gold bugs, expecting Bitcoin to respond in a similar way. It never has and never will. Bitcoin is closely linked with the tech sector, which is under pressure.
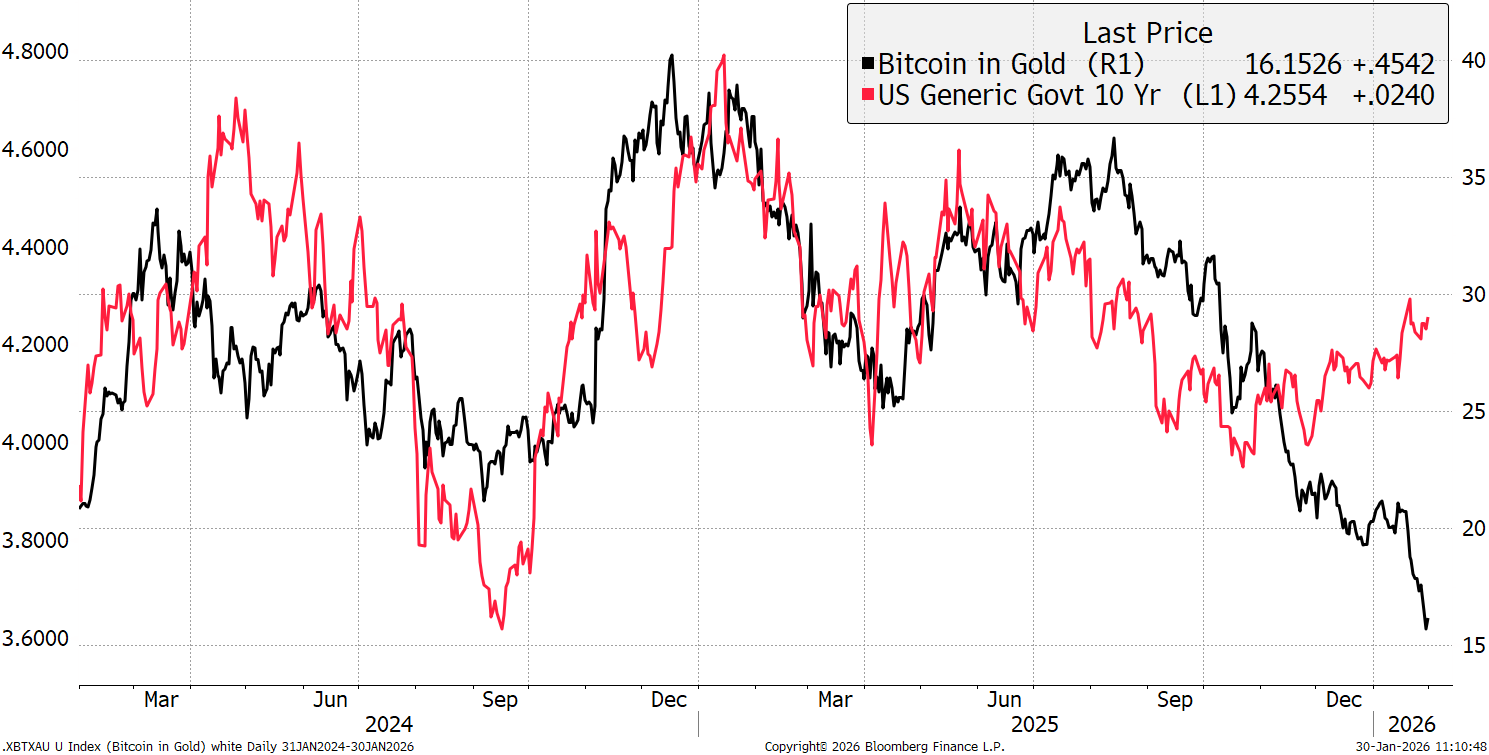
When bond yields spike higher, probably accompanied by rising inflation expectations. I would reasonably expect Bitcoin to once again start to outperform gold.
Bitcoin in Gold and the 10-Year Yield
Curiously, Bitcoin and gold have enjoyed similar returns since the 2017 Bitcoin peak. Somehow, ByteTree’s BOLD Index seems to get the best out of both assets and is 200% ahead of the average. Who said there’s no such thing as alchemy?
Bitcoin, Gold, BOLD, and Global Equities
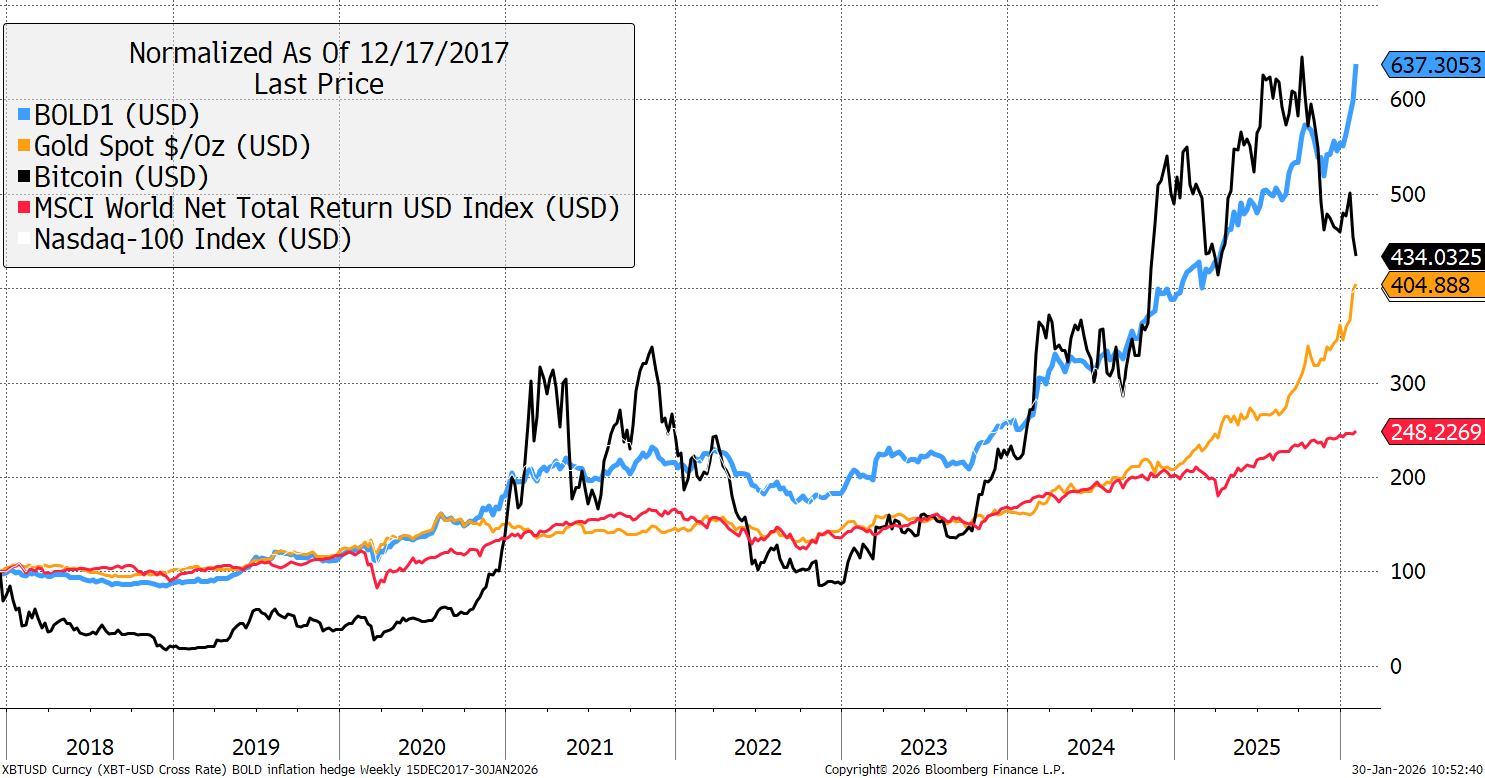
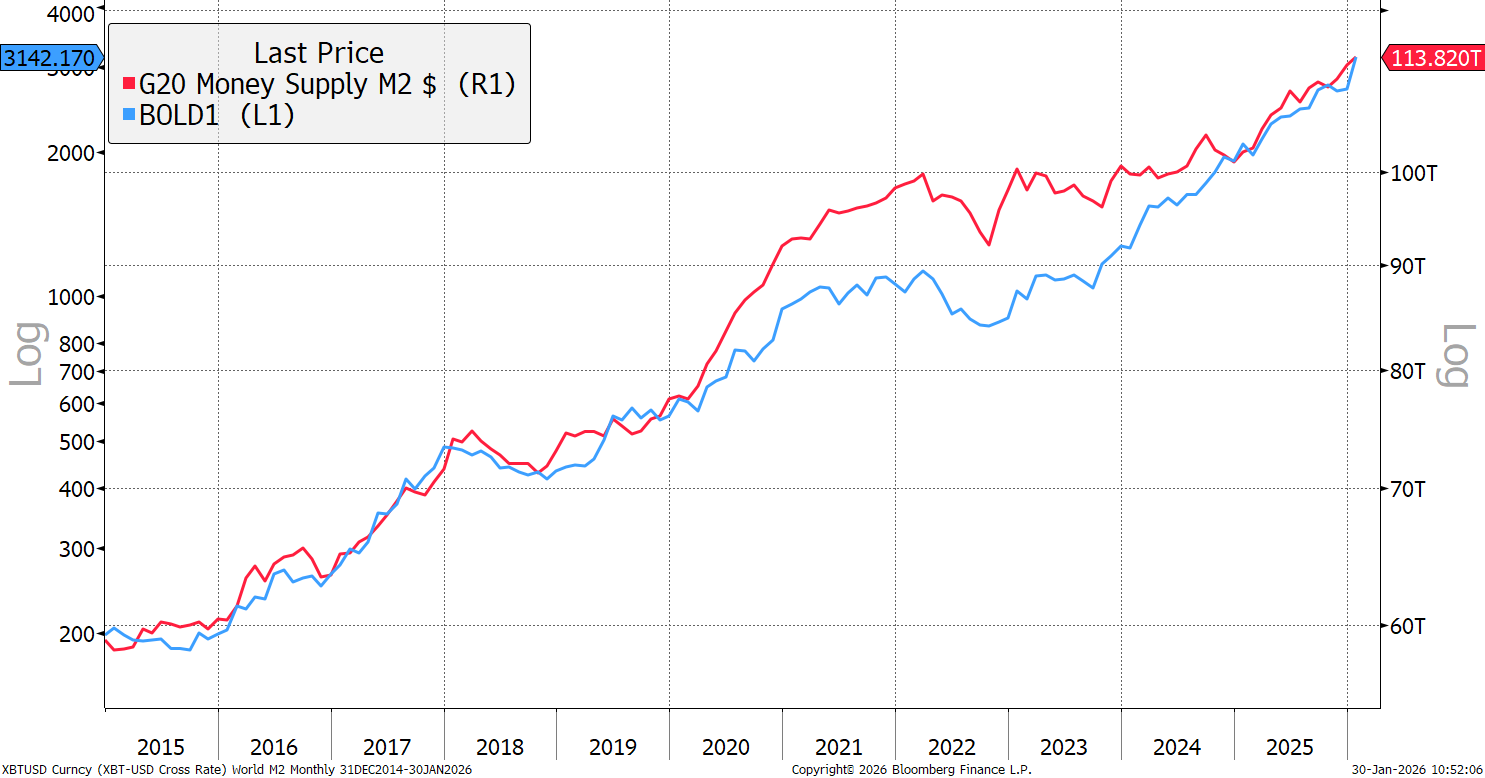
The best bit is that Bitcoin and gold, risk-weighted (roughly one third, two thirds respectively), have this remarkably close correlation with the global money supply. That has nearly doubled over the past decade, while BOLD has returned multiples of that. A gold to BOLD switch makes good sense up here.
BOLD and the Money Supply
The 21Shares Bitcoin and Gold ETP (ticker: BOLD) now trades on the London Stock Exchange. It is also listed in Switzerland, Germany, France, the Netherlands and Sweden. In all cases, the ticker is BOLD.
Summary
Gold is in a crazy place, and the past 24 hours is one of the inevitable tests we have to endure from time to time. If gold is in a bubble, it will crash back down to $2,000 or $3,000. If it’s not, which is my view, it will stabilise and maintain these high prices in a generational revaluation as gold has become relevant again. No one told the non-OECD central banks to buy gold. They figured it out all by themselves.
The trouble with selling gold is that there aren’t many things you want to swap it for. That’s why I created BOLD.
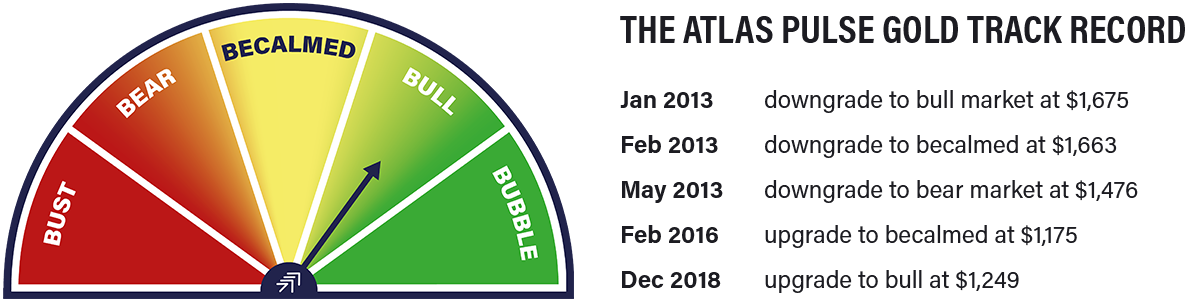
Thank you for reading Atlas Pulse. The Gold Dial remains on Bull Market.
Charlie Morris is the Founder and Editor of the Atlas Pulse Gold Report, established in 2012. His pioneering gold valuation model, developed in 2012, was published by the London Bullion Market Association (LBMA) and the World Gold Council (WGC). It is widely regarded as a major contribution to understanding the behaviour of the gold price.
Please email charlie.morris@bytetree.com with your thoughts.