
Gold’s 43% IRR

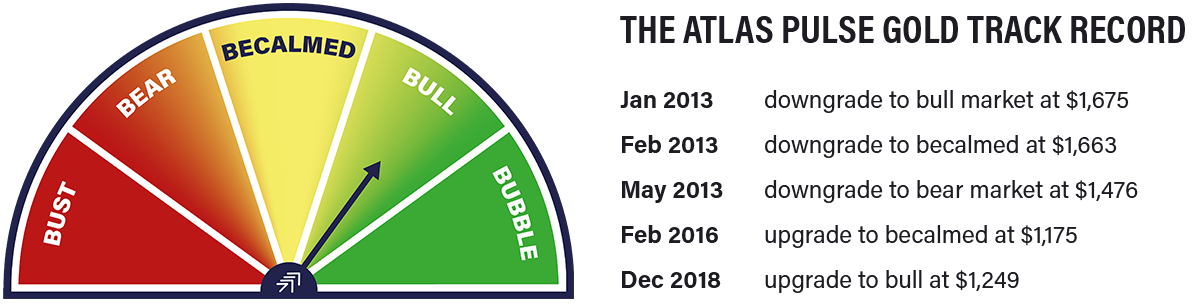
Atlas Pulse Gold Report Issue 108;
Gold remains overbought, and a consolidation would be the best outcome we can hope for. The best bull markets are long-lasting.
The great crash in the gold price didn’t last long. My last issue of Atlas Pulse was written on 8th October, when gold closed at $4,042. My caution was that the price of gold was 25% above its 200-day moving average, which was extended. By the 20th of October, the price closed at $4,356, which was 33% above the trend. That’s a big number, and a correction promptly ensued.
Gold Price Deviation from Trend
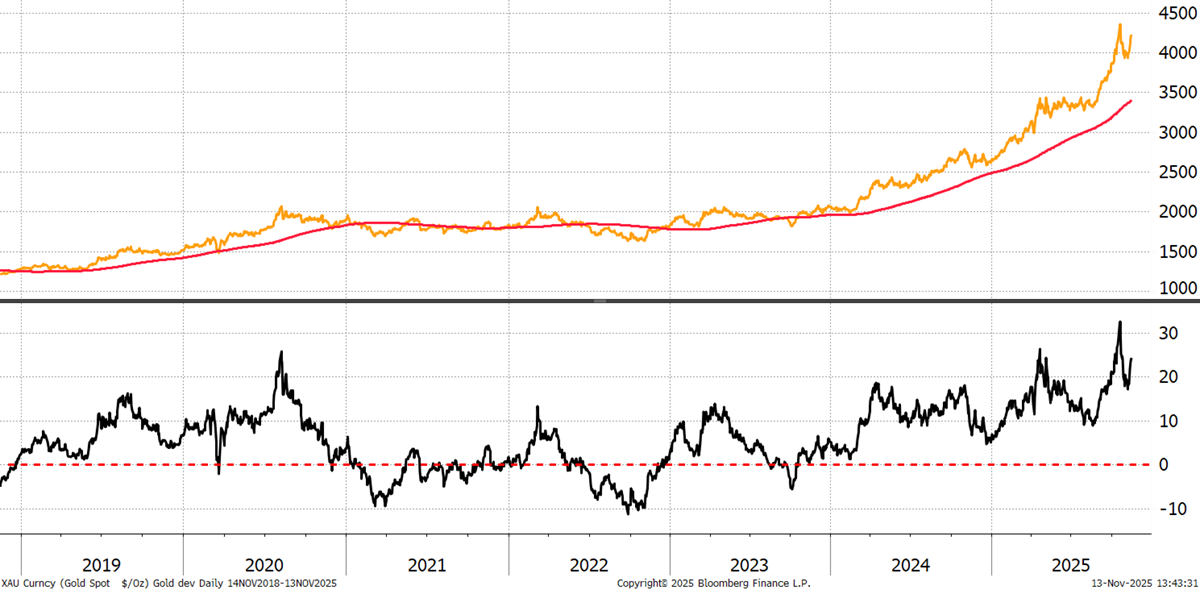
Remarkably, that correction turned out to be mild, with the gold price falling by just 10%. Still, the price of gold remains 25% above trend, which is elevated.
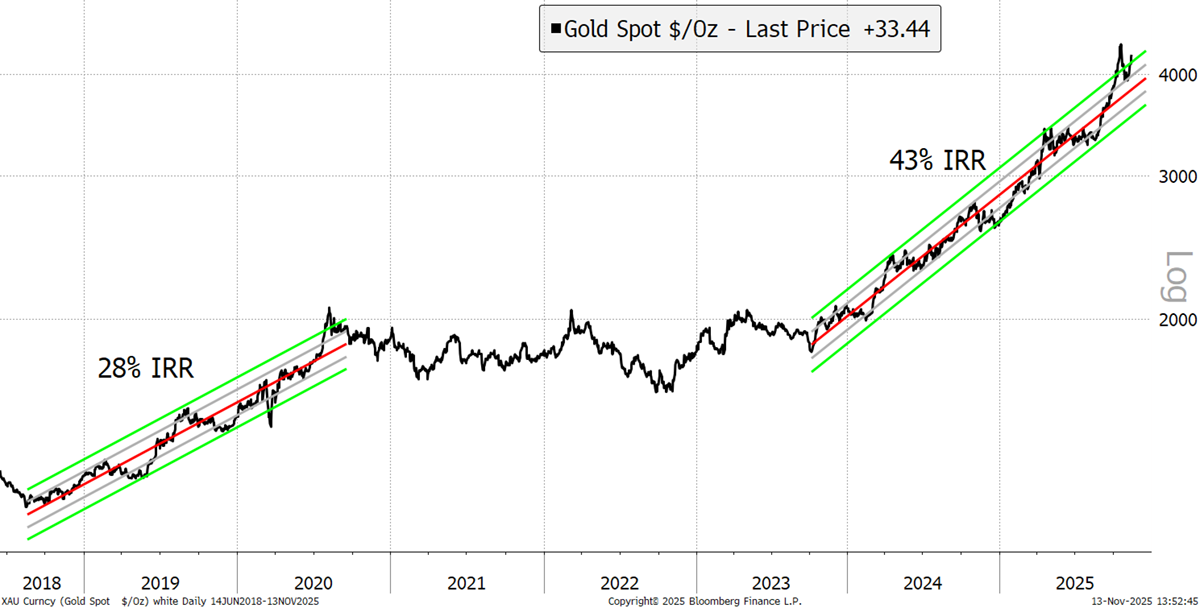
There’s also the trend itself to consider. The post-2023 rally has been rising at an annualised rate (or internal rate of return, IRR) of 43%, which is explosive. Compare that to the 2018 to 2020 rally, which was a more modest 28%. Yet see how in 2020, the final high jumped out of the range before reversing, which we’ll call a blow-off top. That just happened again last month.
Gold Historical Rates of Return – Since 2018
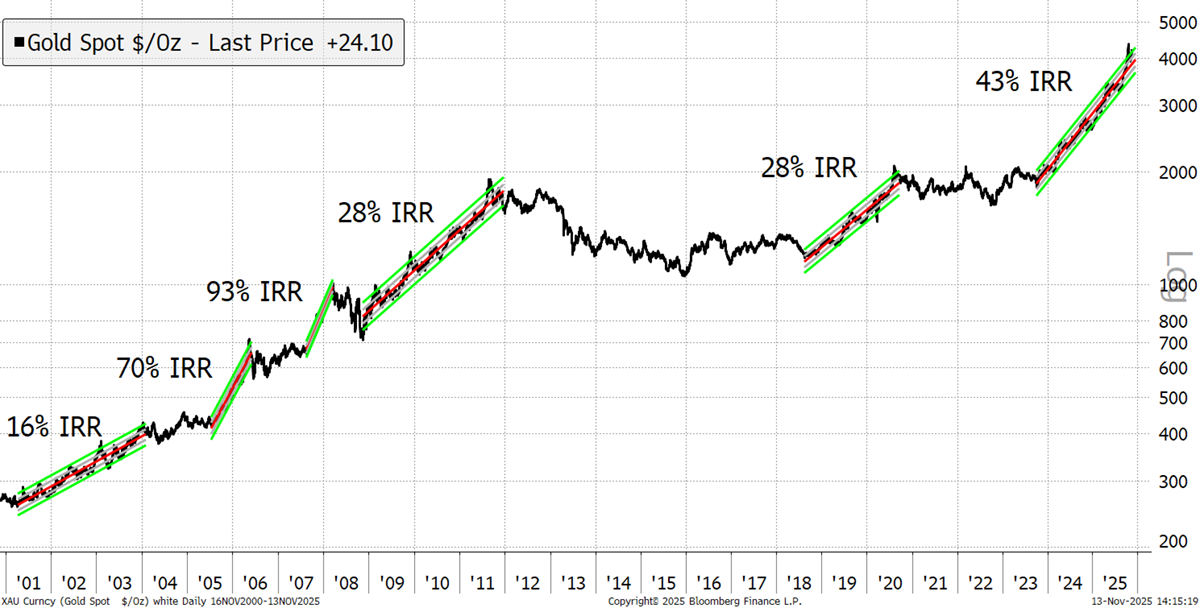
Bringing in the key gold rallies pre-2011, the initial one from 2001 to 2003 ascended at 16%. Then, 2005/6 saw a brief surge with a 70% IRR trend. The price consolidated for 18 months before sprinting at a 93% pace into early 2008. A brief crash followed during the financial crisis, before a 28% IRR move into the 2011 peak at $1,911. They all seemed to have blow-off tops to some degree or another.
Gold Historical Rates of Return in the 21st Century
But what about the 1970s?
