
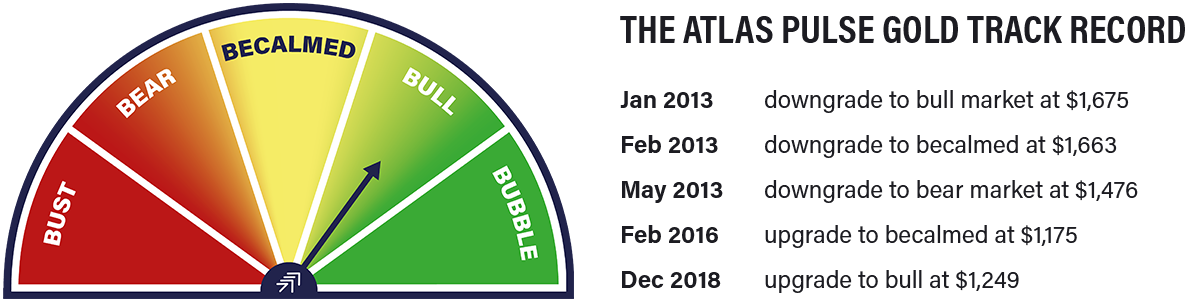
When to Sell Your Gold?

Atlas Pulse Gold Report Issue 107;
This gold bull market is about price, rather than excessive speculation. The market is hot, but it’s not red hot. For that, I would need to see significant buying in the gold ETFs, which have been modest so far, and more long positions in the futures market. The number of ounces held by investors and speculators is just over 120 million. Does that look like a bubble?
Gold breaks $4,000 for the first time in history, and investors take sides. On the one side, it’s the debasement trade, and on the other, a barbarous relic continuing its 6,000-year bubble. No doubt gold is hot, but that doesn’t mean a crash is coming. Indeed, whatever the final high turns out to be, pullbacks will be inevitable along the way.
The tactical investor should be glued to this chart. It measures the pace of the gold rally against its 200-day moving average. Today, that is 25%, which is slightly below the levels seen at the peaks in 2011 and 2020.
Gold and the 200-Day Moving Average since 2006
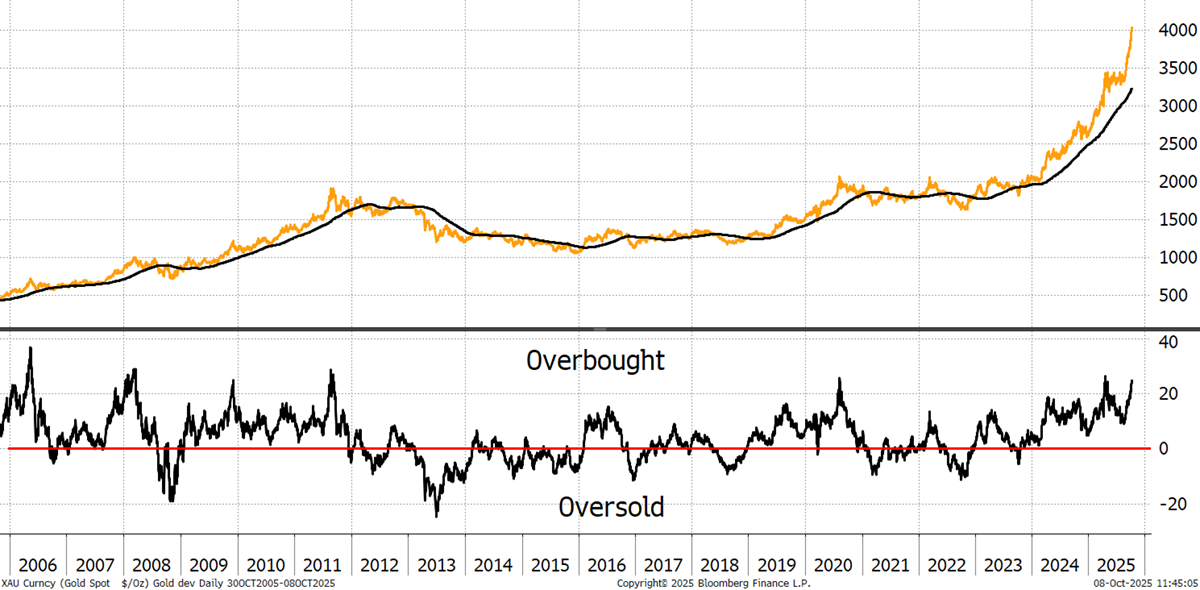
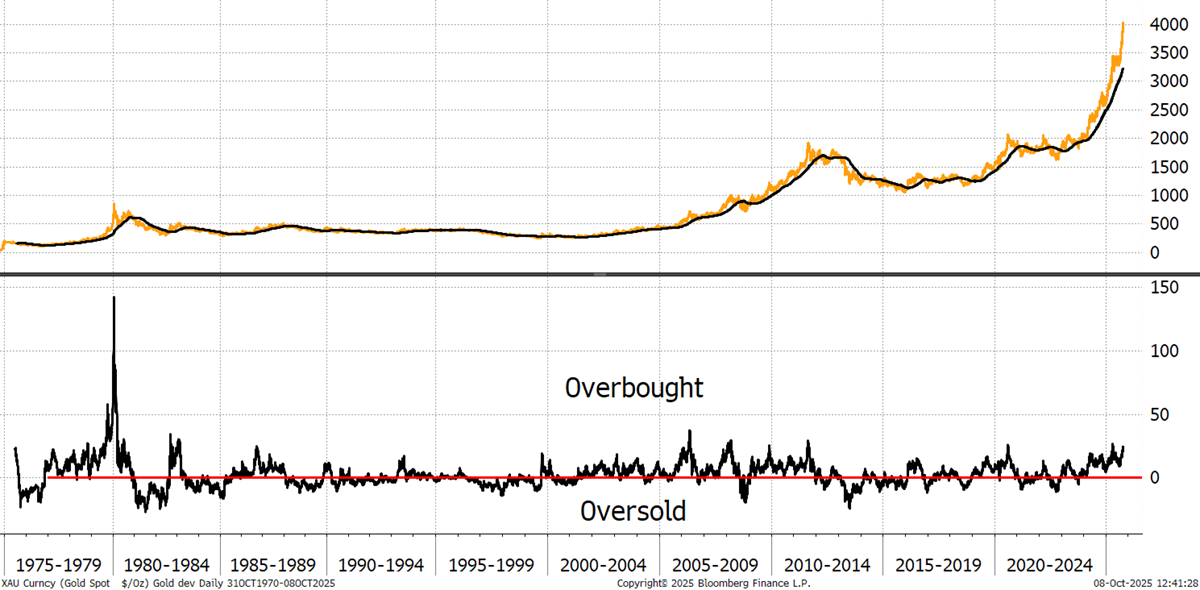
Then again, I remind investors that in 1979, that number reached 150%, which turned out to be a bubble, and didn’t see the next new high for 27 years. It is a reminder that no indicator is infallible, and the recent reading may simply be a pause like we saw in 2006 or 2008 during a healthy bull market.
Gold and the 200-Day Moving Average since 1975
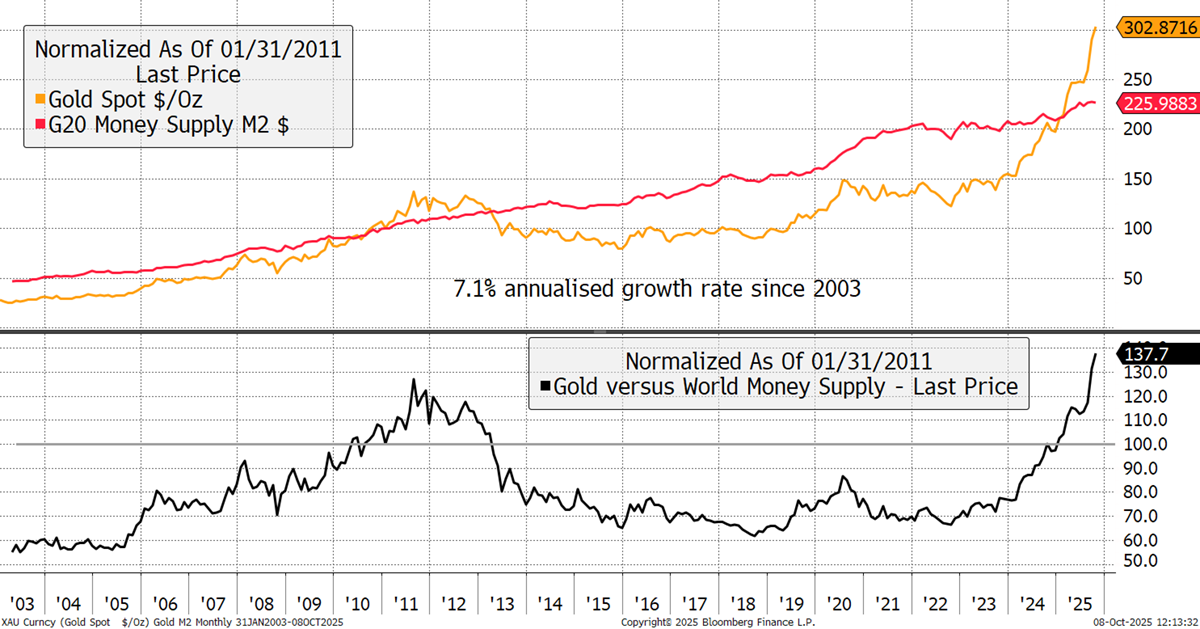
Of course, this time is different, as it always is, even though for the cynics, it’s always the same. The G20 money supply continues to grow, and the gold price is now 38% above average. It is also above the 20% reading in 2011, which most would agree was a bubble.
Gold and the Money Supply
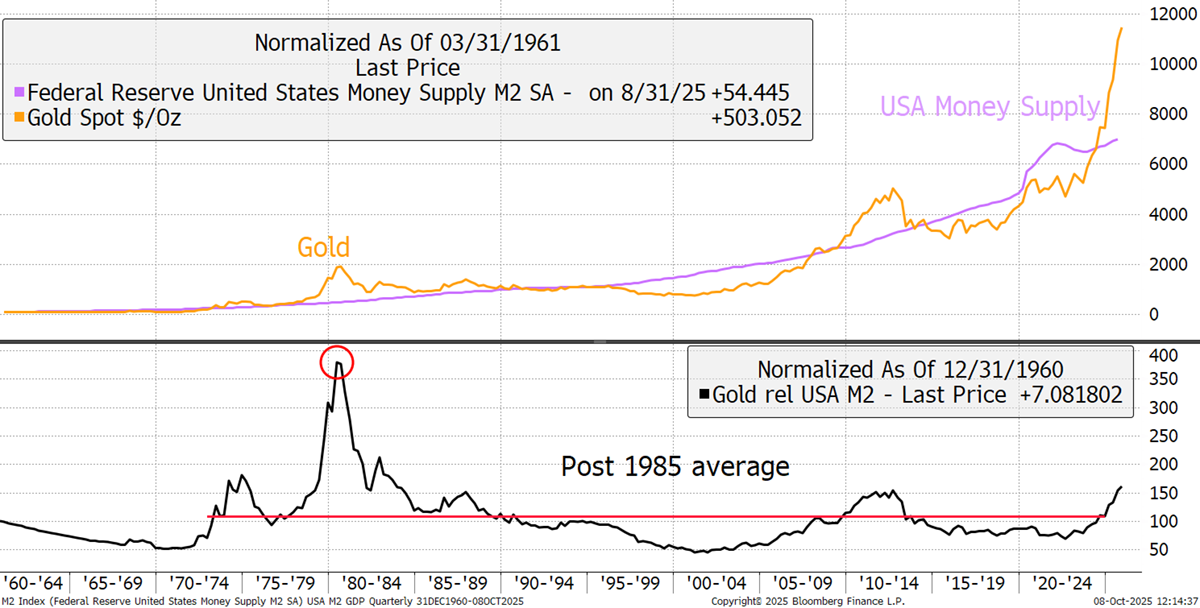
But what’s 20 years of data when it comes to the gold price? We really need 6,000 years of data to make sense of it, but no one seems to have written it down. Using 85 years gives us another angle, but only with the US money supply data. On this basis, gold is 50% above the average, having been 350% ahead in 1979. If this gold bull market really is about debasement, we are a long way from the top.
Gold and the US Money Supply since 1960
Moreover, under the debasement scenario, we are yet to see a surge in the money supply, which gold is presumably forecasting, just as it did in 2020. However, it’s not just the money supply; we should also factor in structural unfunded government deficits, and gold doesn’t like what it sees. More accurately, perhaps, investors are concerned that there is no way out of this fiscal mess, and they see gold as a lifeboat.
I used to publish the total value of the gold ETFs as a percentage of all ETFs. Yet they have ballooned much faster than the market cap, and I believe they are no longer a useful measure. Here, I show the gold ETFs by value as a percentage of the global equity market cap, which stands at 2.9%, or half of a NVIDIA. This is back to the peak levels seen in 2011, which should ring alarm bells.
