

Atlas Pulse Gold Report Issue 93;
The miners are in a good place because they are yet to be rerated in acknowledgement of a sustained gold bull market. They are companies with very high operational gearing, which means they have high fixed costs. As the rising gold price exceeds those costs, the profits surge.
Highlights
| Gazumped | $8,000 by 2030 |
| Beating Gold | Miners Over Silver |
| Gold Miners | What Drives the Gold Miners? |
| ETFs and Flows | They Don’t Believe It |
| BOLD | Higher Returns, Lower Volatility |
Gazumped
Gold is in a bull market, and I have just been gazumped by Jan Nieuwenhuijs of Gainesville Coins. He believes gold has started a multi-decade bull market, and the price will reach $8,000 by the end of the decade. His argument could be summarized as the world is awash with fiat money, and gold deserves a higher seat at the table. The savvy central banks wouldn’t be accumulating gold with such enthusiasm if that were not true.
My price target, set in 2020, was a mere $7,000 by 2030, so I’ll have to keep up! My argument drew a similar conclusion to Jan’s but got there in a different way. My thesis is that inflation will be structurally higher, and when the bond market acknowledges this, with a surge in TIPS over conventional bonds, gold will become the must-own asset.
Last month, I suggested that if you strip the duration out of gold (gold in 20-year bonds), you end up with a directional trend which differentiates between periods of inflation and disinflation. With persistent regimes, it couldn’t be clearer, and gold is telling us to expect a prolonged period of stubborn inflation.
Gold in Bonds
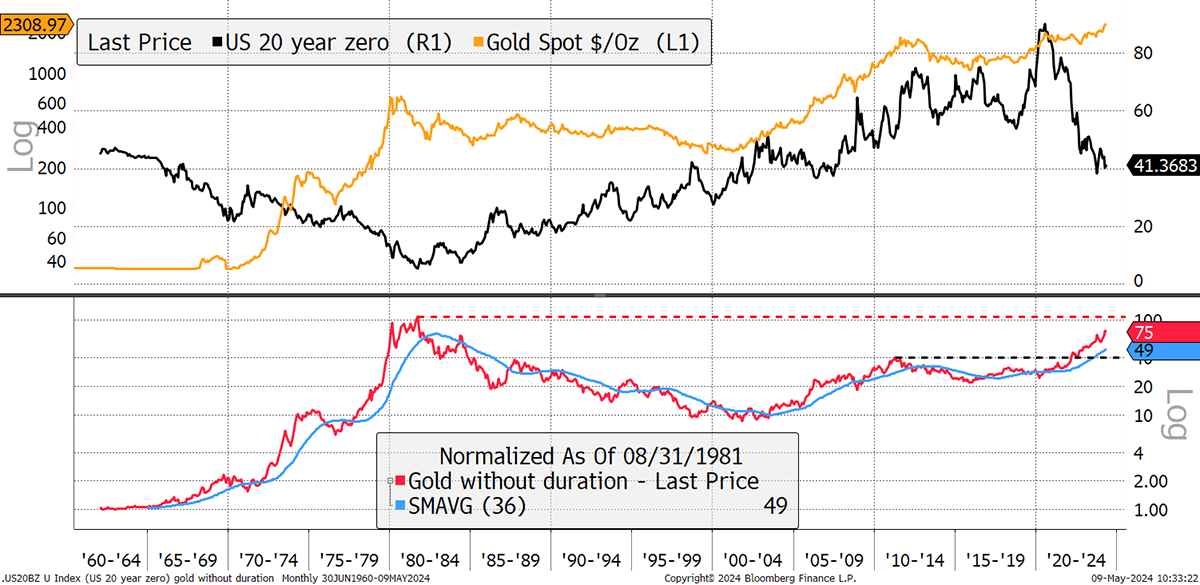
Gold in bonds is closing in on the 1980 all-time high (red dashed line). It tells us that:
- 1970s inflation was high and came in two waves.
- 1980s disinflation that began in 1982.
- 1990s disinflation with a failed reversal in 1995.
- 2000s inflation turned up in 2002.
- 2010s disinflation following the 2011 peak.
- 2020s inflation has taken out the 2011 high and heading for the 1982 high.
Even with interest rates high, by recent standards, inflation is falling but only slowly. Commodity prices remain firm, and when the rate cuts kick off, the fire will be restoked quite quickly. Inflation comes in waves and is driven by events.
Miners Over Silver
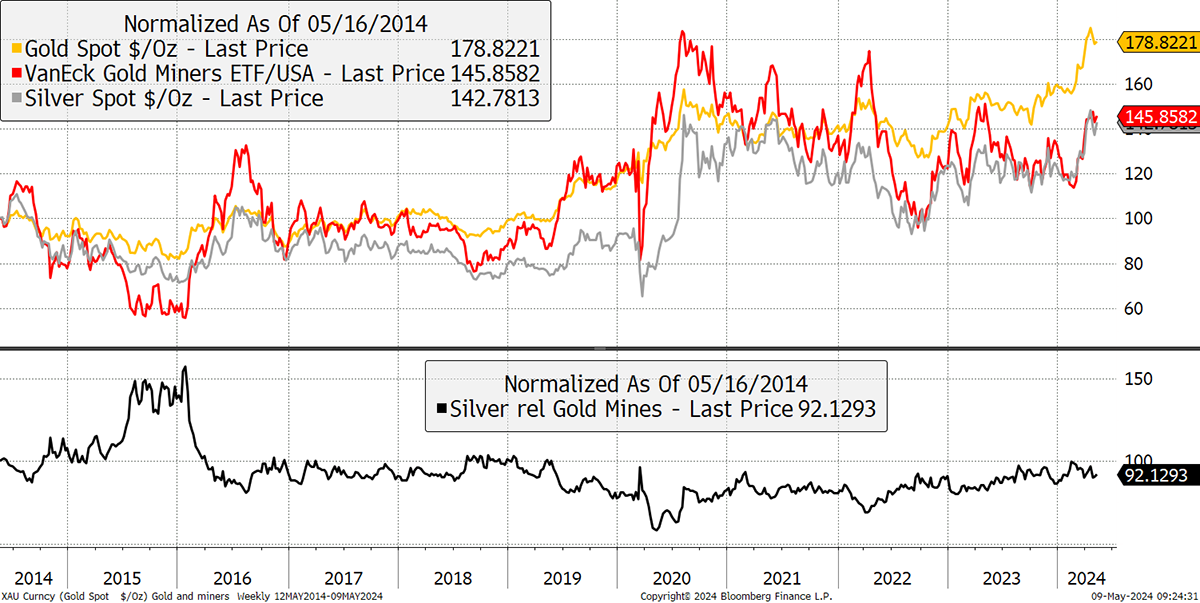
It is all good news for gold, and I remind you that in gold bull markets, it is reasonable to expect the miners to outperform silver. Both assets offer good value, but silver has massively outperformed since the 2020 low.
Gold, Silver and the Miners
The miners are in a good place because they are yet to be rerated in acknowledgement of a sustained gold bull market. They are companies with very high operational gearing, which means they have high fixed costs. As the rising gold price exceeds those costs, the profits surge.
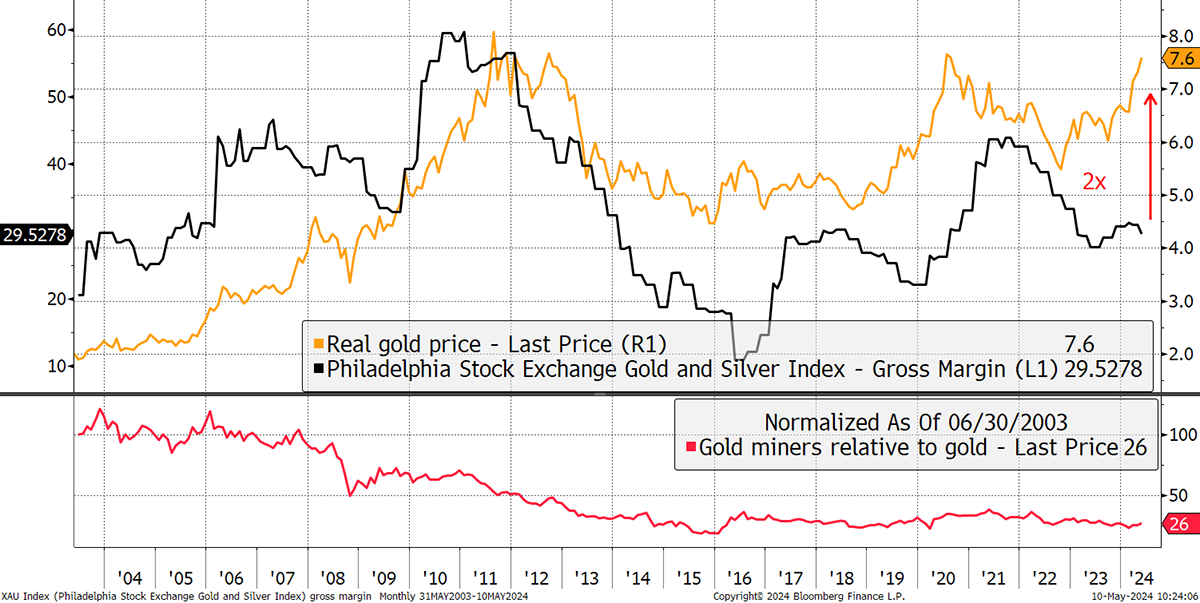
Gross margins were 20% in 2003 when the real gold price (gold less inflation) was relatively low. It trebled to 60% as the real gold price quadrupled, only to slump back to 10% in the 2011 to 2015 gold bear market. The real gold price is close to an all-time high, yet margins are still only 30%. As the price climbs further, which it is very likely to do, expect to see those margins expand back towards 60%. They also have high sunk costs, which reminds us how it takes time and money to develop a productive mine.
Gold Miners’ Gross Margins Have Room to Double
Gold stocks are no different from other stocks in that their share price reflects the current and future profits from their business. The market doesn’t discriminate much, and because it has become so cynical, it will heavily undervalue the assets compared to the cashflows. It’s a “show me the money” situation.
The same is true in reverse. When the profits roll in from higher gold prices, the markets will assume those profits will continue indefinitely, and the assets will be revalued higher. The market will quickly forget that gold prices can also go down, and it will see the gold miners through rose-tinted glasses.
What Drives the Gold Miners?
With increasing talk of the impending good fortune, I wanted to look at the gold miners and what drives them. I have chosen the stocks held by the $13 billion VanEck Gold Miners ETF (GDX), which incidentally has seen zero inflows in seven years. The chart shows the US dollar performance of the miners held by GDX, with the gold price (gold) and the GDX gold miners Index (red).
Inside GDX
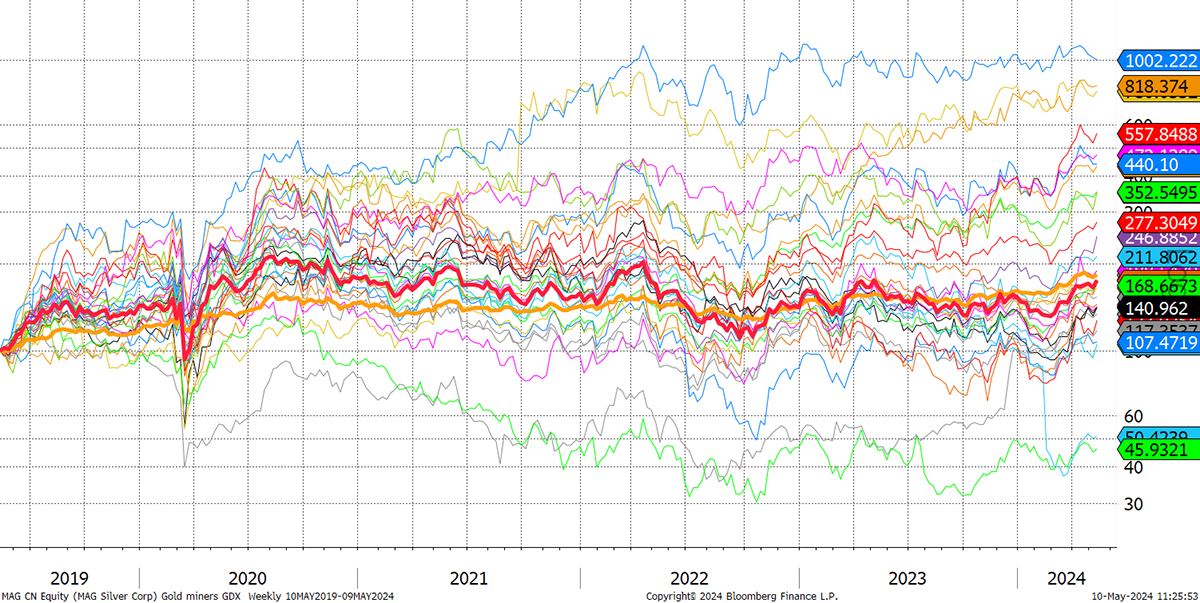
It’s a scattered affair, with the best stock being Capricorn Metals (CMM AU), and the worst, Regis Resources (RRL AU), which are 17x apart. CMM saw production take off in 2022, which explains the strength. In contrast, RRL hasn’t done badly in terms of revenue, but the shares have been derated, and it is out of favour with analysts’ forecasts, as operating and CAPEX costs have surged.
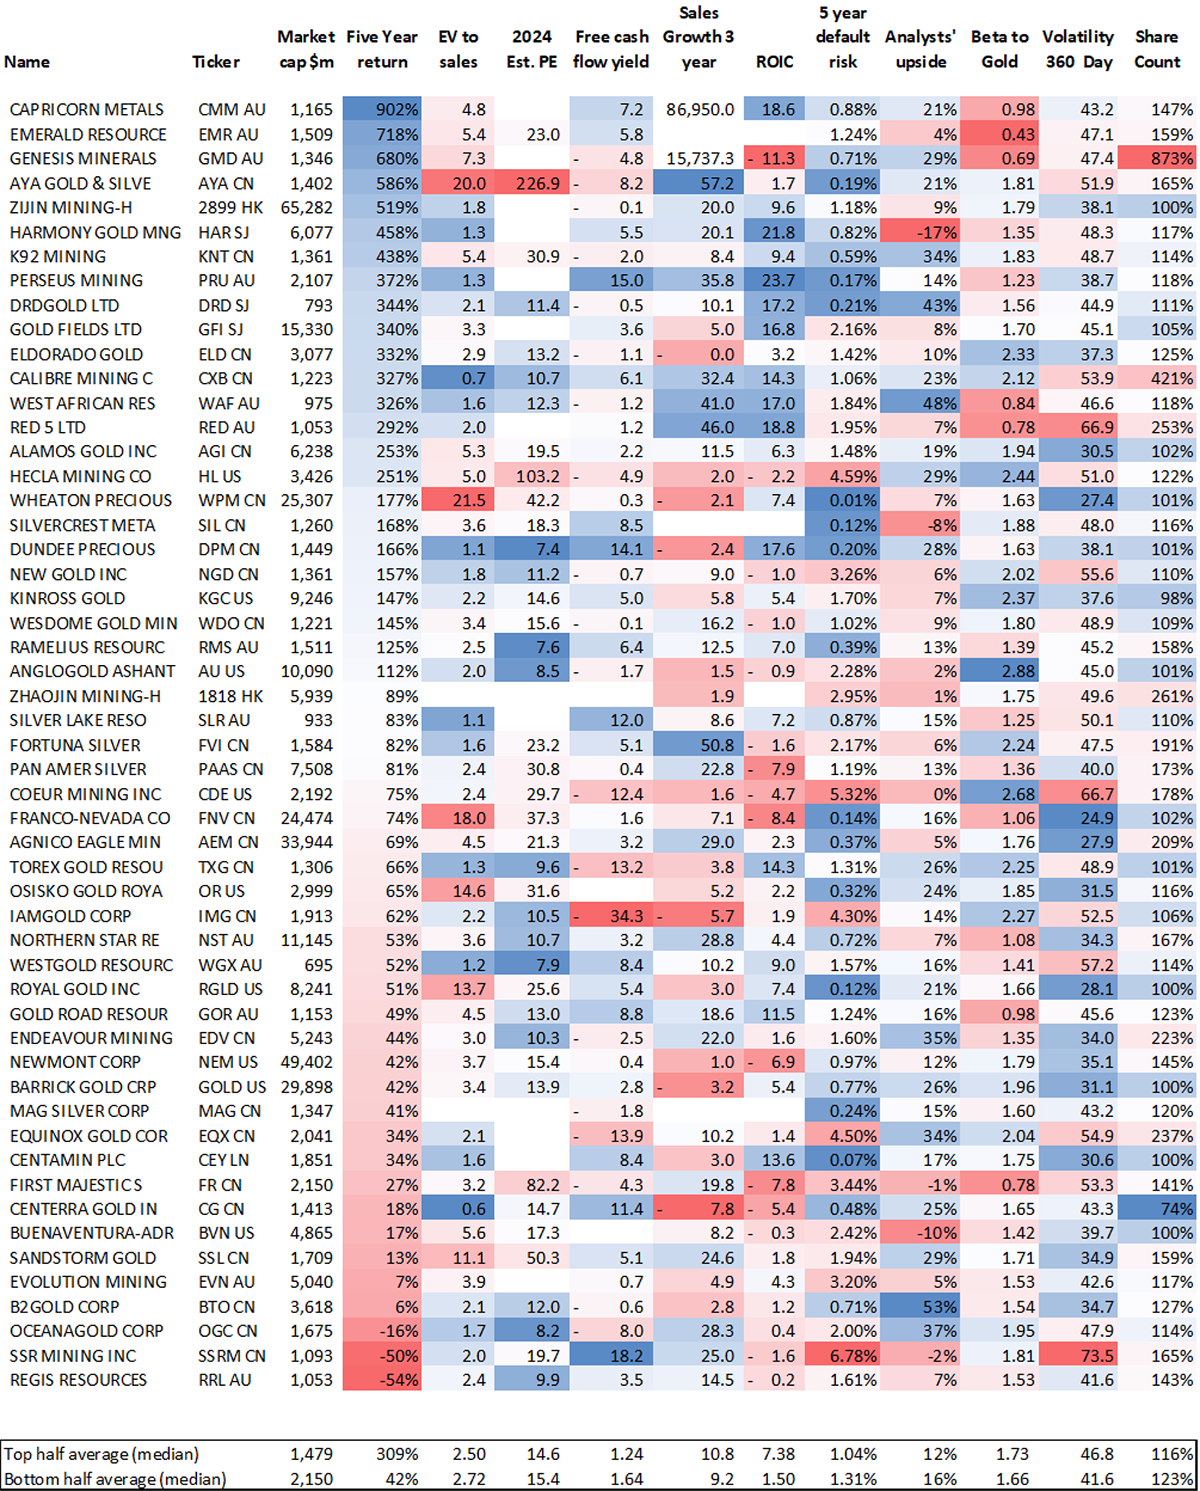
There are many other things we could look at to assess gold stocks. I have taken the 53 constituents of GDX and had a look at some metrics I believe are important. In addition, I have calculated the averages (median) for the top and bottom halves by five-year performance.
Gold Miners Held in GDX
The columns include:
- Market cap in US dollars. The best-performing half had a median market cap of $1,479 compared to the lower half with $2,150. Smaller tends to be better.
- Enterprise value to sales (EV to Sales), which is the company’s valuation after considering cash held and financing. (A billion-dollar business holding a billion dollars of cash is worth $2 billion, in contrast to a billion-dollar business with a billion dollars of debt, which is worth zero). The top half had a lower EV/sales (2.5x) than the bottom half (2.7x).
- 2024 price to earnings ratio (PE). The top half had a lower PE (14.6x) than the bottom half (15.4x), but the difference is slight.
- Free cashflow yield is the cash generated by the company as a percentage of the market cap. Gold miners are not very good at generating cashflow, but will be at higher gold prices. The best half had a lower free cashflow yield (1.24%) than the worst half (1.64%). I assume this means the companies investing in production beat those that don’t.
- Three-year sales growth, which is determined by the increase in the amount of gold mined. The best half grew faster (10.8%) than the worst half (9.2%), which supports the previous point.
- Return on invested capital (ROIC) measures the efficiency of capital expenditure, i.e. the amount they make from investments in their operations. The difference was striking with the winners (7.38x%) against the losers (1.50%). The market clearly rewards the efficient use of capital.
- The 5-year default risk is the likelihood of the company going bust. It measures the strength of the balance sheet and the lower the risk, the better. The stronger balance sheets were in the top half (1.04%) and the weaker in the bottom (1.31%), which is not surprising. But bear in mind that highly geared companies can outperform in a bull market because there is leverage, and the shift from distressed to safe is very profitable.
- Analysts' upside is the percentage move required to meet the analysts’ consensus share price forecast. Their top picks are B2Gold, West African Resources, and DRD Gold, or “Durban Deep” or “DROOY” by nickname, as it was always renowned for being one to own in a bull market. According to the analysts, the best stocks have 12% upside, and the weaker ones have 16%. This is unsurprising because the best stocks have arrived while the worst are patiently waiting.
- Beta to Gold is the sensitivity of the share price to the gold price. Interestingly, Emerald Resources came in second place with a beta of just 0.43, implying it is not particularly sensitive to the gold price at all. In that case, production growth has been a more important factor. That said, it was an exception because the best half had a higher beta (1.73) than the bottom half (1.66).
- Volatility 360-Day is a measure of share price movements. Gold has a volatility of 13.4%, which is low. The least volatile gold stock is Franco Nevada (24.9%), which is a royalty company rather than a miner. This is the least risky business model in the gold business, as they are a lender rather than an operator. It is also debt-free. The most volatile gold miner is SSR Mining (73.5%), which has debt and has seen a fall in production. Volatility is effective in reflecting certainty, i.e. royalty companies, and uncertainty, i.e. exploration. The top half had higher volatility (46.8%) compared to the bottom half (41.6%). That implies riskier stocks have been rewarded over the past five years compared to safer stocks because it’s a bull market.
- Share Count is the number of shares in issue. If it is 100%, the share capital has remained the same over 10 years. If it is 200%, it has doubled through capital raising. If it is 50%, the company has bought back half of its shares from shareholders. The best half (116%) raised less capital than the bottom half (123%). Once again, the market rewards companies with good capital management.
If we screen for the best metrics, we end up with DROOY, Calibre, and Centamin. The worst? Hecla, AngloGold Ashanti, and Coeur. We will revisit this at a later date, and in the meantime, don’t shoot the messenger.
Other factors gold mining investors might consider are reserves, operations, and political risk. These are more qualitative than quantitative, but it is remarkable how much information is available that can help investors make better decisions.
In ByteTree’s Soda Portfolio, which is low to medium risk, we hold gold bullion. In the medium-risk Whisky Portfolio, we hold the gold miners ETF along with silver bullion. In the Venture Portfolio, which picks stocks from around the world, we hold three miners including Centamin, mentioned above, which is reassuring. The way I have chosen to hold precious metals differs according to the risk. I believe this is an important consideration for investors.
Gold Flows
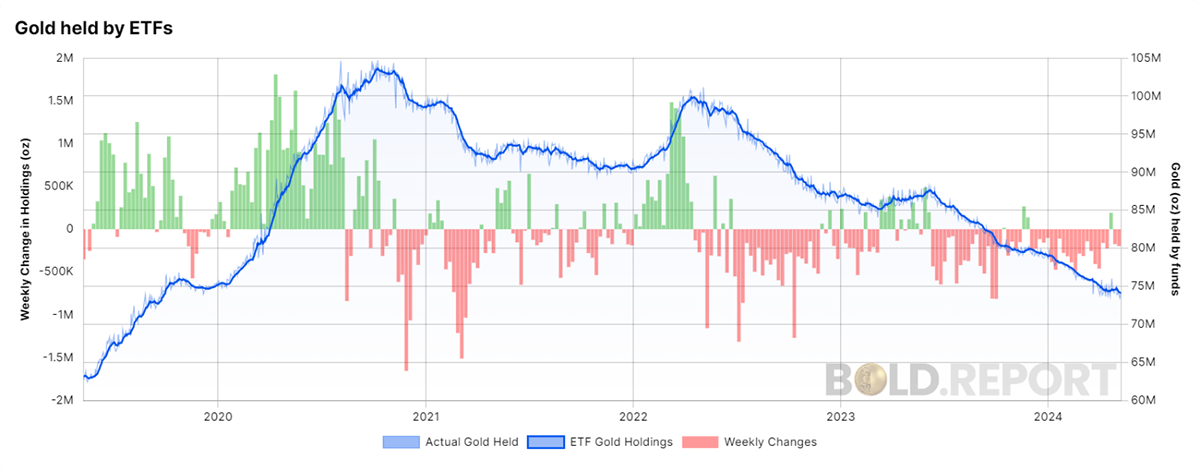
It is remarkable that we are still seeing outflows from the gold ETFs. They have slowed, as you can see in the bars, but given the state of the world, it makes no sense. The heaviest outflows continue to come from the UK gold ETFs. My suspicion is that it comes from UK wealth management, who are selling because gold is not included in their investment benchmark and is therefore considered to be a business risk. If your wealth manager owns no gold, ask them why.
Gold Held by ETFs
Bitcoin and Gold
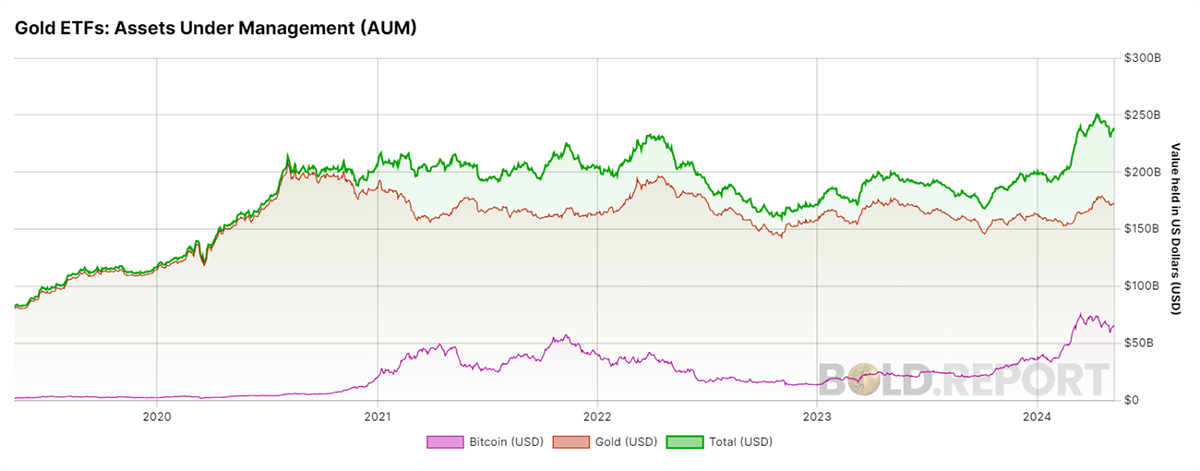
We have talked about gold, silver, and the miners, but we can no longer have this conversation without mentioning Bitcoin. Last week saw the launch of the Hong Kong Bitcoin ETFs, which brings the total Bitcoin held to over a million BTC, or 5% of the supply. In contrast, gold held by ETFs is roughly 1% of supply.
I like to see these together, and the total (green) is the real metric to follow. With $63 billion in Bitcoin ETFs and $172 billion in gold ETFs, the total in liquid alternative assets is $237 billion, which is an all-time high. It is my belief that these assets will take it in turn, but the combination will keep on growing.
Gold ETFs Assets Under Management (AUM)
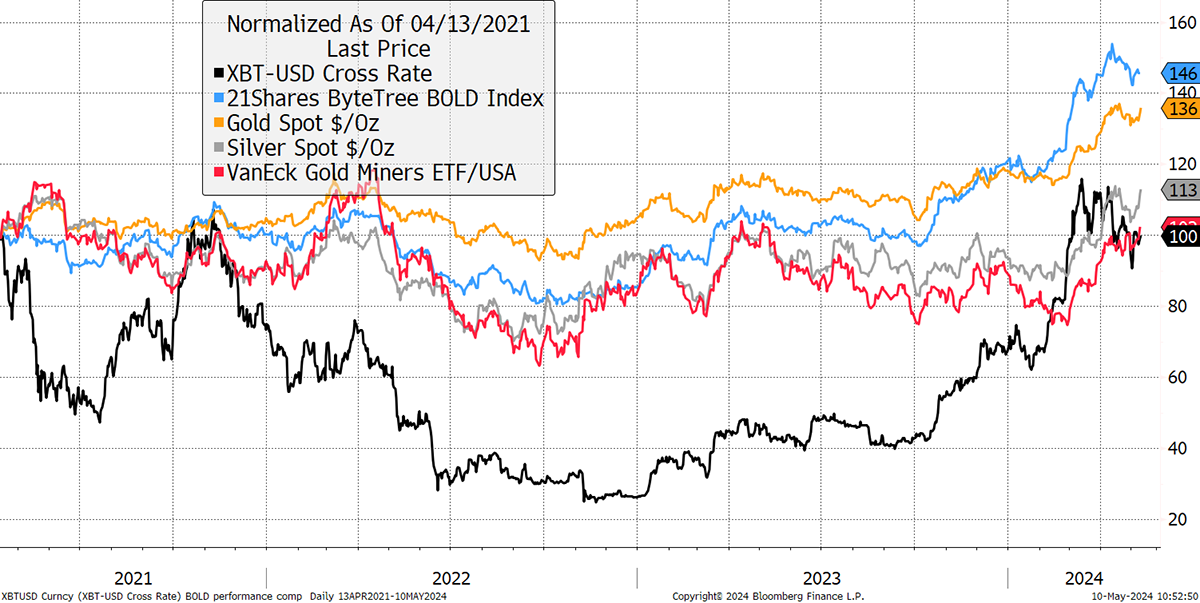
Looking at the liquid alternative assets together, it is surprising to see the gold miners, Bitcoin and silver in such a tight group since the April 2021 Bitcoin high. Gold has done better, but ByteTree’s BOLD Index leads the way with a 46% return, while Bitcoin was flat and gold returned 36%. Impossible, you might say, but no. BOLD uses monthly rebalancing transactions that boost returns by over 5% per year. That soon adds up.
Bitcoin, Gold and BOLD since the 2021 Bitcoin High
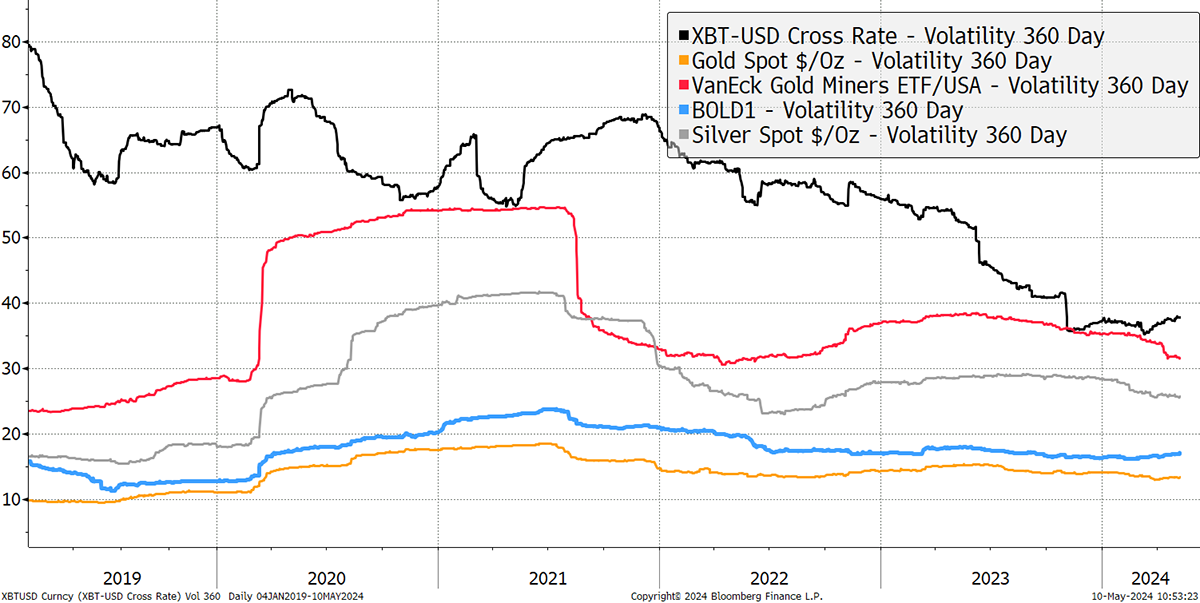
Looking at volatility, who knew that the gold miners were nearly as volatile as Bitcoin? Silver comes in lower, with BOLD’s volatility not much higher than gold’s.
Volatility of Liquid Alternative Assets
To learn more about the merits of rebalancing transactions between Bitcoin and Gold, see my report from last week.
Summary
In selecting gold stocks, production trumps everything in both bull and bear markets. But there’s one other metric I didn’t mention and that’s profit margin. There wasn’t room for another column, but I should mention the worst performer over the past five years is Regis Resources. Their gross margins collapsed to just 3.6%, which is diabolical. But if you believe the forecasts, these jump to 53% in 2025. Could the worst stock become the best stock? It’s happened many times before.
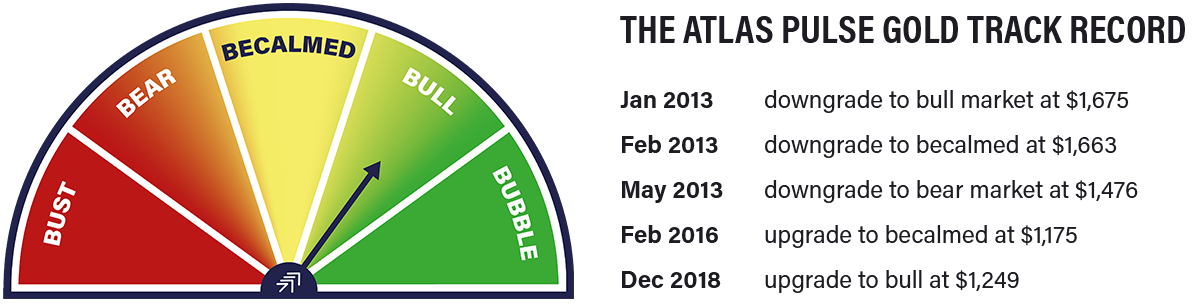
Thank you for reading Atlas Pulse. The Gold Dial Remains on Bull Market.
Charlie Morris is the Editor and Creator of the Atlas Pulse Gold Report, established in 2012. His pioneering gold valuation model, developed in 2012, was published by the London Mastels Bullion Association (LBMA) and the World Gold Council (WGC). It is widely regarded as a major contribution to understanding the behaviour of the gold price.
Please email charlie.morris@bytetree.com with your thoughts.
