

Atlas Pulse Gold Report Issue 92;
When gold can withstand rising interest rates, it tells us that other factors are more important. Inflation is not just about shifting currencies and prices; it is a new bout of monetary debasement, which we last saw in the 1970s.
Highlights
| Transitioning from Transitory | Inflation Returns |
| Gold without Duration | Strip Out the 20-year Bond |
| ETFs and Flows | Who’s Selling the Gold? |
| Gold Regime | The Bull Continues |
| BOLD | A Fine Year |
In recent months, Atlas Pulse has investigated the major shifts in the gold market. Traditional correlations have seemingly broken down as the world economy has structurally changed. The big question remains: why gold is deemed to be more valuable in the East than in the West? One reason is that Western investors are underplaying events and do not see inflation as a sustained threat. Yet, in the East, they believe the world is transitioning from transitory inflation, which means inflation sticks, and holding gold is the solution to the problem. I then ask: who is selling the gold?
From Transitory to Debasement
Inflation comes in different forms. Sometimes it reflects economic strength through high demand for goods and services. At other times, it reflects a lack of supply, as we saw during the pandemic. But these are cyclical forces that come and go, and the invisible hand of the market economy needs no help in returning prices back to normal levels.
Then you have debasement, which is not so much about the numerator but the denominator. It is less concerned with the supply and demand of goods than the purchasing power of money. When your currency is falling against other currencies, you pay more for imports than in countries enjoying currency strength. Hopefully, your currency weakness is temporary and perhaps appreciates back to where it came from. It's when it doesn’t that you have to worry about, and that is the debasement scenario. Your currency has lost value, and this type of inflation is much harder to fix. Consider buying a cappuccino before and after the pandemic. That increase in price is not temporary but permanent.
This week saw the latest US consumer price inflation (CPI) data, which rose. After the pandemic bottleneck, CPI came crashing down to 3% until last June before settling. The recent 3.5% print demonstrates that 9 months of relatively high interest rates have failed to see inflation return to the stated 2% target. I think gold saw this coming.
Different This Time
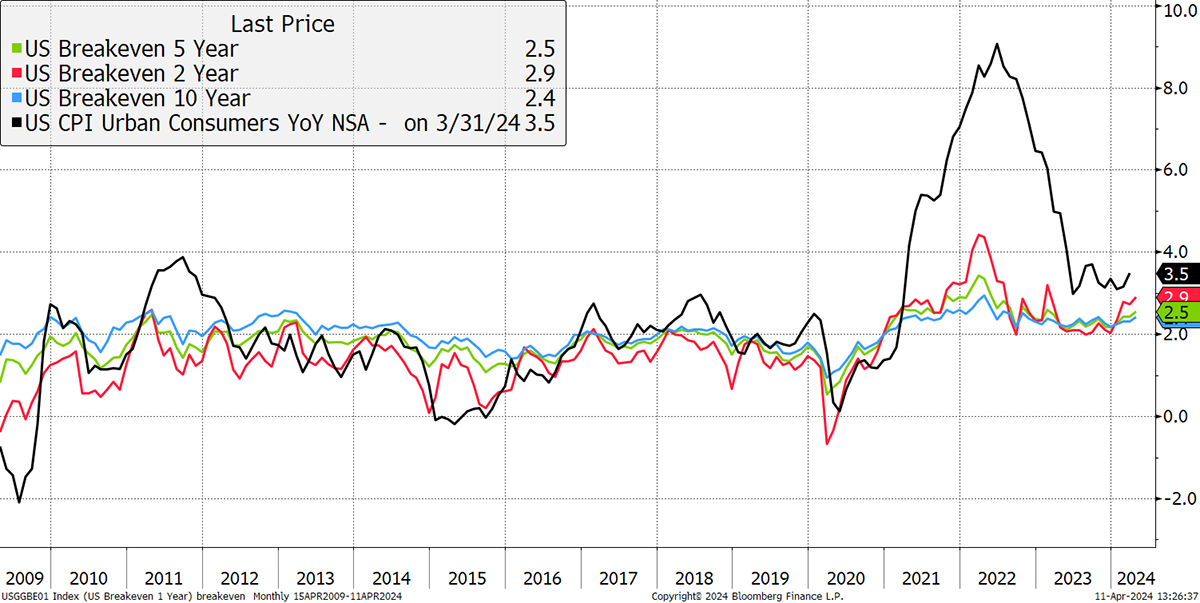
The CPI breakdown showed further rises in services (mainly wages) and has yet to register the recent increase in commodity prices, implying it will remain firm for the foreseeable future. More importantly for gold is that future inflation expectations have picked up again, as shown by the colourful lines above. They are rising again, which means the 2% CPI isn’t coming back anytime soon.
Higher inflation means higher rates, or at the very least, fewer and shallower cuts than the market was hoping for. If you asked an experienced financial professional what drives gold, two decades ago, the answer would have been inflation; a decade ago, it would be interest rates; today, it would be real interest rates (interest rates less inflation). It’s funny that as soon as a consensus has entered mainstream thinking, the goalposts shift.
Most investors believe that higher interest rates lead to lower asset prices, and that’s generally true because if it costs more to borrow, investors have less money to buy assets. It struck me that if you removed rates from gold, the picture would change. Years ago, I suggested that if gold was a bond, it would have a 20-year duration (time to maturity of the equivalent bond) because there was a price volatility match. In other words, gold is too volatile to mimic a 10-year bond and too stable for a 30-year bond, making 20 years about right. If we strip out a synthetic 20-year bond from the price of gold (i.e. gold / 20-year bond), you end up with the lower red line.
Gold Without Duration
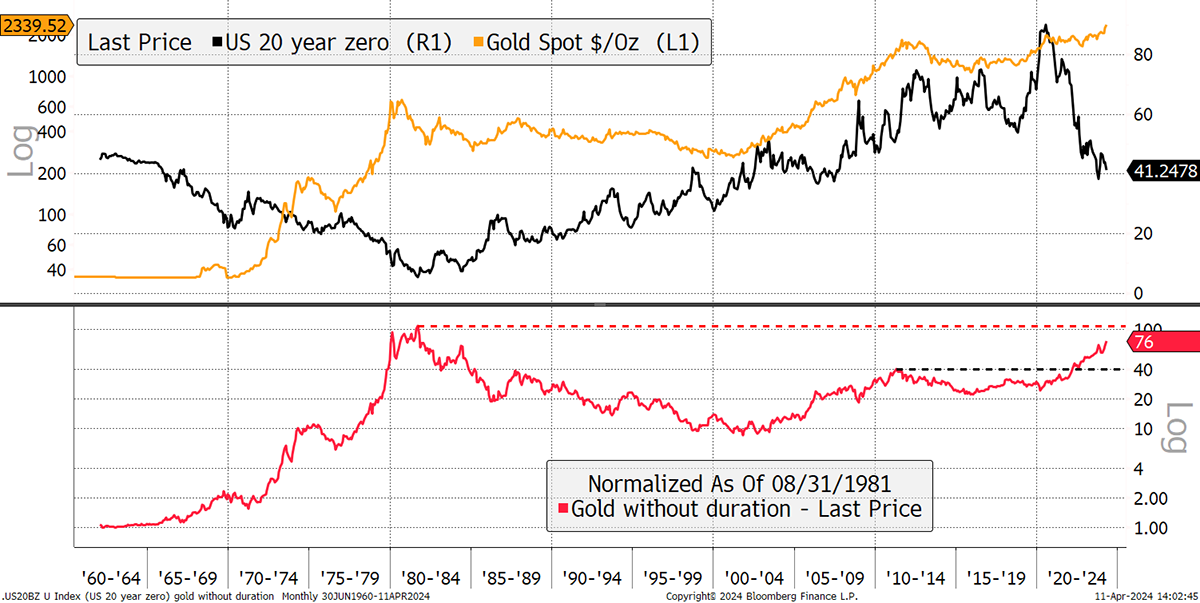
Please take a moment to examine gold without duration (GWD), which is the gold price unencumbered by man-made interest rates. It rose 100-fold between the 1960s and 1981. It then fell 90% over the next two decades. Since 2000, it has risen by 7.6x and is close to making an all-time high (since 1981) having already taken out the 2011 high.
Students of economic history will have seen it clearly; the result has been inflation regimes. The 1960s and 70s were inflationary. The 1980s and 90s were deflationary. The noughties were inflationary, the teenies somewhat deflationary, and the 20s inflationary.
When gold can shake off rising interest rates, it tells us that other factors are more important. That is, inflation is not just about shifting currencies and prices; it is a new bout of monetary debasement, which we last saw in the 1970s. In which case…
Who’s Selling the Gold?
I have shown the outflows from the gold ETFs before, and what is puzzling is how they used to follow the gold price. Just as gold has overcome higher rates, it has overcome 30 million ounces of outflows from the ETFs. At current prices, that is $70 billion of selling pressure, a financial tsunami for most asset classes, yet gold has powered through to an all-time high.
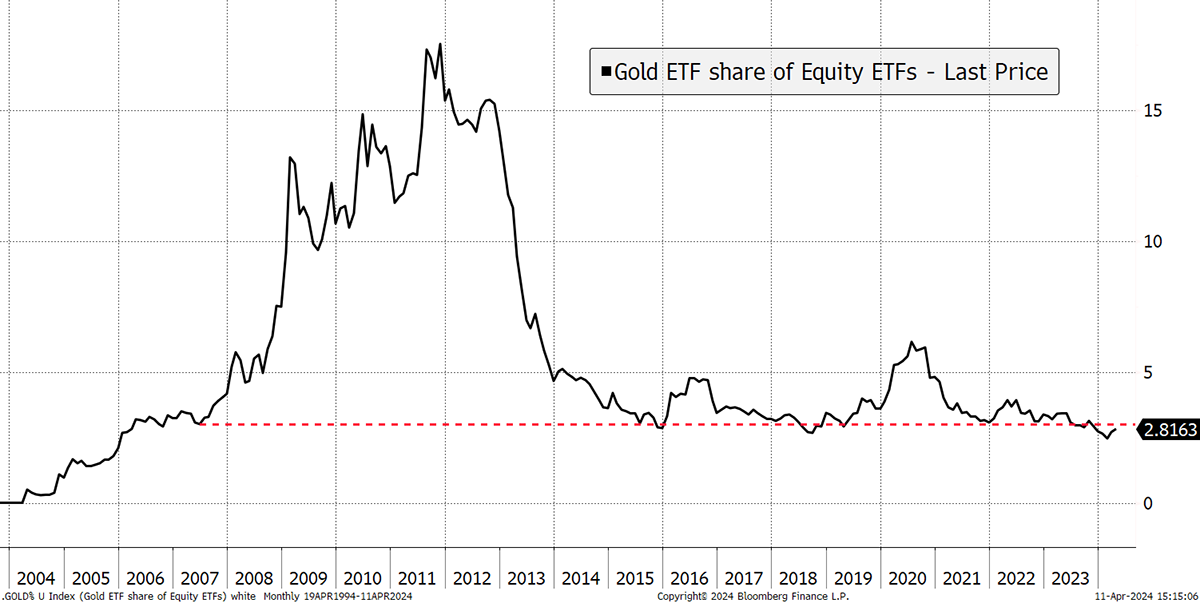
Gold Held by ETFs
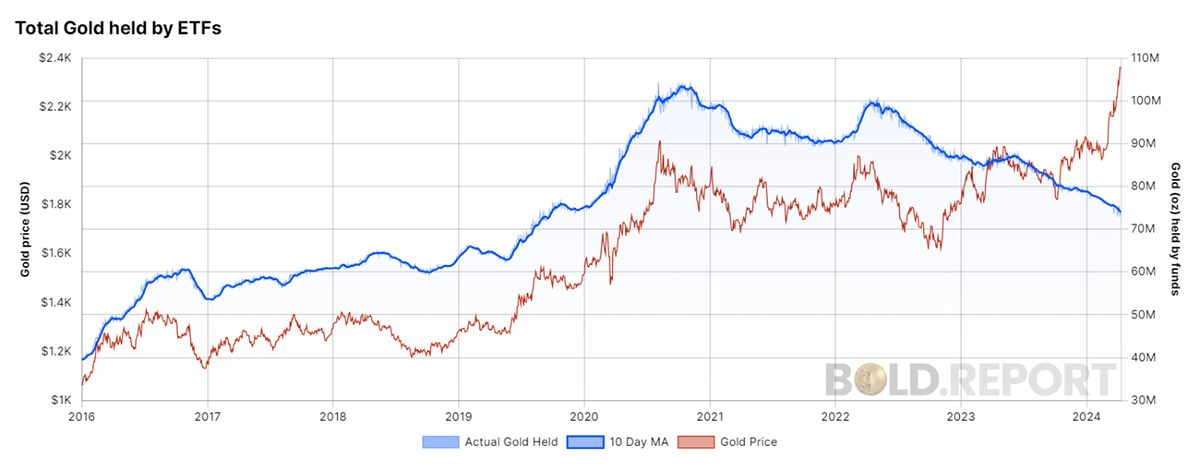
It is remarkable that the ETF vaults now have extra space for dance classes, and what is even more surprising is how gold allocations remain low at a time of global uncertainty combined with technical strength in the gold price. Moreover, this lowest figure for 16 years has been boosted by a high gold price. Had it not rallied, it would be 20% lower.
Gold Allocations Remain Low
Asset allocators have been selling gold to the tune of 12 million ounces in 12 months. The biggest outflows have come from the biggest funds, which is hardly surprising, but then you see the heavy selling from the UK, and Germany isn’t far behind.
Sales by Gold ETF
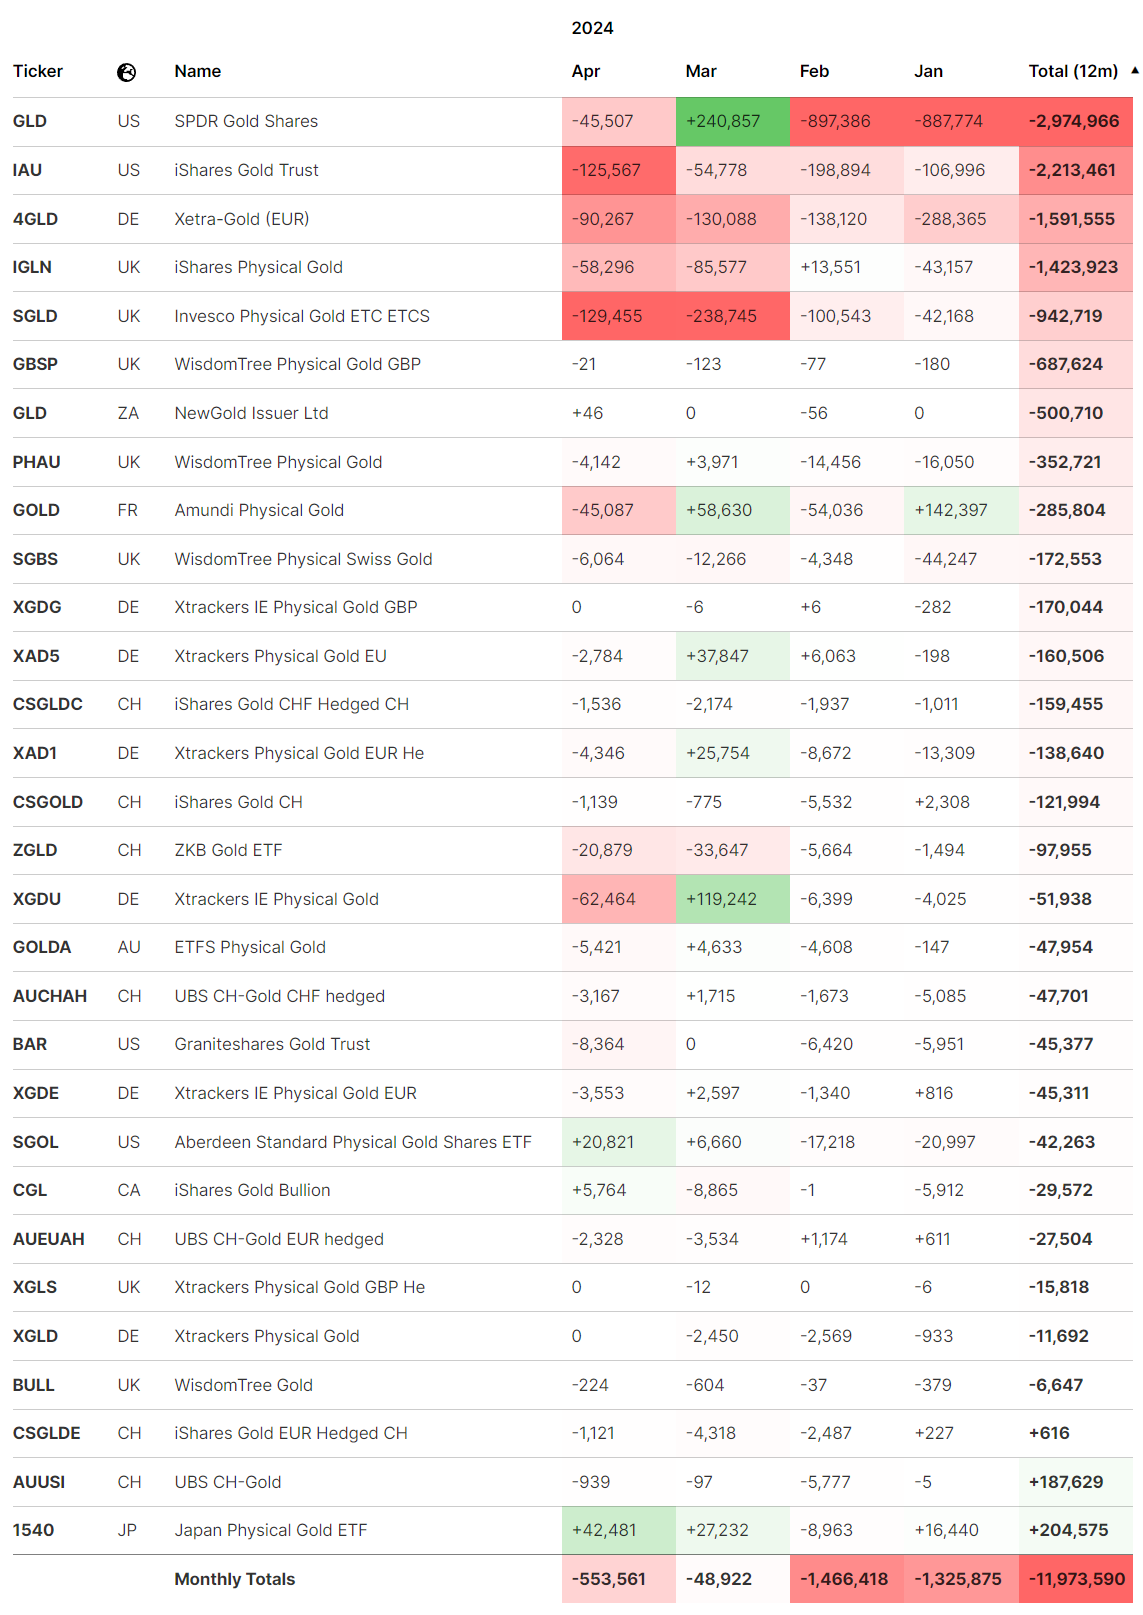
One thing that Europe, and especially the UK, does better than the US is selling gold. Pre-2000, the Central Bank Gold Agreement (CBGA) had the European central banks form an orderly queue to sell their gold. While the US gold ETFs have seen larger outflows, they were bigger in the first place. On a proportional basis, the European gold ETFs are shrinking at a faster pace, especially in the UK.
Gold ETFs Are Shrinking
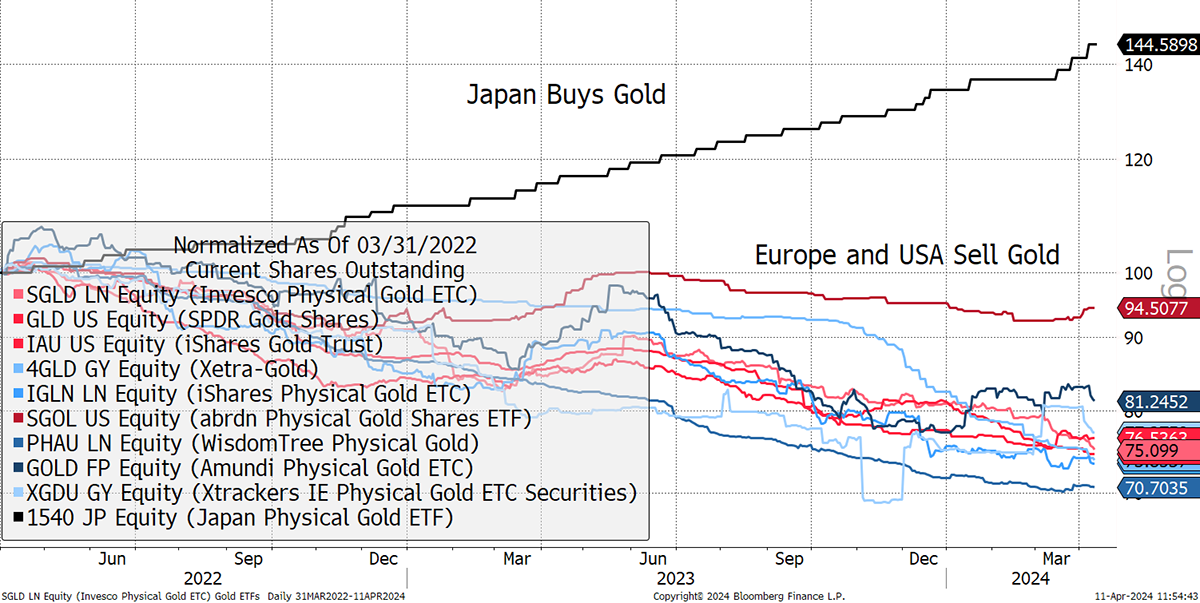
A salute to the Japanese who are buying gold, but their currency has been weak, so it’s understandable. The US and European gold ETFs have seen heavy outflows, with the funds shrinking by 20%. Yet the UK gold ETFs have seen the largest proportional outflows, shrinking by 25% to 30%. What’s going on?
I can only presume that this is another example of broken markets. In the UK, the stockmarket used to be owned by pension funds, insurance companies, wealth managers and private individuals. The pension funds and insurance companies have been reducing their equity ownership for years following regulatory changes. The wealth managers, which these days are fairly large, are significant players, but increasingly in index funds and large caps. This has led to an extraordinary situation in UK mid- and small-cap stocks, where they are undercapitalised, and bargains are plentiful. Check out ByteTree Venture if you haven’t already.
The death of active management, in favour of passive, has gotten out of hand. Fifteen years ago, strategic asset allocation committees at wealth firms embraced gold, even if it was a token 2% allocation. Gold was not in the 60/40 (equity/bond) benchmark, so risk departments would highlight gold as a potential problem that could lead to portfolio underperformance whenever it lagged equities and bonds. No matter the real risk of debasement, or a financial crisis, where gold acts as portfolio insurance, it was the “business” or “career” risk that ruled the day.
The rise in real interest rates has been the excuse to cut gold’s allocation to zero. It seems this is more prevalent in the UK, where the wealth sector is heavily regulated, and differentiation between the outcomes of wealth managers has subsided. If the wealth industry was acting in the best interests of their clients, an allocation to gold would be a given.
These investors will come back because gold is going up, and problems are brewing. There is nothing more powerful than FOMO.
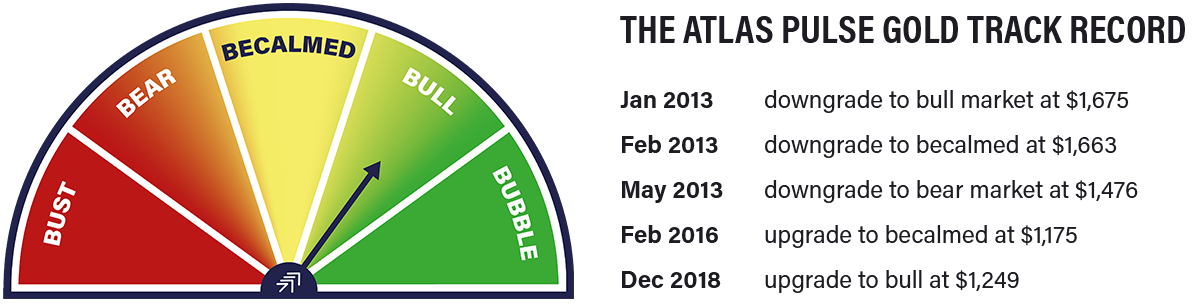
The Atlas Pulse Gold Regime
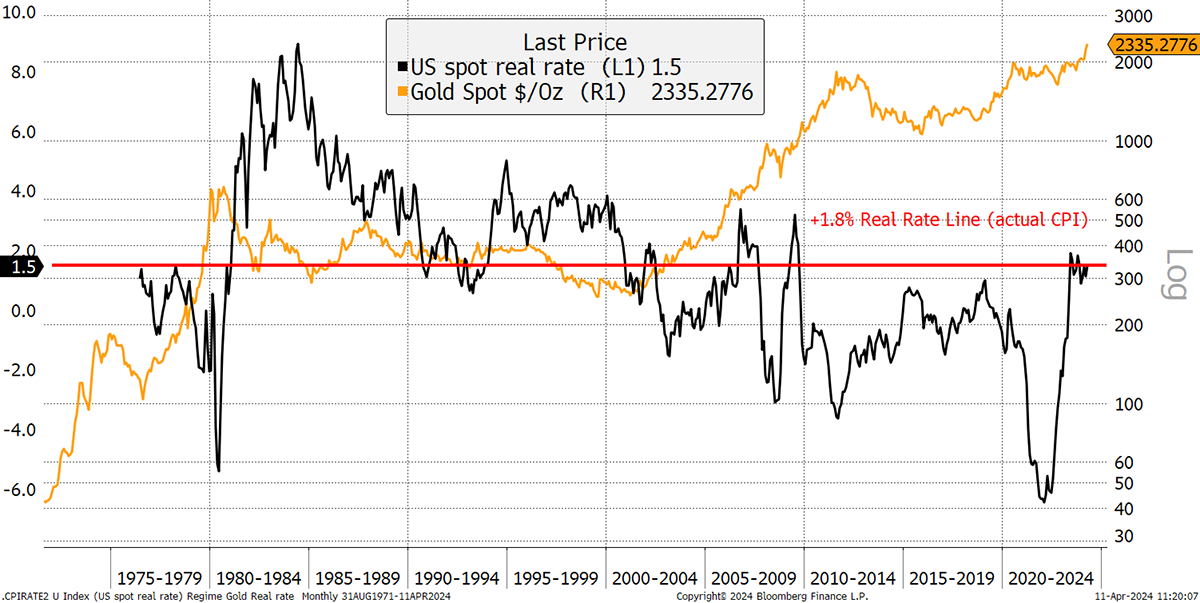
Time to revisit my three favourite gold charts that mark the regime for bull and bear markets. First up are real interest rates in the US. A bear signal is given if real rates are above 1.8%. This has been close, but with 5% 2-year yields and 3.5% inflation, real rates are just below the threshold. This criterion has been flashing amber for over a year.
Real Rates Are Below 1.8%
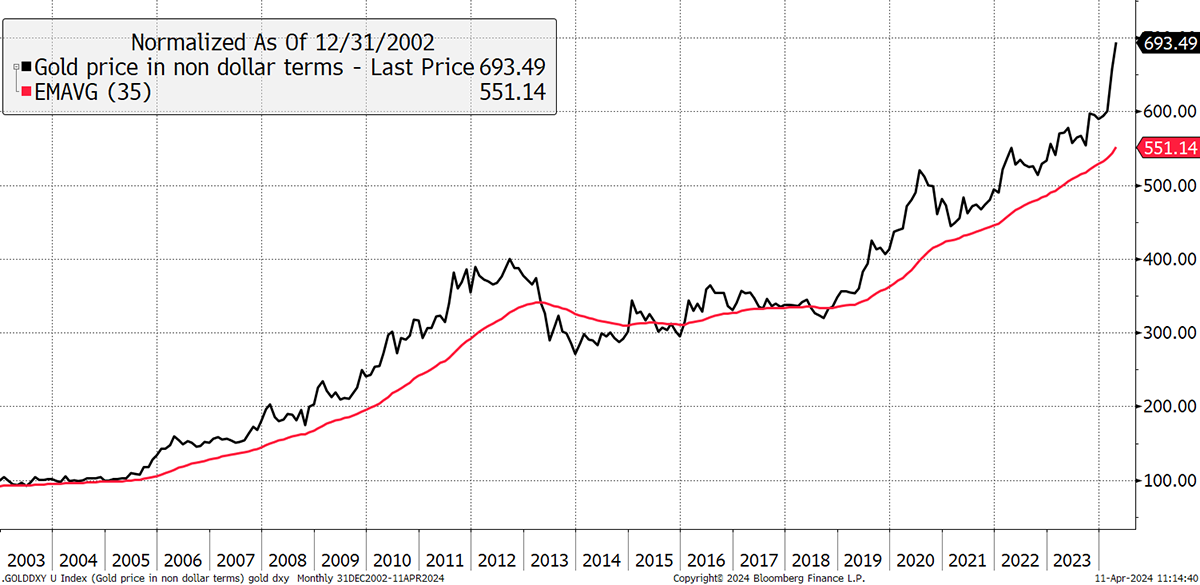
Next up is the non-dollar trend, or the gold price in a global currency basket, excluding the US dollar. It’s decisively bullish.
Gold Non-Dollar Trend Bullish
Finally, there has been the price of gold relative to the S&P 500. When you consider how strong the S&P has been, powered by big tech, it is remarkable that gold has matched it since 2018. It’s neutral rather than bullish, but if you suspect, as I do, that the S&P is a bubble pending bursting, then you’d happily buy this chart.
Gold Relative to the S&P 500 Is Stable
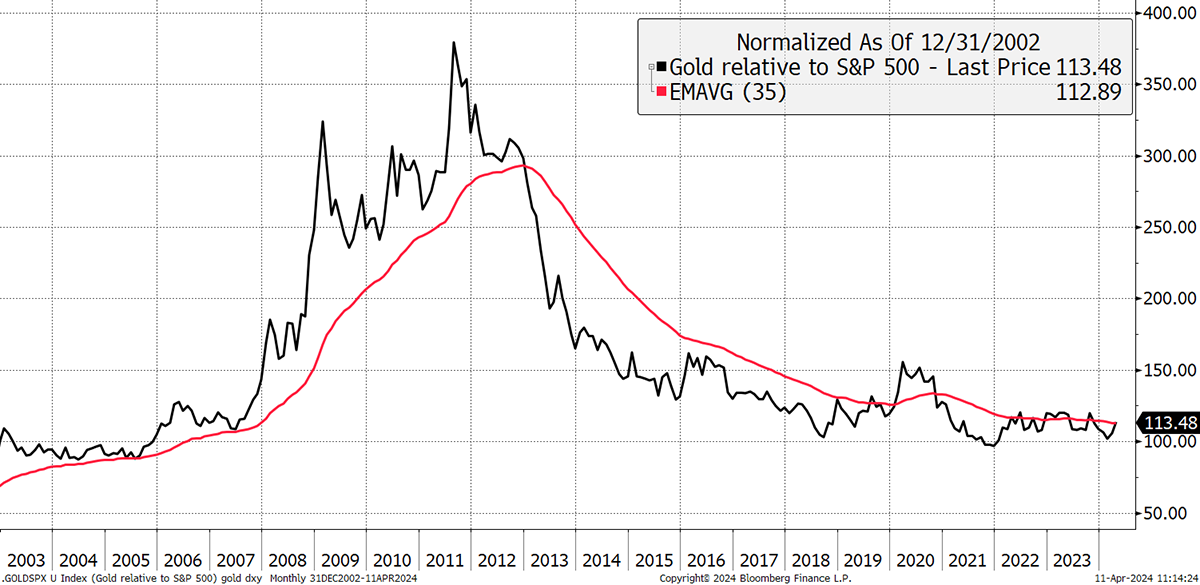
Putting these ideas together, it is the middle chart that has remained so decisive. Stripping away the dollar, gold has been motoring since 2018. Yet it’s kept pace with a booming S&P and fought off real rates, which, while higher than in recent history, are still not that high. Besides, you sense real rates have peaked.
Bitcoin and Gold
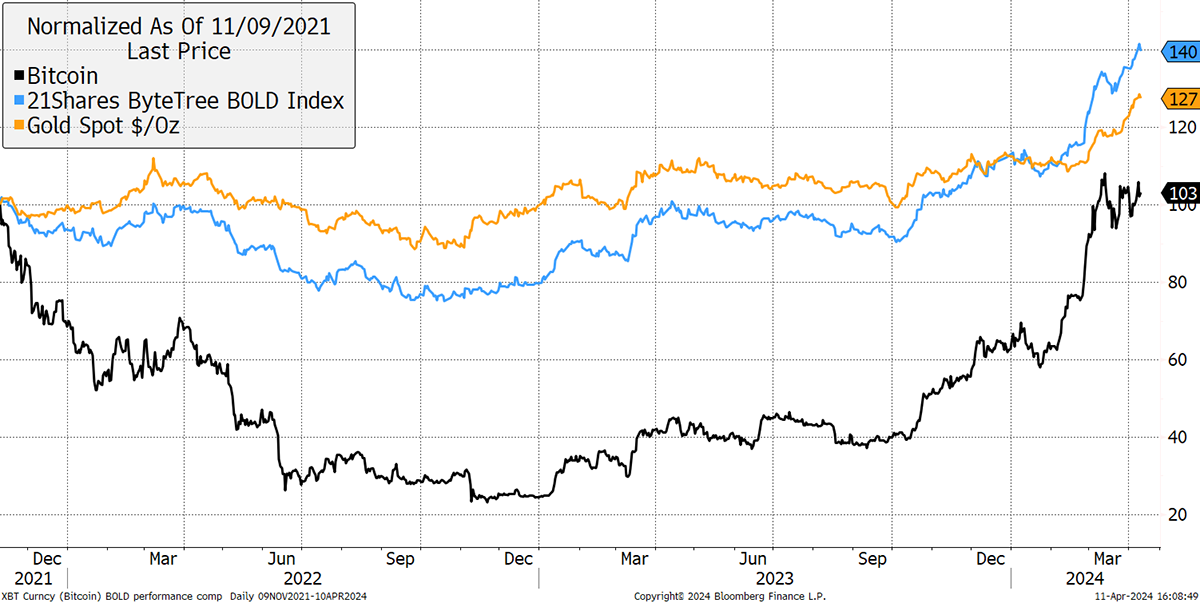
It would be remiss of me not to show the impressive performance of gold since the Bitcoin all-time high in late 2021, which is still 24% ahead of Bitcoin, which gets all the headlines. Naturally the smart money opts for the ByteTree BOLD Index, which combines the two greatest and most liquid alternative assets on a risk-weighted basis. I never tire of this chart.
Bitcoin, Gold and BOLD since the 2021 Bitcoin High
I write about the BOLD Index at the beginning of each month.
Summary
Having followed gold since 1999, I have never seen the market so confused. With public debt and deficits out of control, it is hardly surprising gold is strong. Debasement seems inevitable, and gold is the safest port in the storm. There is no need to be confused.
Thank you for reading Atlas Pulse. The Gold Dial Remains on Bull Market. Please email me at charlie.morris@bytetree.com with your thoughts.