

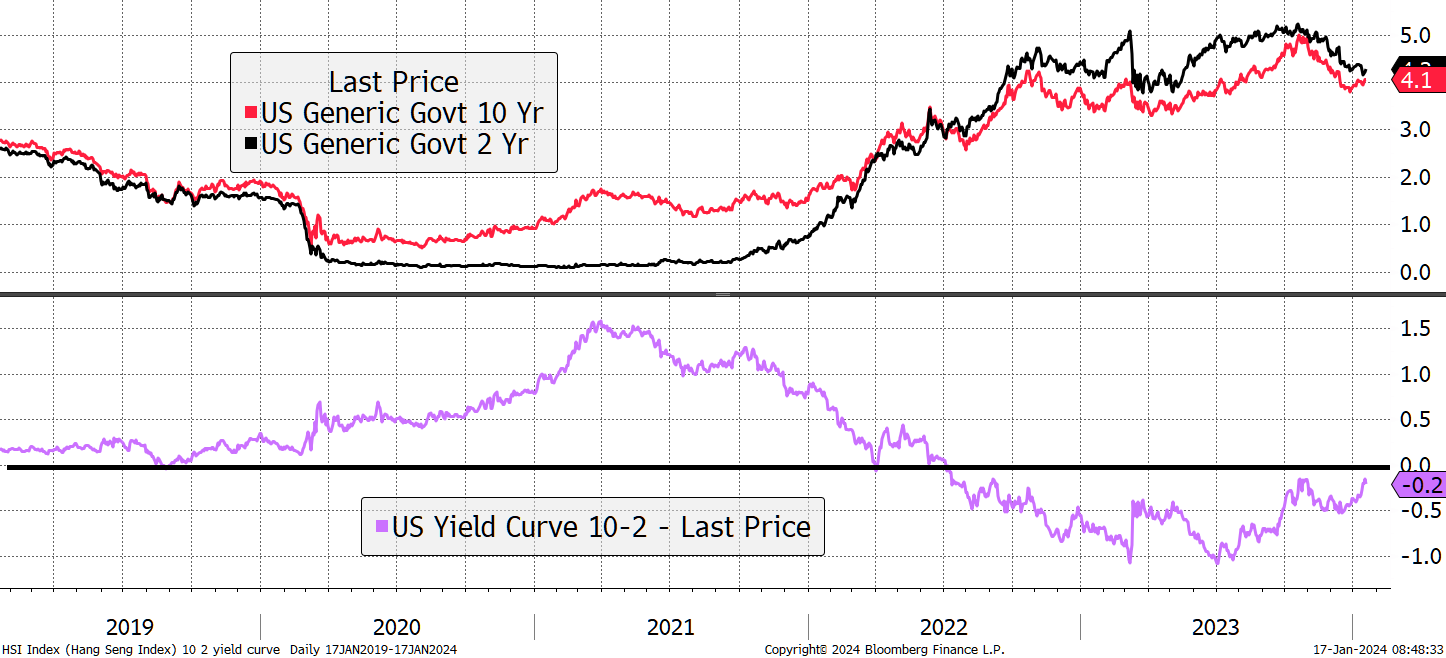
The yield curve has been inverted since mid-2022, which is widely thought to forecast a recession. That means the 10-year yield is below the 2-year yield. Investors are willing to pay more for longer term debt because they believe economic weakness will lead to a fall in interest rates. If so, they will lock in the higher rate for a longer period of time.
In 2021, the 10-year bond paid 1.7%, and the 2-year paid 0.2%, a 1.5% gap. That coincided with a surging stockmarket on the back of vast stimulus packages. In 2022, the 2-year yield overtook the 10-year, thus “inverting” the yield curve. It has remained inverted for a long time, yet we still haven’t seen the widely forecast recession. In recent months, the curve has been “steepening” or “normalising” as the short-term rates catch down with long-term rates.
Normalisation of the Yield Curve
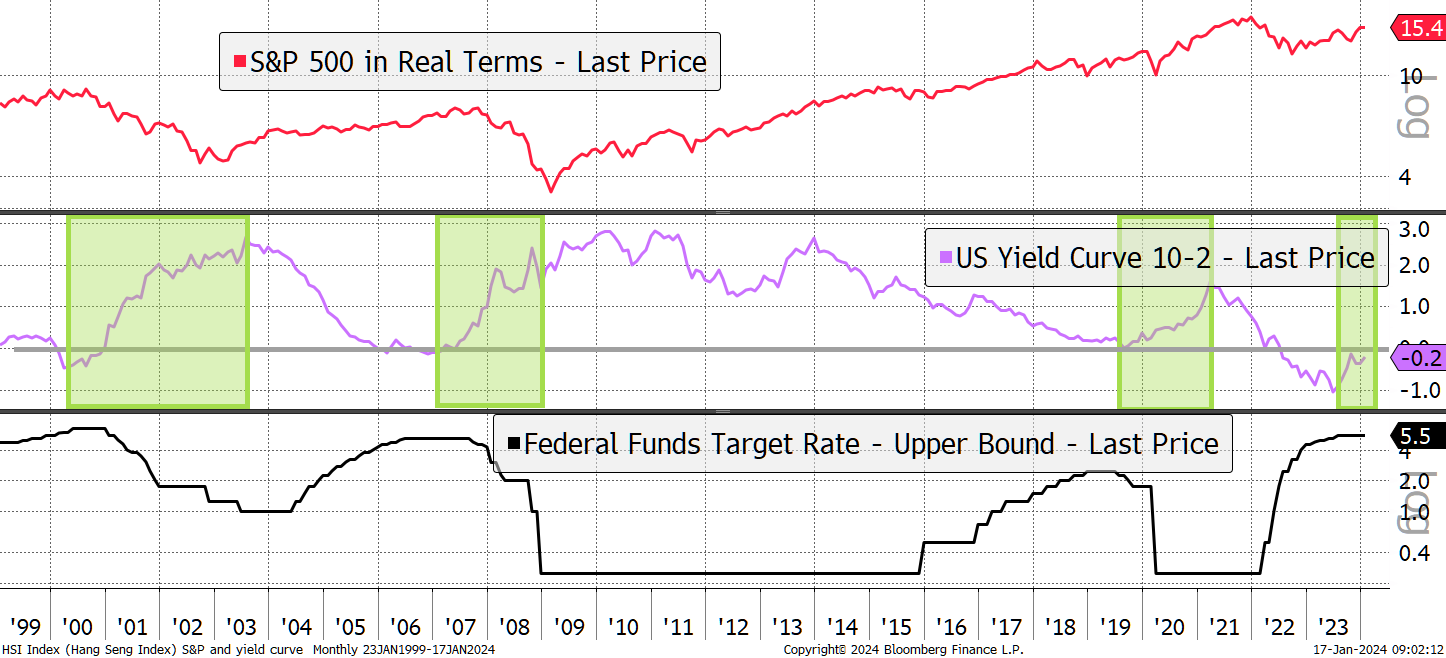
Some think lower rates are a cause for celebration. They can be if the economy is growing while inflation is under control. But if the economy is cooling, and inflation remains a source of uncertainty, then the room for rate cuts will be limited. Worse still, the cuts would come from a position of weakness rather than strength, as seen in 2000, 2007, and 2019.
Rate Cuts Can Trigger a Bear Market
UK inflation was reported this morning. CPI was 4%, up from 3.8%, while core inflation was 5.1% up from 4.9%. Core excludes food and energy, so you can’t blame external factors. These numbers are far from contained, and the surge began three years ago.
Inflation was also higher in the USA last week, with core at 3.9% compared to 3.8% the previous month. CPI was 3.4% compared to 3.2% last month. The oil price isn’t even going up, and still, we see stubbornness in prices. There must be a structural element to this that the system doesn’t fully understand.
Our central bankers have 2% inflation targets. If they were to cut rates with inflation so far above target, their credibility would be damaged, as if it weren’t bad enough already. The point is the market’s expectations for rate cuts are hopeful, and if it turns out to be right, that is likely because the economy is in real trouble.
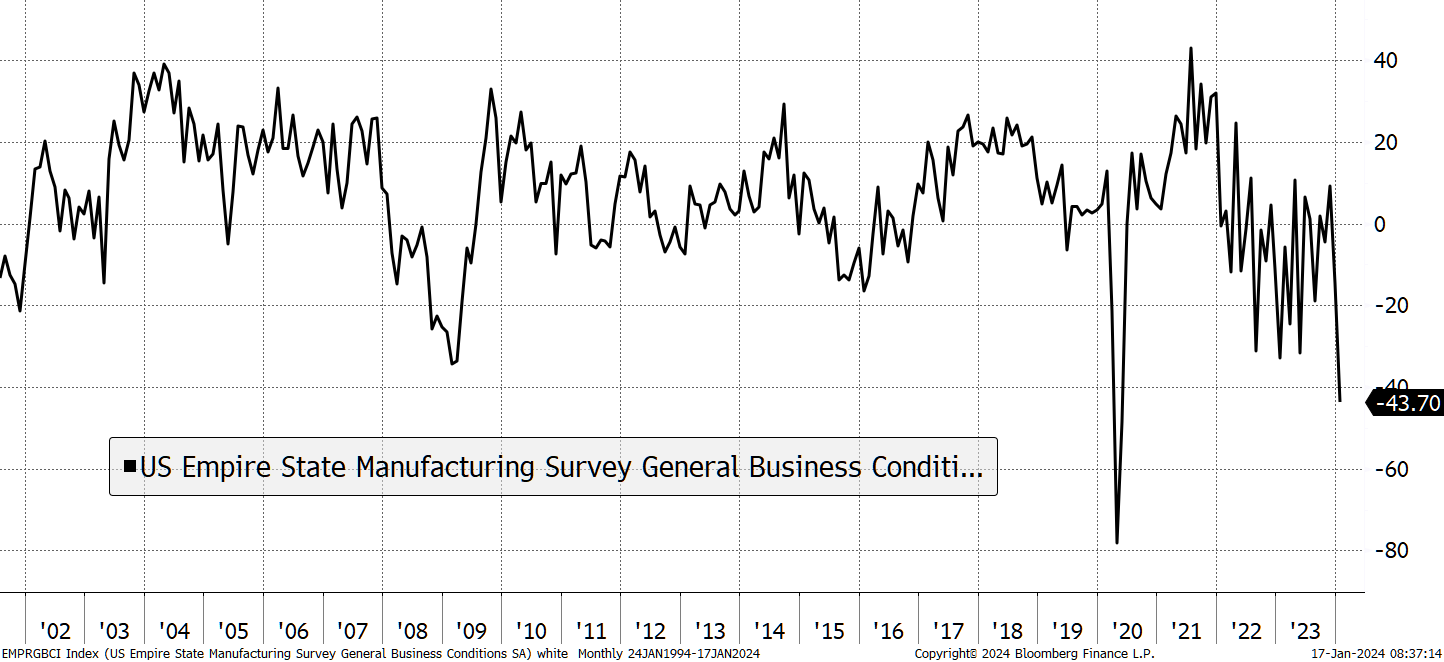
And it might just be. Yesterday, the US Empire Manufacturing Survey data was released at -43, against expectations of -5. That’s one hell of a miss, and it makes you wonder if it was a typo? It may improve next month, but it is the second-lowest reading on record, only surpassed by the pandemic. Best to take notice.
Manufacturing is Weak
UK house prices were also reported today and are down 2.1% year on year. That’s the fifth consecutive negative month and hardly surprising given where interest rates are. The post-pandemic housing boom is clearly over. Looking back to the 1970s, it’s notable how infrequent falling house prices are.
House Price Crash
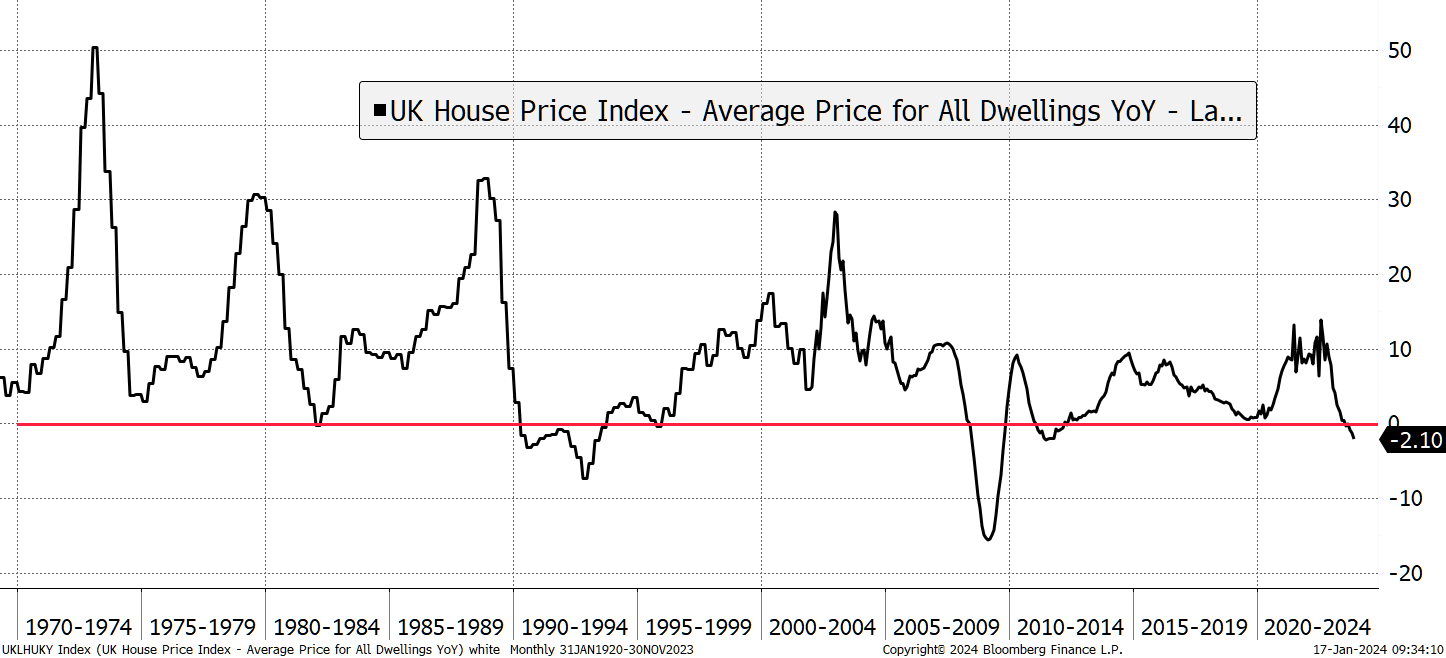
There have been two notable episodes. The credit crisis housing crash was short-lived because it was caused by the withdrawal of financing. Once restated, the housing market recovered. Prices were extended from trend in 2007 but have merely matched inflation ever since. The other occasion was in the late 1980s and early 1990s. That was caused by high-interest rates following a boom during the 1980s. It saw a 37% in real terms and 20% in nominal terms. Brutal.
UK Real House Prices
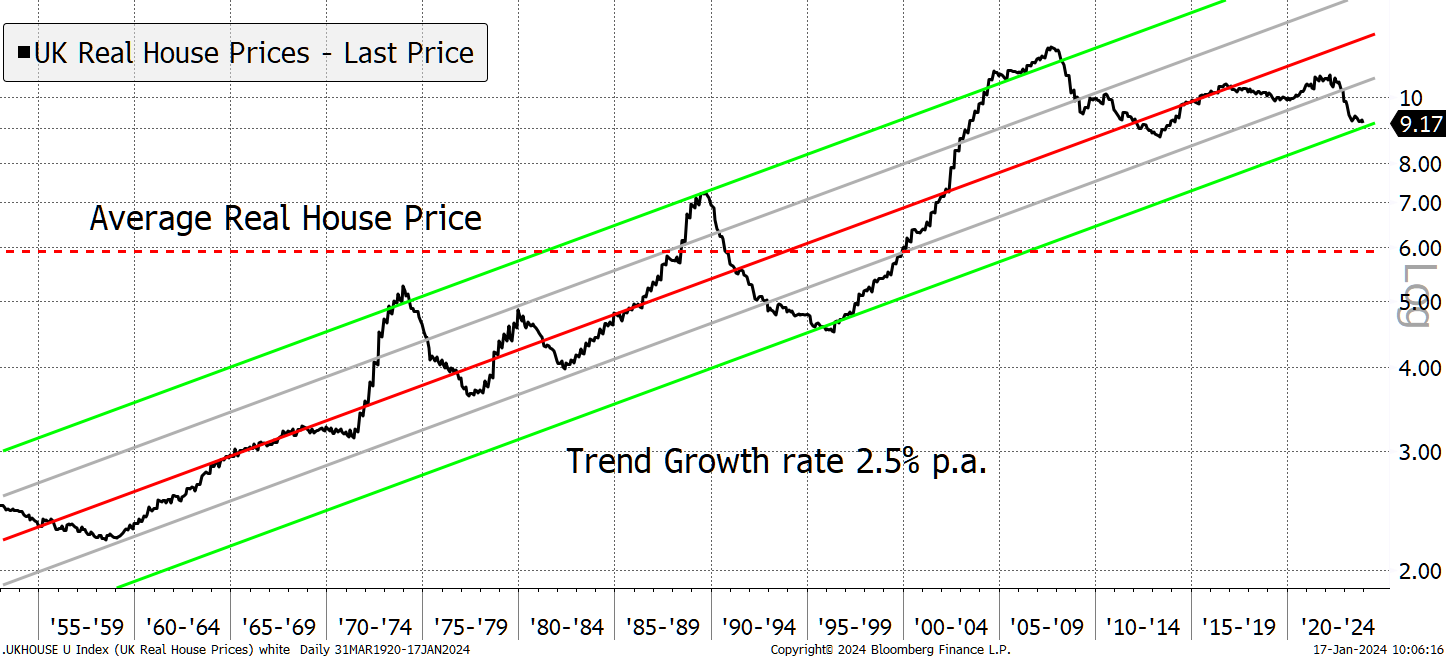
What no one really knows is whether real house prices over the long term should revolve around a constant or rise. The chart shows that since the 1950s, real house prices have risen 2.5% p.a. on average, or 137 times in nominal terms, which incidentally is about the same as the Dow Jones Index (excluding dividends and rents). But consider that the starting point is the 1950s. One can only assume property was dirt cheap in the aftermath of WW2.
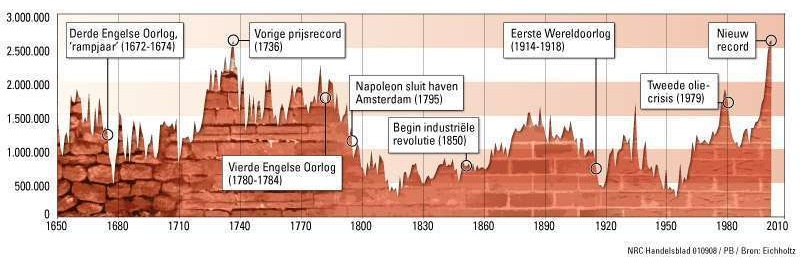
Most property watchers are certain there’s a real return from house prices. But the reason I wonder comes from the Herengracht Index, which studied house prices in the Herengracht district of Amsterdam (think Mayfair) between 1628 and 2010. That paper cites a range, with 2010 being an all-time high, as it has been in many cities around the world.
The Herengracht Index – 1628 to 2010
It’s a shame we don’t know more about the history of property prices because we would be better prepared. If UK houses trend at 2.5% real, we are already at the bottom of the range (chart UK Real House Prices above), and it’s a good time to buy. Yet, given how implausible it is for a young person to buy a house these days, I struggle to believe today’s houses are cheap. I am more swayed towards the Herengracht thesis, in which case, UK real house prices could drop by a third just to revert to the mean, just as they did in the 1990s.
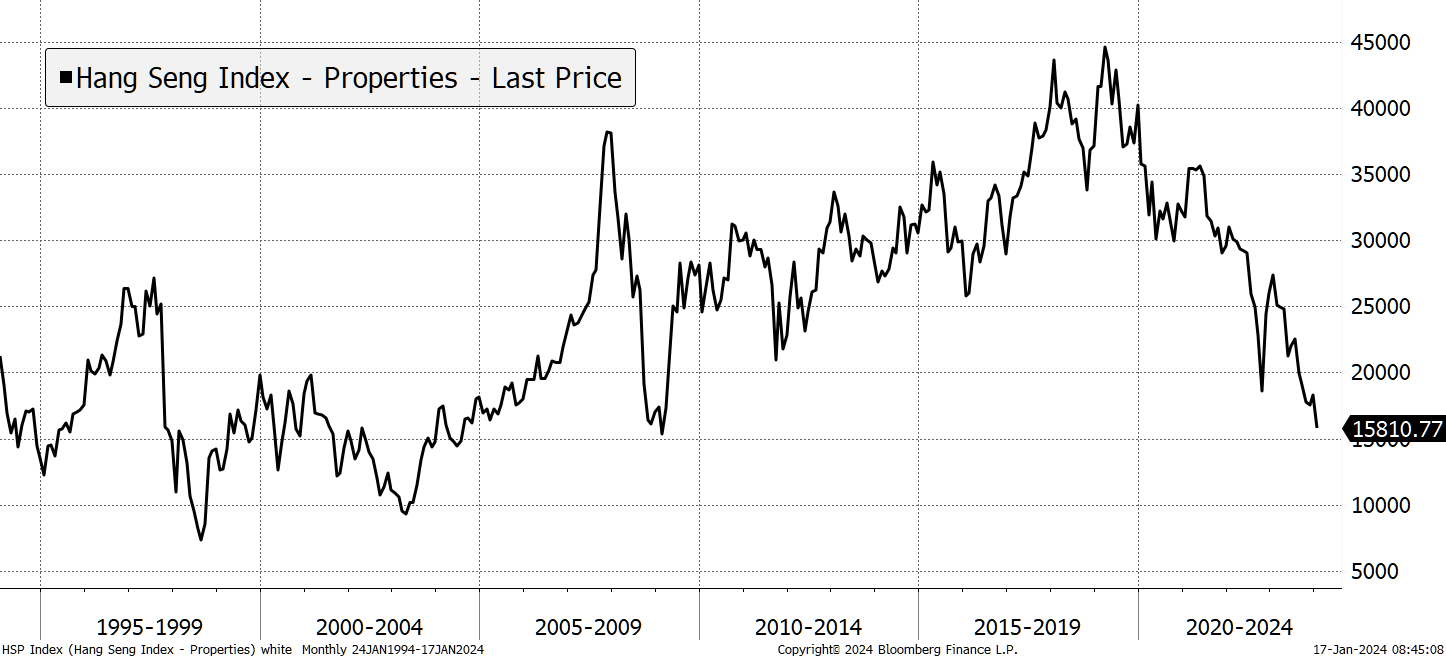
My concerns over housing are that it's a global problem, and it's spreading with China leading the way. The Hang Seng Property Index keeps on making new lows. Intervention and stimulus doesn’t seem to achieve very much.
China Property Continues to Weaken
I don’t mean to sound as if the world’s about to end, but it is essential that we investigate the possibilities to both the upside and down.
So far this year, the Santa rally has reversed, and most markets are down. The worst are the Hang Seng -10%, Australia -6% and Sweden -7%. If this continues, and we can identify a problem that could spread. I will not hesitate to reduce the level of risk in portfolios. This is why I strive to keep the portfolios liquid so when things do go wrong, we still have choices.
On the banks, I am swayed towards Nat West (NWG), on value grounds, but that can wait.
General - Your capital is at risk when you invest, never risk more than you can afford to lose. Past performance and forecasts are not reliable indicators of future results. Bid/offer spreads, commissions, fees and other charges can reduce returns from investments. There is no guarantee dividends will be paid. Overseas shares - Some recommendations may be denominated in a currency other than sterling. The return from these may increase or decrease as a result of currency fluctuations. Any dividends will be taxed at source in the country of issue.
Funds - Fund performance relies on the performance of the underlying investments, and there is counterparty default risk which could result in a loss not represented by the underlying investment. Exchange Traded Funds (ETFs) with derivative exposure (leveraged or inverted ETFs) are highly speculative and are not suitable for risk-averse investors.
Bonds - Investing in bonds carries interest rate risk. A bondholder has committed to receiving a fixed rate of return for a fixed period. If the market interest rate rises from the date of the bond's purchase, the bond's price will fall. There is also the risk that the bond issuer could default on their obligations to pay interest as scheduled, or to repay capital at the maturity of the bond.
Taxation - Profits from investments, and any profits from converting cryptocurrency back into fiat currency is subject to capital gains tax. Tax treatment depends on individual circumstances and may be subject to change.
Investment Director: Charlie Morris. Editors or contributors may have an interest in recommendations. Information and opinions expressed do not necessarily reflect the views of other editors/contributors of ByteTree Group Ltd. ByteTree Asset Management (FRN 933150) is an Appointed Representative of Strata Global Ltd (FRN 563834), which is regulated by the Financial Conduct Authority.
© 2026 ByteTree Group Ltd