

Monthly Rebalancing Report;
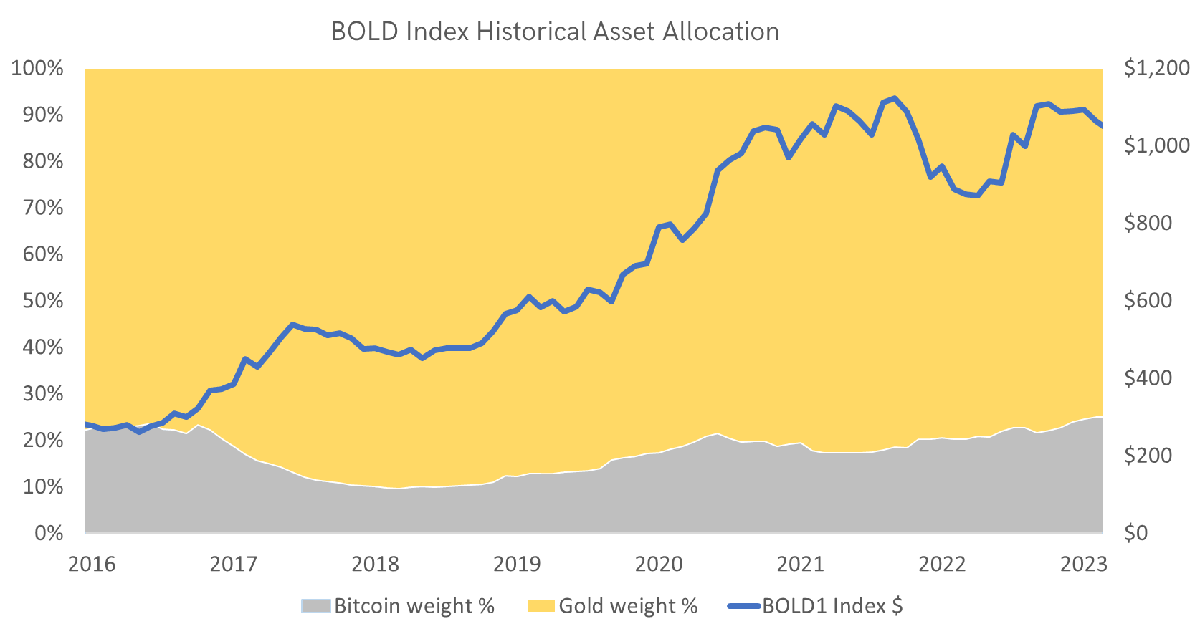
Following rebalancing on 30 September 2023, the new weights for the BOLD Index are 25.5% Bitcoin and 74.5% Gold.
The Vinter ByteTree BOLD1 Index (BOLD) invests in Bitcoin and Gold. BOLD combines the world’s two most liquid alternative assets on a risk-adjusted basis. Due to their natural low correlation, the diversification benefits of holding both assets have been unusually high. Bitcoin prefers risk-on market conditions, while gold prefers risk-off.
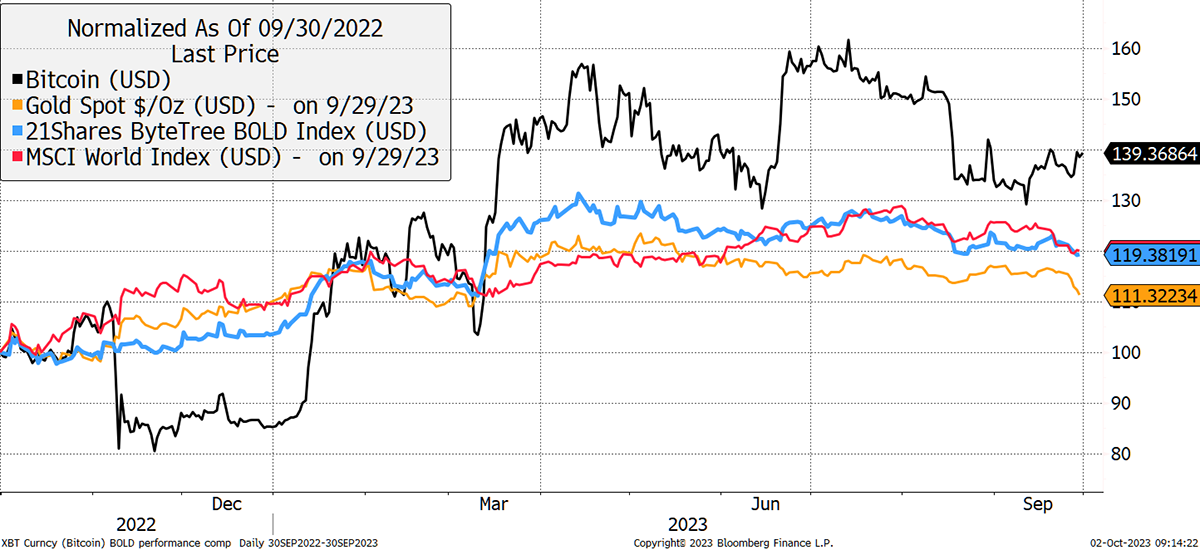
BOLD fell by 3.0% in September, taking the return for the year to 19.4% in USD terms. Over the month, Bitcoin rose by 4.1%, gold fell by 4.7%, and global equities fell by 4.5%. Bitcoin proved to be an effective diversifier and rallied despite a strong 2.5% move in the US dollar.
BOLD, Bitcoin, Gold, Nasdaq, and World Equities over One Year
Recent price action has seen a strong divergence between Bitcoin and Gold. Last year, Gold held up, but this year, it is Bitcoin’s turn. Going back a decade, a single Bitcoin was worth 0.1 ounces of Gold. They briefly hit parity in 2013, where 1 BTC equaled 1 oz Au. That was successfully retested in 2017 when it also challenged 10 oz Au later that year.
Bitcoin in Gold
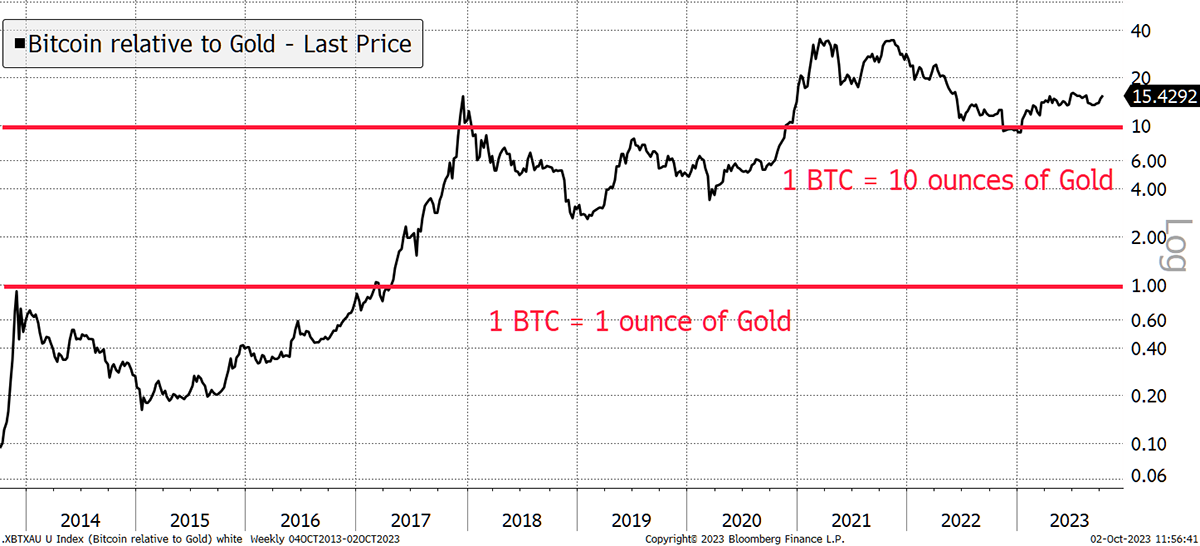
That didn’t last for long, but after halving in 2020, Bitcoin peaked at 37 oz Au in October 2021. It retreated back to 10 oz Au in the bear market, where it found support. It is curious that both the 1 and 10 oz levels proved to be prescient in terms of providing support and resistance. No doubt 100 oz Au will be as well.
BOLD combines Bitcoin and Gold on a “risk-weighted” basis so that the more volatile asset has a lower exposure and vice versa. That means BOLD has much higher exposure to Gold than Bitcoin. Think of an old sailing ship that uses Gold for ballast and Bitcoin as a sail.
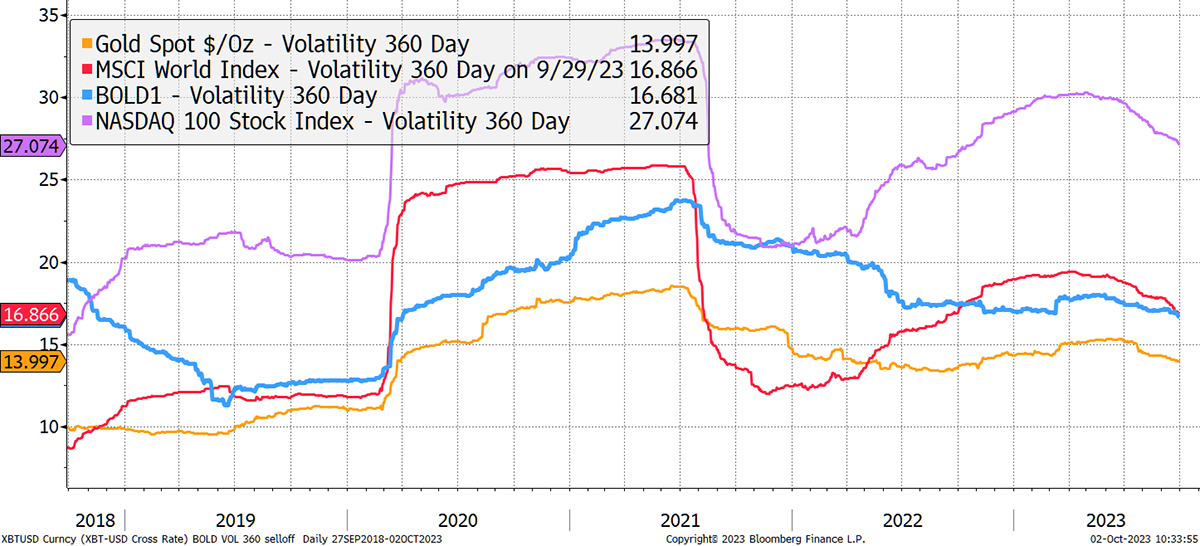
The BOLD index measures volatility over the past 360 days for each asset. Bitcoin volatility fell to 38.6%, while Gold was 13.2%. This is the lowest recorded volatility for a 360-day period for Bitcoin on record. Gold’s volatility has also remained low.
Bitcoin and Gold Past 360-day Volatility
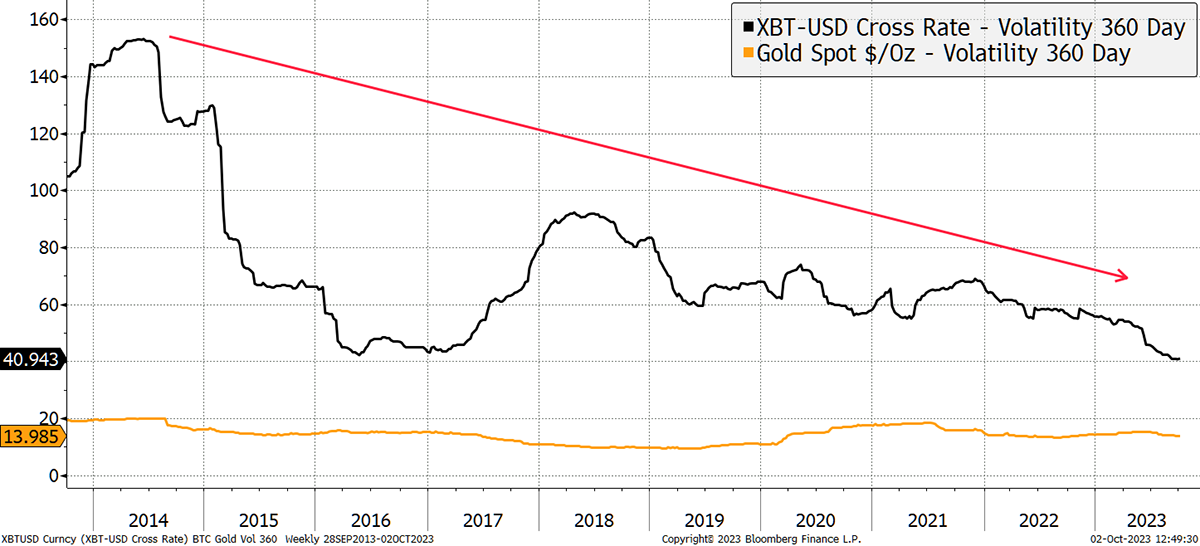
Volatility is a measure of how much prices move on a typical trading day. The brutal bear markets in Bitcoin in 2014 and 2018 saw very high volatility. In contrast, the 2022 bear market did not. This is further evidence that Bitcoin is becoming structurally less volatile and, therefore, more mature and credible as an asset.
Risk-weighted asset allocation techniques are commonly used in finance to improve risk-adjusted returns. BOLD uses the “inverse volatility” methodology, which means the more volatile asset has a lower weight in the basket and vice versa.
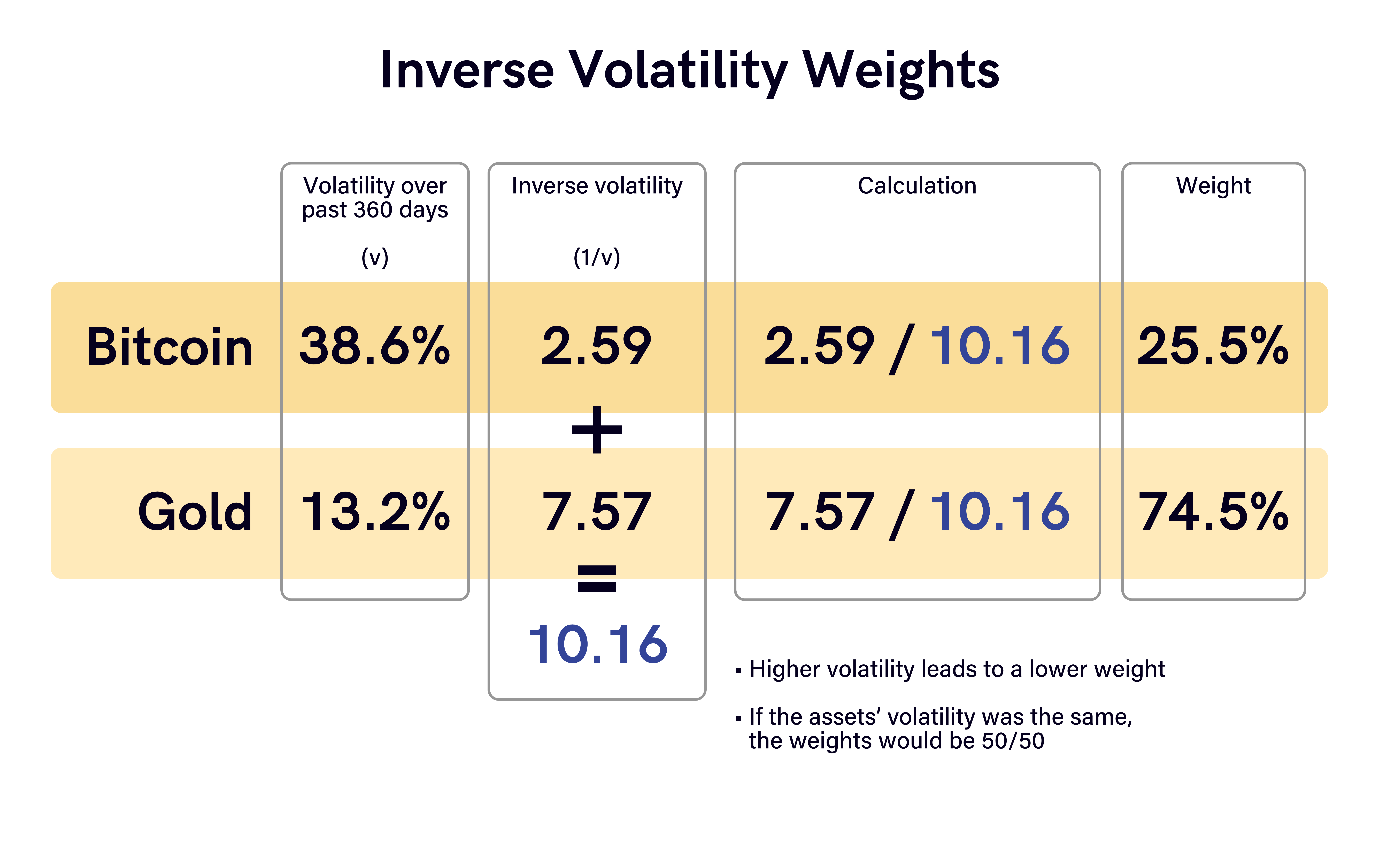
The math is simple yet powerful, as the same amount of “risk” is allocated to each asset. Bitcoin is obviously more volatile than Gold, so a 50/50 basket would contain too much Bitcoin, which would overwhelm the gold. According to the inverse volatility technique used, and based on last year’s volatility of each asset, the portfolio is optimized with 25.5% in Bitcoin and 74.5% in Gold.
Historically, this is the highest allocation to Bitcoin in the history of the BOLD Index. It has averaged around 20% Bitcoin and 80% Gold. Bitcoin exposure fell lower in 2017 and 2018 when volatility exploded and has been rising again as Bitcoin has matured.
For Bitcoin to reach a 30% weight in the BOLD Index, its volatility would need to fall to approximately 35% at current levels of Gold Volatility. However, if Gold’s volatility rose to 17%, the Bitcoin weight would exceed 30% at current levels of Bitcoin volatility. Both sides of the equation matter.
It isn’t difficult to imagine how Gold’s volatility could rise because the price is heavily extended from US TIPS, which have been closely aligned in the past. Atlas Pulse readers will have seen this, and there are explanations. The war in Ukraine has changed the perceived appeal of US Treasuries, with some countries favoring Gold. It could also be that TIPS are understating future inflation expectations. The current implied rate is 2.5% over the next 20 years. In contrast, the Gold Price is forecasting 3.5%.
Gold Trades at a Premium to US TIPS
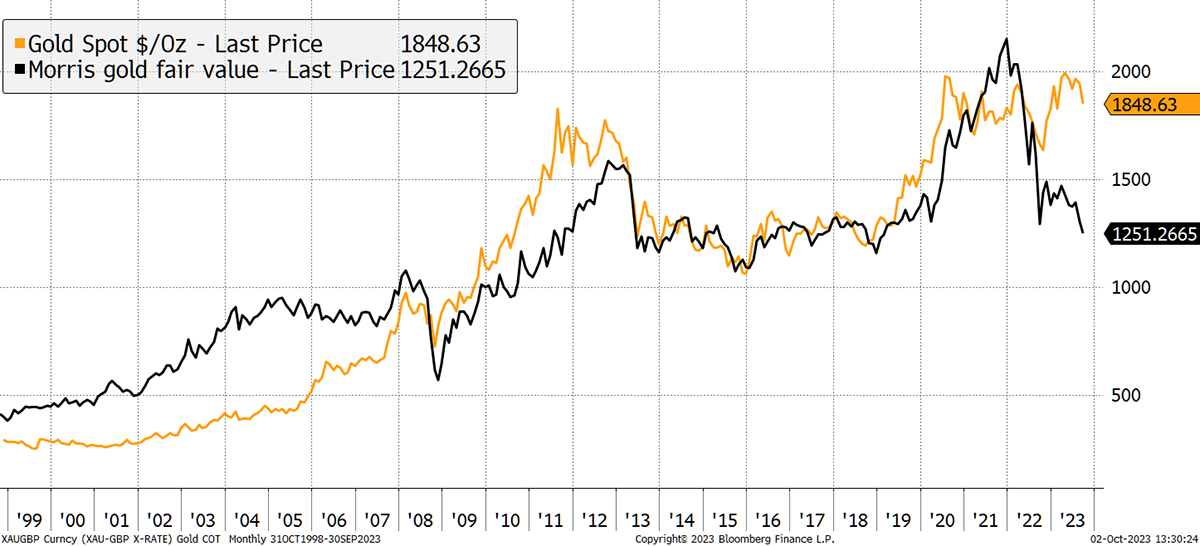
Naturally, when the Federal Reserve eases the rate hikes, the price of TIPS will rise, and that will be more supportive for Gold. But on the other side, Bitcoin is trading in line with its fair value. That is the balance between the price and the volume of value that is transferred across the blockchain.
Bitcoin Fair Value from Network Activity
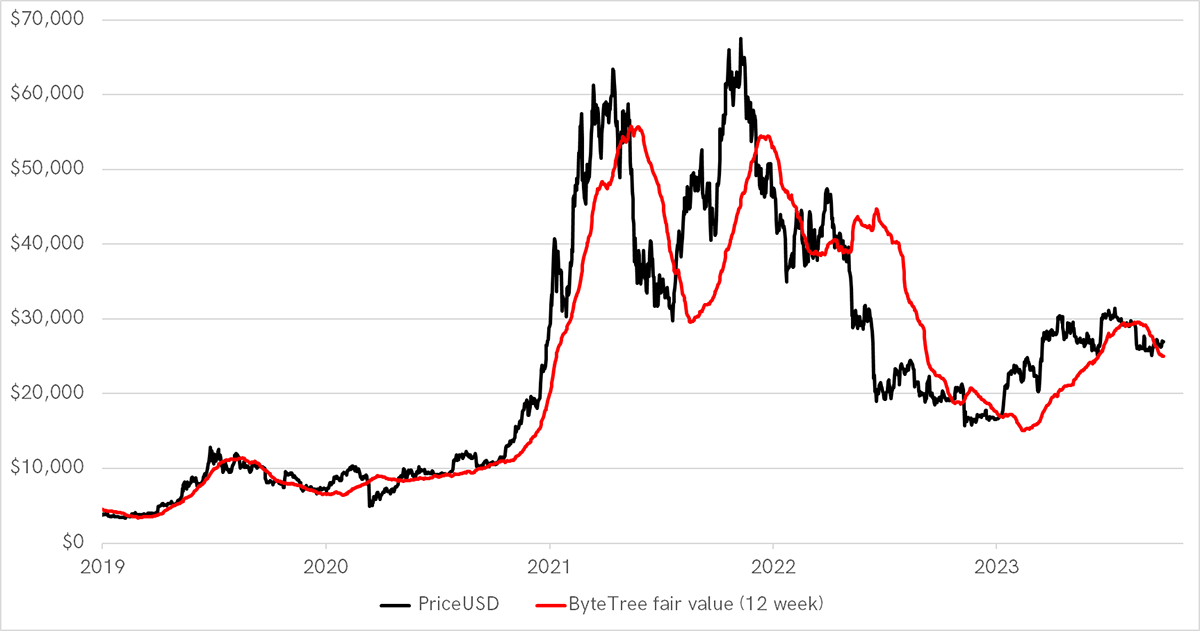
The Bitcoin network is contracting at a modest pace, but that is unsurprising in current macroeconomic conditions. It is reassuring that the fair value is close to the current price, and besides, it’s “Uptober”. It is well known in crypto that October has been the strongest month of the year.
It has normally been the case that at any given time, one asset trades cheaply while the other trades rich. Currently, Bitcoin is more attractive on valuation grounds. Furthermore, we have the next halving in April and an increasing chance of a vibrant ETF market in the US in the coming months. Next year, Bitcoin will have higher demand and less supply. The institutions will eventually come aboard.
BOLD, Bitcoin, Gold, Nasdaq, and World Equities over Five Years
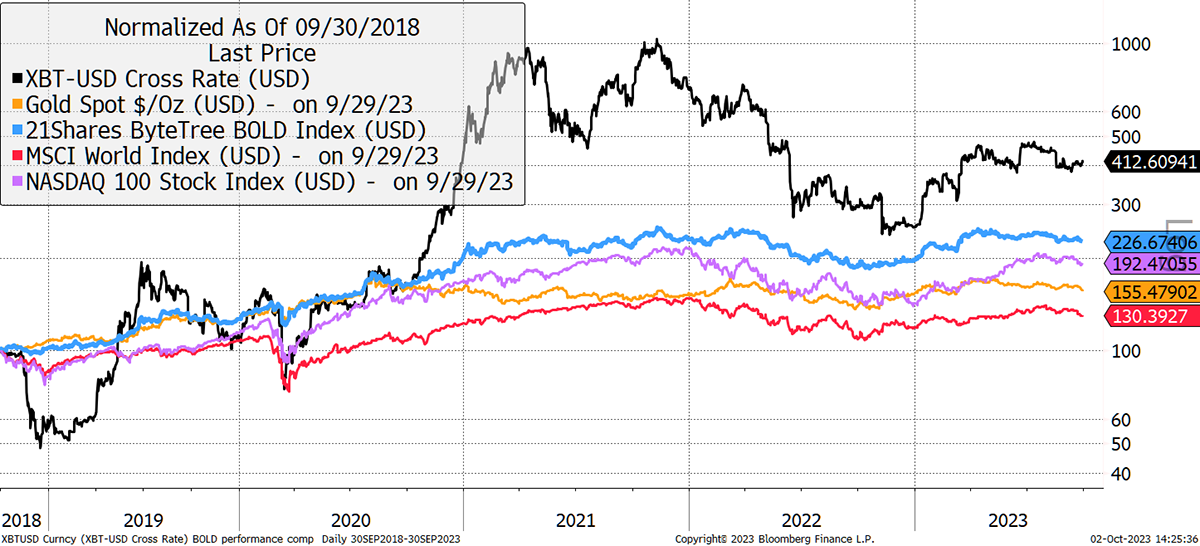
BOLD is an excellent solution for them because it reduces the risk of making the wrong asset choice. Furthermore, the rebalancing process adds value, estimated to be 5% to 7% per year, over and above buy and hold. This is because rebalancing transactions sell high and buy low, which adds value over time by clipping the assets that are in favor at any given time. BOLD is also approximately the same volatility as global equities and less volatile than the Nasdaq.
BOLD, Gold, Nasdaq, and World Equities 360-Day Volatility over Five Years
BOLD is a calm way to engage with Bitcoin. The asset return table shows the total returns for popular asset classes by year, with the best and worst highlighted in blue and red respectively. UK inflation-linked bonds have performed poorly, as shown by the excessive red.
On the right are Bitcoin, Gold and BOLD. Notice how Bitcoin has always been the best or worst performer. And when it has been strong, Gold has tended to be weak and vice versa. Moreover, BOLD, like Swiss equities, has remained calm and has never been either the strongest or the weakest asset class.
Asset Class Return Table by Year
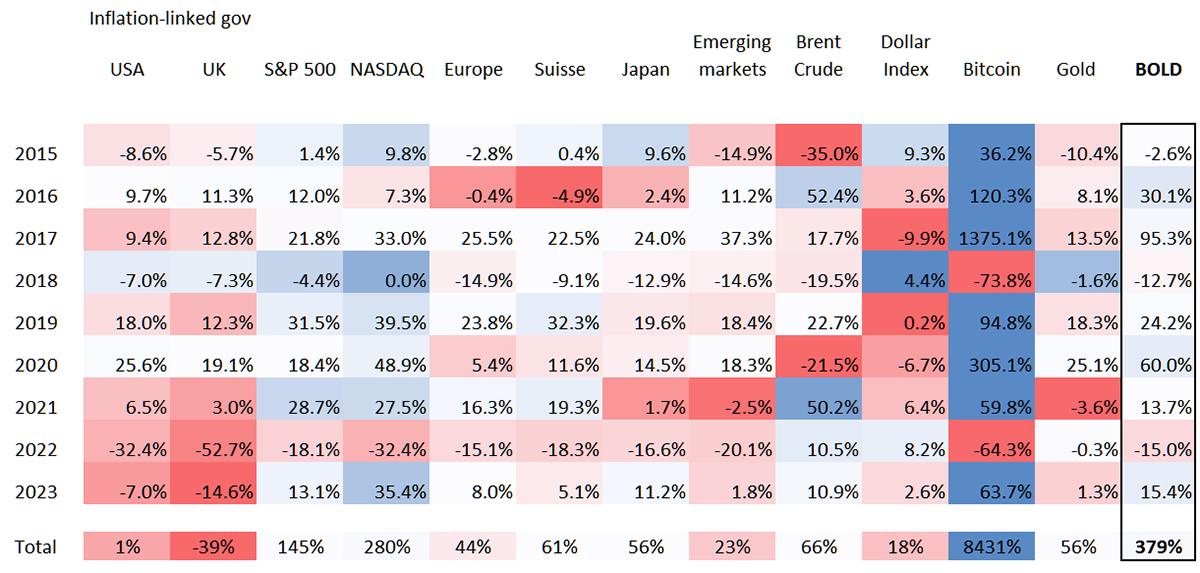
Yet BOLD has appreciated by 379%, which is less than Bitcoin but well ahead of the other asset classes. On a risk-adjusted basis, it has been hard to beat BOLD.
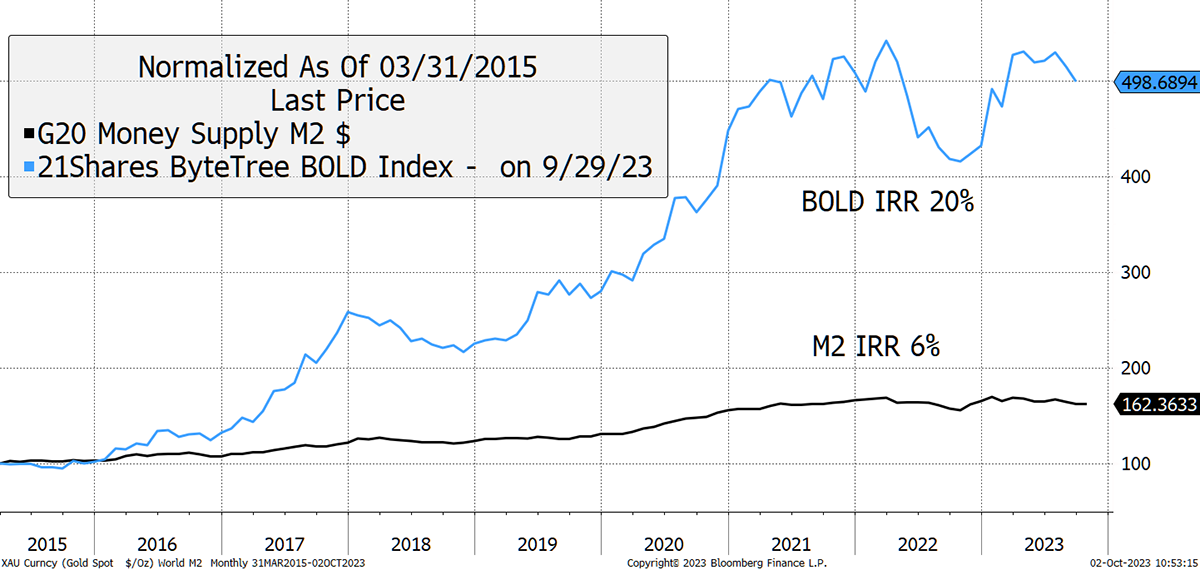
BOLD gives investors exposure to the two most liquid alternative assets on a risk-weight basis. This is a highly efficient asset strategy that has mirrored the growth in the global money supply more closely than any other mainstream and liquid asset combination.
BOLD1 Has Been an Effective Hedge Against Global Monetary Supply Growth
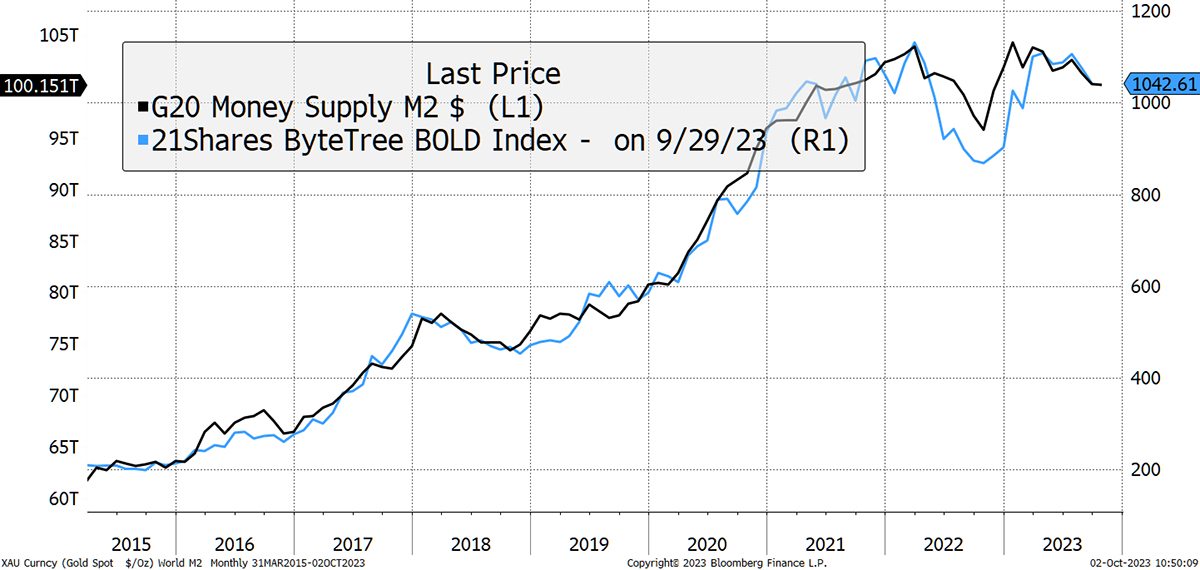
But it has done so at a much higher pace. Since 2015, the G20 money supply has grown at 6.0% per annum, in contrast to BOLD, which has grown at 20% p.a. BOLD is not only a portfolio diversifier but an efficient monetary hedge.
The stress in the financial system is already in dangerous territory as the central banks have hiked rates into an overindebted society. The BOLD Index is an efficient way to participate when the printing presses spring back to life, which is inevitable.
Contact
For more information on investing in BOLD, please contact bold@bytetree.com
Follow @ByteTree on X.com (formerly Twitter)
Further Information
Vinter Index Provider
21Shares BOLD ETP
ByteTree Bitcoin and Gold Research

