

The stockmarket did well in January, which is normally a positive sign for the rest of the year. Yet, with the world in such terrible shape, there is confusion why stocks are up at all. I refer to 2022, when the two biggest problems we faced were a collapsing bond market combined with soaring energy prices. The big risk to 2023 is that these problems haven’t gone away.
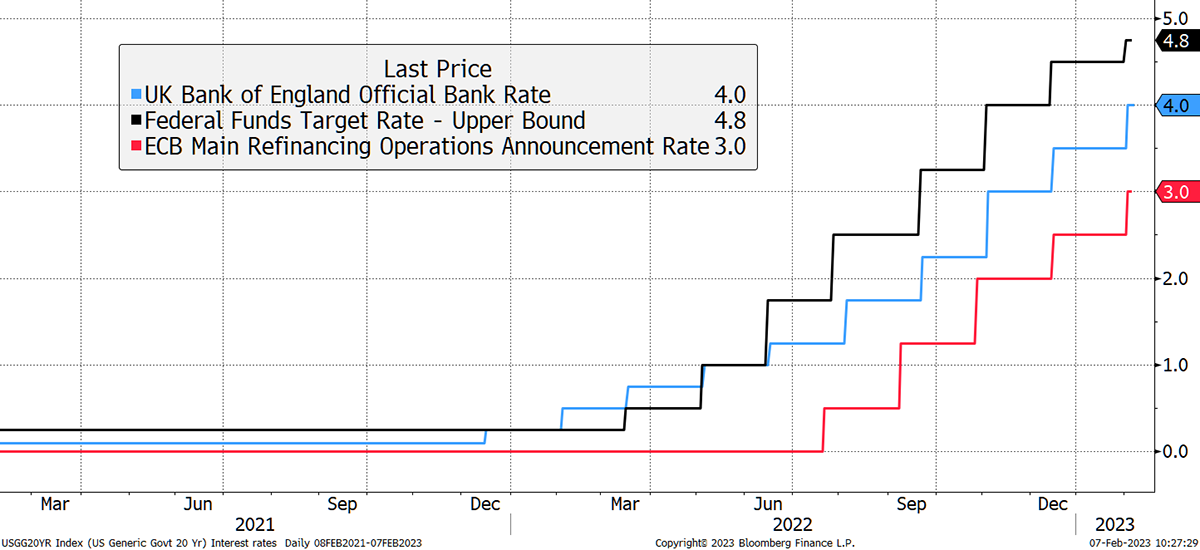
Last week saw several interest rate rises, and I highlight the USA, UK and Europe below. The US Federal Reserve had been “hiking” rates in 0.75% increments last year, slowing to 0.5% in December and 0.25% last week. Despite the fighting talk, that is a clear sign, or at least should be, that the hikes are close to their end.
Interest Rates Keep Rising in the Major Economies
Higher rates normally mean higher bond yields (lower bond prices). The recent US hike moved the bond market, in contrast to the two previous hikes, which didn’t. This move might appear to be small, but it matters because if bonds cheapen (yields rise, prices fall), the risk is that equities must follow.
Were Bonds Surprised by the Recent Hike?
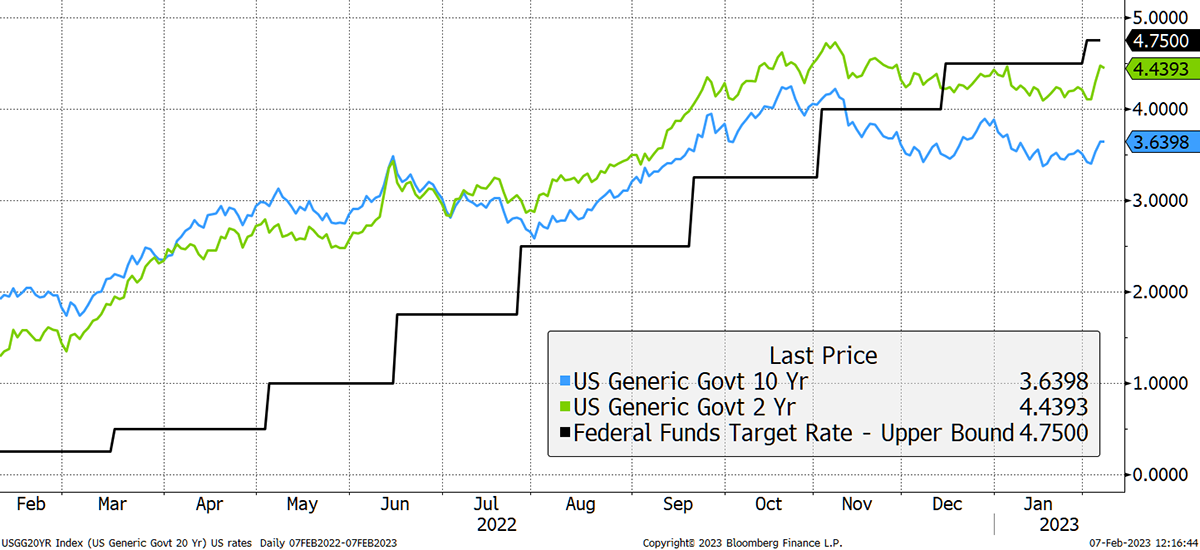
Notice how bond yields have remained stable since October, despite ongoing rate hikes. The recent jump suggests the bond market was not expecting interest rates to rise again.
Going back to the conversation we had last year about the relationship between equities and bonds, I show how close they have become. Since the rate hike last week, the 30-year bond yield rose by 0.2%, which caused the price of the bond (black line) to fall by 4%.
Equities and Bonds are Moving Together
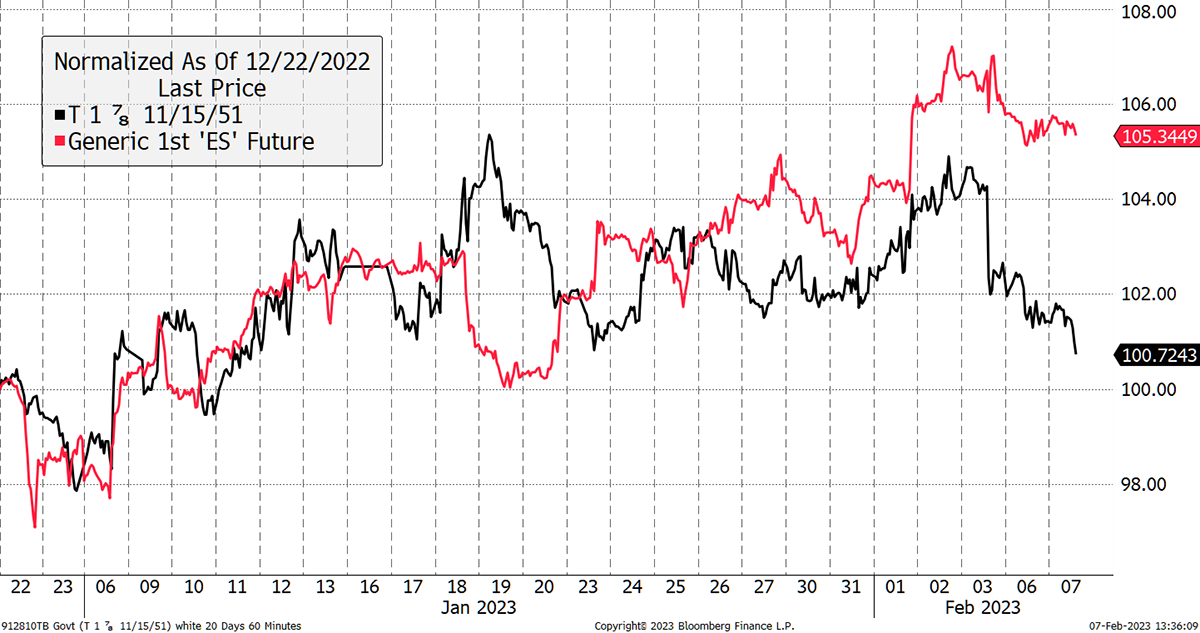
Note: This fall in bonds also shook precious metals.
Should that make us concerned about the stockmarket (S&P 500 red line)? It probably should because the most important relief in recent months has been the stability of bonds. If they start falling again, that could become a problem for equities.
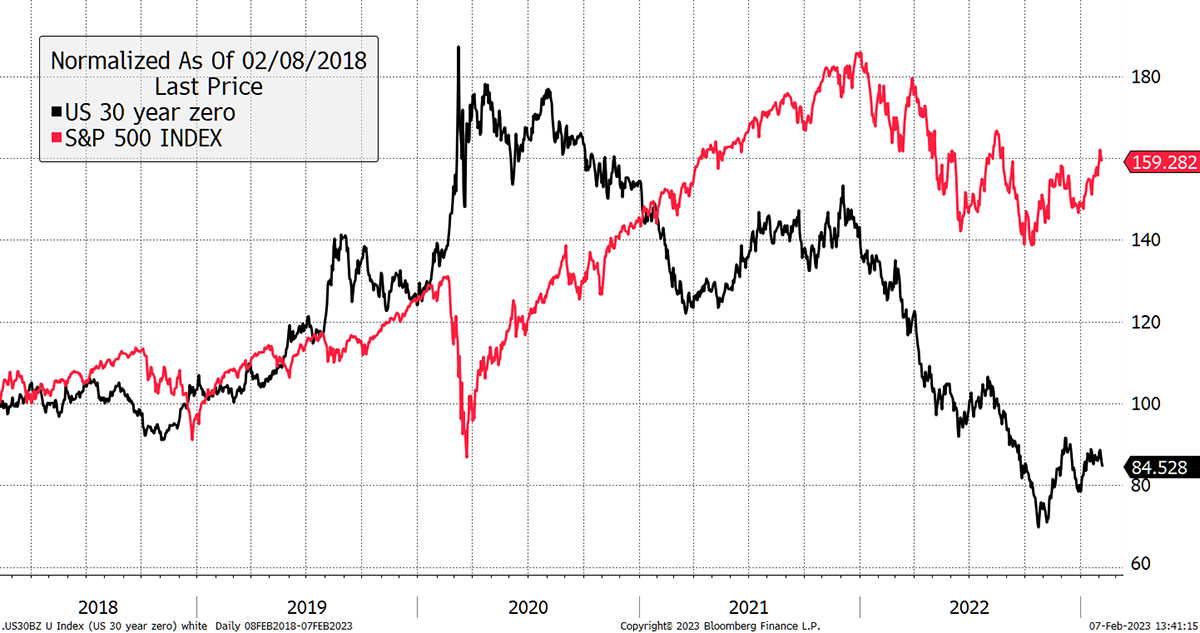
Looking at the equity vs bond relationship over five years, we can see the regime change. Pre-2021, equities and bonds moved inversely, and since 2021, they have moved together. As things stand, that means that when bonds fall, equities must follow.
A Shift in Correlation
When two assets move together, they are said to be correlated, and if they move inversely, uncorrelated. Looking at bonds and equities since the 1960s, they have spent many years correlated. It was only between 2000 and 2021 that they were negatively correlated, which investors have come to assume is the norm.
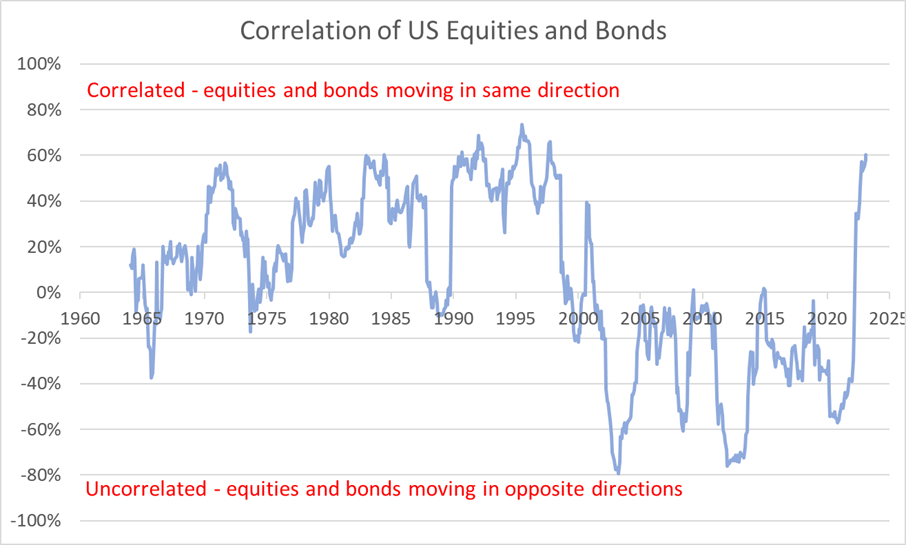
When interest rates are low and falling, while the economy has been growing, investors have sought higher returns from equities. This has been the case since the late 1990s, with bonds providing a buffer when things went wrong.
Yet at other times, when safe assets such as cash and bonds offered reasonable real returns, and when the economy had been sluggish, there was less demand for equities, and their prices were more closely aligned with bonds.
It makes sense because bonds and equities are in competition to attract investors, and the more credible bonds become, the harder it is for equities to differentiate themselves, especially in the absence of economic growth. The only way to become more appealing is to become cheaper and, therefore, less risky.
This is why my equities versus bonds chart is so important, especially now that correlation is so high. It is perfectly reasonable for bonds to fall when the economy is accelerating, and equities offer good value. After all, that is what a normal recovery looks like and can be seen in 1994, 2003, 2009 and so on.
Yet this stockmarket recovery has begun from a period where equities have already massively outperformed bonds. Can they really keep going from here? Without support from bonds, I doubt it.
Equities Have Massively Outperformed Bonds
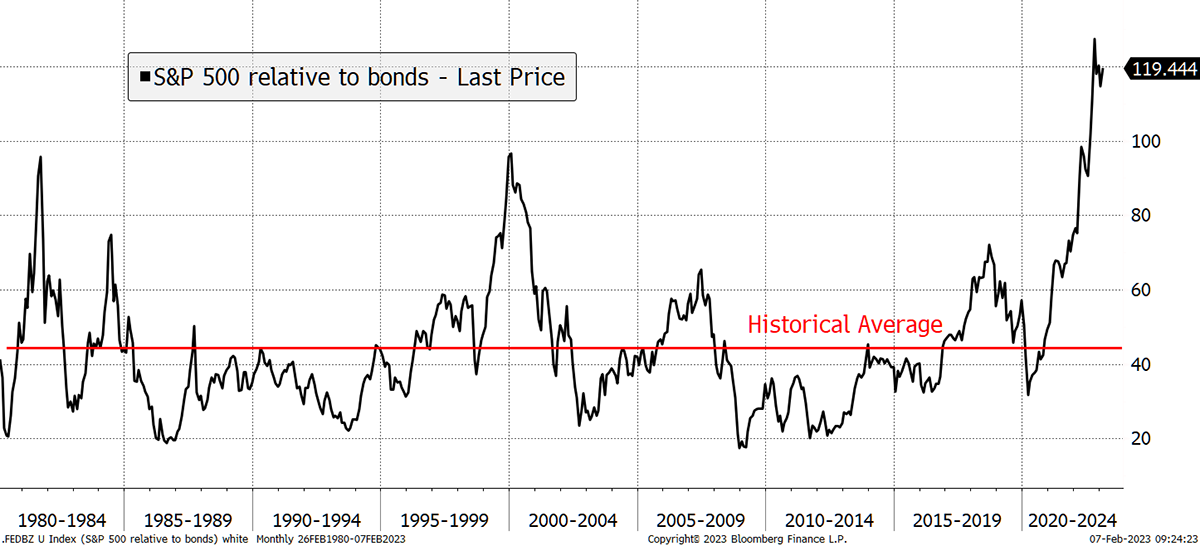
Part of my enthusiasm for buying equities last autumn was that the war against inflation would be won, and bond yields would not only stabilise but also gradually head back down to lower levels. That would mean the black line above would fall, and the downward pressure on equity valuations would ease.
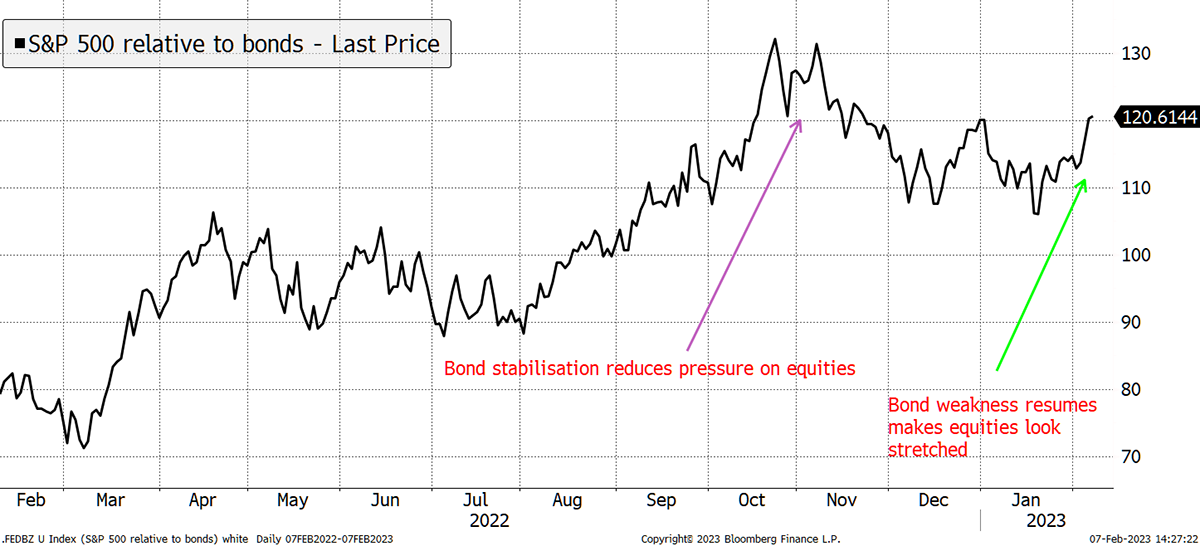
Zooming in on the chart above, the equity to bond relationship was most stretched in October, around the time of the Truss/Kwarteng growth policies. It was an unfortunate time to make that speech despite some of the policies being good ideas. The bond market was already in trouble, and pro-growth policies piled on additional pressure. Much better to adopt pro-growth policies during a recession, when bonds are well bid, than at times of full employment when they are not.
In October, bonds stabilised and subsequently rallied, which took the pressure off equities and paved the way for the “everything rally”. But now bonds are falling again, and if equities don’t follow, this relationship will soon become even more stretched than it was last October, which would spell trouble.
Equity Outperformance Over Bonds Resumes
That second chart I showed you, “Were Bonds Surprised by the Recent Hike?”, puts the US cash rate at 4.75% and the 10-year bond yield at 3.65%, which is a 1.1% gap. Since the 10-year yield is 1.1% below the cash rate, the “yield curve” is said to be “inverted”, which normally forecasts a recession. Few of us would disagree, with the caveat being there are more people employed in the developed world than at any time in history.
The Yield Curve Forecasts a Recession
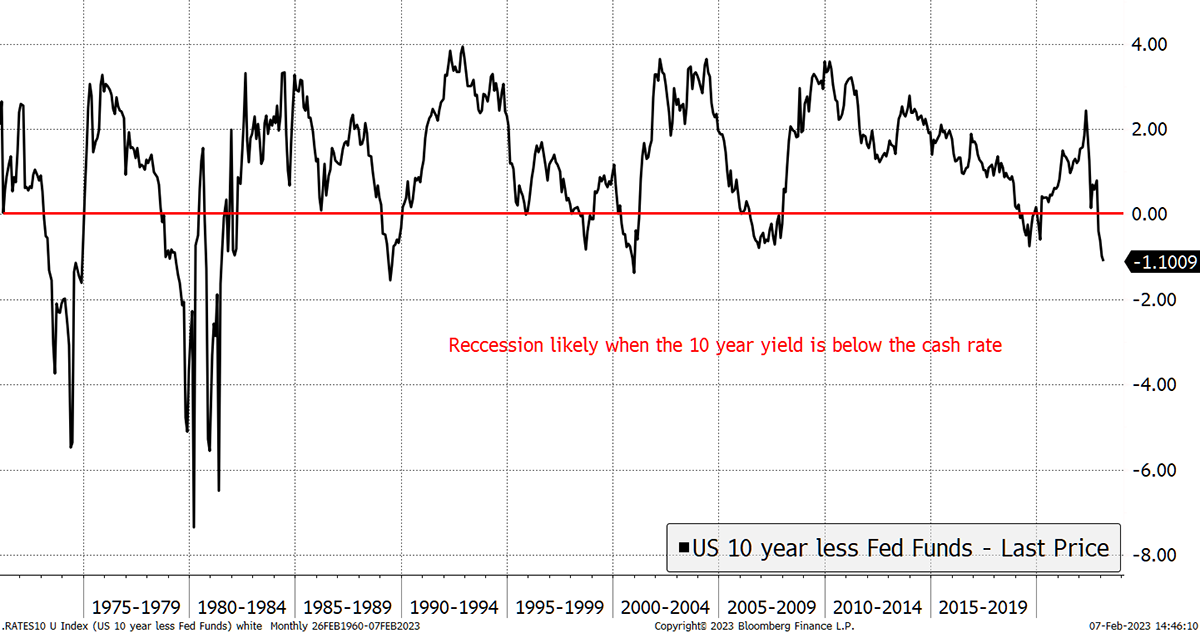
There’s probably a recession coming, with the optimists thinking we’ll get away with a “soft landing”. Few see a boom over the horizon. Ironically, this pessimism is not such a bad thing for stocks as when inflation is put to bed, the central banks will cut rates, and the yield curve will no longer be inverted. Bonds will be supported and equities will muddle through. It’s sort of back to the pre-pandemic era.
This mainstream view is accompanied by forecasts for interest rates to drop back down to 3% or 3.5% in 2024.
Ironically, that is better than a strong recovery with high demand for goods. If that happened, the bond yield would need to rise substantially - by 1.1% at the very least.
Remember I said the 30-year bond yield rose by 0.2% over the past week, and that caused the long-bond price to fall by 4%?
Well, a “normalisation” of the bond yield would see a 1.1% rise, which would lead to a near 26% fall in the price of the long bond. That would make equities would look very streched. It soon becomes clear that normalisation is a very messy business.
Inflation Must Cool to Avoid a 30% Fall in Equities
The system needs inflation to fall, which will enable the central banks to cut interest rates. That way, the yield curve flattens without causing bond prices to collapse while removing the downward pressure on equities. Thank goodness for that, but this scenario needs inflation to be well and truly dead and buried.
Assuming that the pandemic was purely a supply shock, then all is well, and we can relax. A supply shock implies things were temporarily disrupted and are returning to normal. I buy into that, but it is other sources of inflation that worry me more.
What if inflation comes from another angle? If the jobs data remains strong, and wages keep rising, then inflation will linger for longer.
Then there’s the energy crisis. Can we be sure it is over? I am sure Putin will not cave in easily.
I am much more convinced that the supply shock is behind us than that energy and wages are contained.
I know this is a complex subject, but it is important. It is a reminder that all we need to see for asset prices to fall, and potentially collapse, are higher bond yields. The recent rally has been larger than it deserves to be and the margin for error has shrunk. If bond yields rise, it will be right to turn defensive. And quickly.
Just warming you up!
Action:
No action
Postbox
You recommended the CG Real Return fund and mentioned that the real yield on 10-year US index linked bonds was around 1.5% p.a. If I assume that inflation would average out to 3.5% over the next 10 years, the nominal return on these bonds would be around 5% p.a., right?
Correct.
I’m trying to reconcile this figure with the yield for the CG Real Return fund, which seems to be around 1.7% p.a. Even if I add back the 0.39% total expense ratio, I get a yield just slightly above 2%, which seems very low. Is part of the income from the bonds accumulated back into the fund instead of being paid out to unit holders? Or is the prospective yield substantially higher than the 2% historical yield disclosed by the fund manager? Or is the coupon yield on these bonds very low, which means that part of the return would come from capital appreciation?
In bonds, there is the “running yield”, which you are referring to, and the “gross redemption yield” (GRY), which includes capital gain. If you buy a bond for £90, which redeems at £100 in the future, your GRY exceeds your running yield. In the case of inflation-linked bonds (index-linked), this will make up most of the return as the £100 at maturity will become £100 plus inflation. In your 3.5% example, that £100 becomes £141.
There are other factors relating to the coupon’s size, but the main point is that the inflation protection that is paid out is modest compared to that accumulated in the return of principal.
I guess I’m looking for some reassurance that the bonds really do provide a reasonable nominal return at their current price without having to rely on excessively high inflation rates to make them attractive.
The point here is that TIPS currently return a 1.35% real yield. That is regardless of whether inflation is high or low. Bonds are supposed to provide certainty, and these do. Last year, when that real yield was -1%, guess what? They were certain to lose money, and that is exactly what happened. The current real yield is pretty good and if the Fed cut rates, you make money.
US 10-year real yield
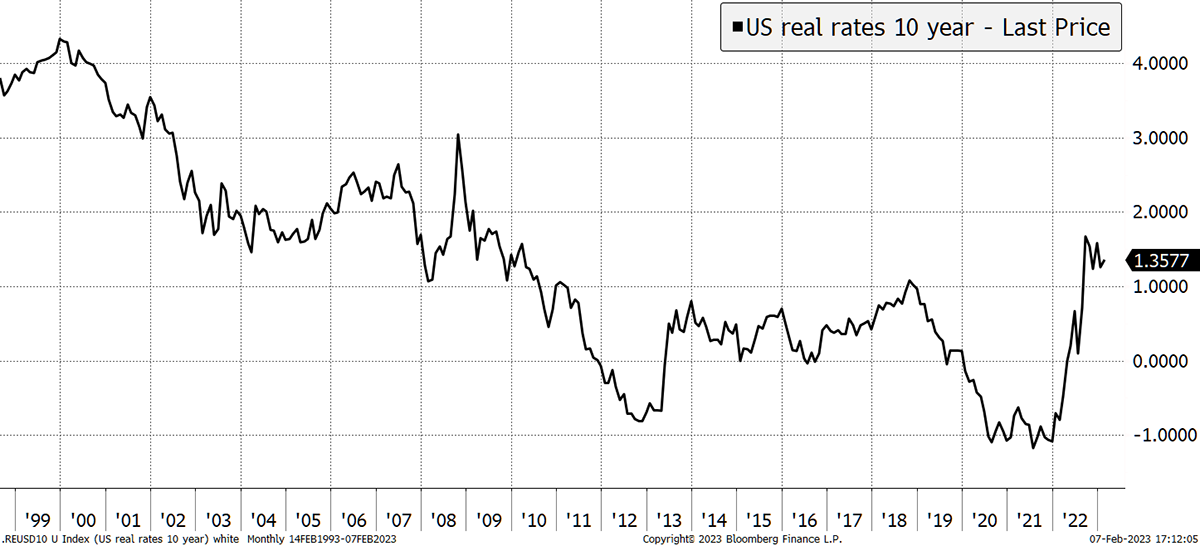
I believe the 20-year TIPS are currently a lower risk alternative to gold. Once this gap closes, we’ll revert back to gold.
I’ve been avoiding bonds like the plague for several years now, so I’m trying to convince myself that it’s actually safe to start buying bonds again. Many thanks for the excellent guidance that you’ve been providing over the years, helping us to navigate the investment markets in a balanced and successful way.
Me too. We have 5% in Emerging Market bonds which offer good value, and some TIPS instead of some of our gold. The Japanese bonds are basically cash. Having been minimal for years, I do not believe our bond exposure is very high, but it is time to be above zero. It is still zero in developed market conventional bonds.
Thank you for the compliment.
Portfolios
A Note for New Readers
The design of The Multi-Asset Investor investment process is to blend Soda and Whisky according to the level of risk you wish to take. Hopefully, the clue is in the names as to which portfolio carries more risk. Most investors would be best suited to 80% in Soda and 20% in Whisky (a less risky blend) or 60% in Soda and 40% in Whisky (a riskier blend).
Example
A recommendation is often, but not always, 5% of either portfolio. If I added 5% of ABC in Whisky and you followed a 40/60 Whisky/Soda approach, then ABC would be 5% x 40% = 2% of your overall pot. If you followed a 20/80 Whisky/Soda approach, then ABC would be 5% x 20% = 1% of your overall pot.
This approach enables the Whisky Portfolio to pursue more adventurous opportunities than if it was designed to be the entire strategy. The inevitable, and hopefully infrequent, failure of some individual recommendations means the maximum loss is limited to between 1% and 2% of the overall pot, which is within a reasonable scope. Cautious investors can be 100% Soda, but a little Whisky brings your investment journey to life and will hopefully boost returns in the long run.
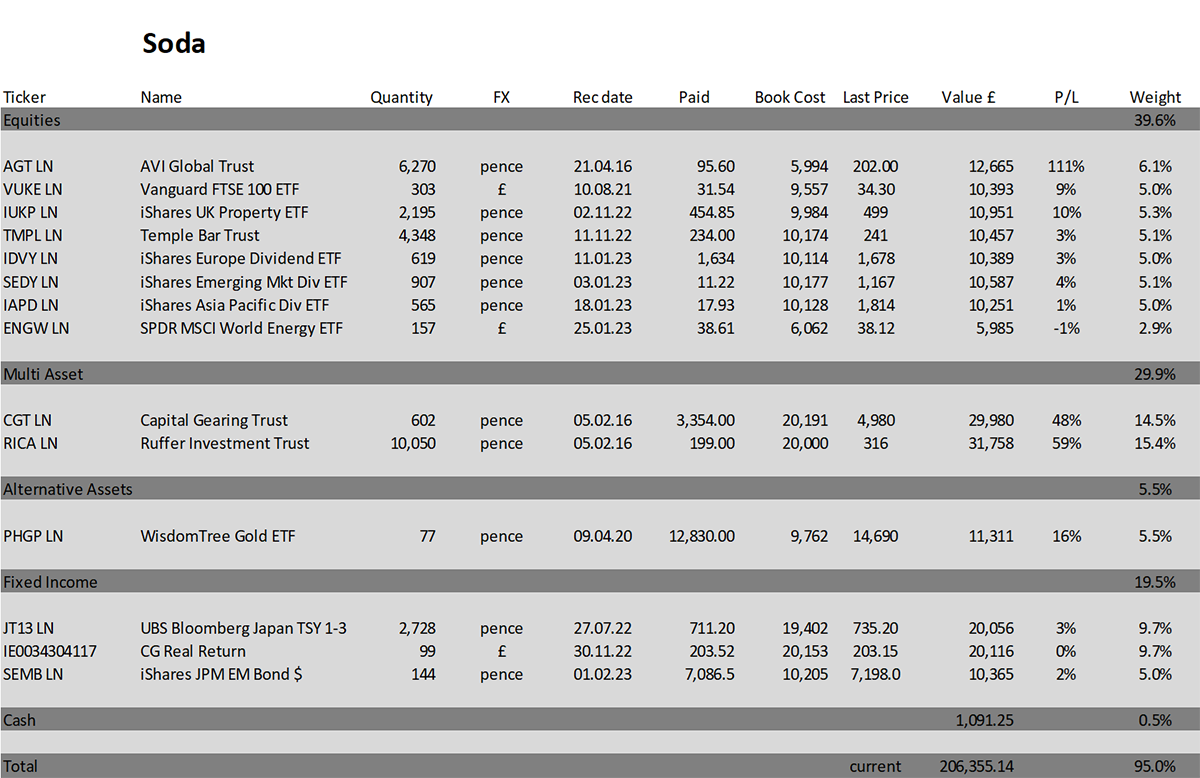
Soda - a long-term, low turnover portfolio investing in funds, exchange-traded funds (ETFs) and investment trusts (including Berkshire Hathaway). The Soda portfolio is up 3.1% this year and is up 106.4% since inception in January 2016.
2016   +21.7%
2017   +8.8%
2018   -1.8%
2019   +19.6%
2020   +8.9%
2021   +14.3%
2022   +3.5%
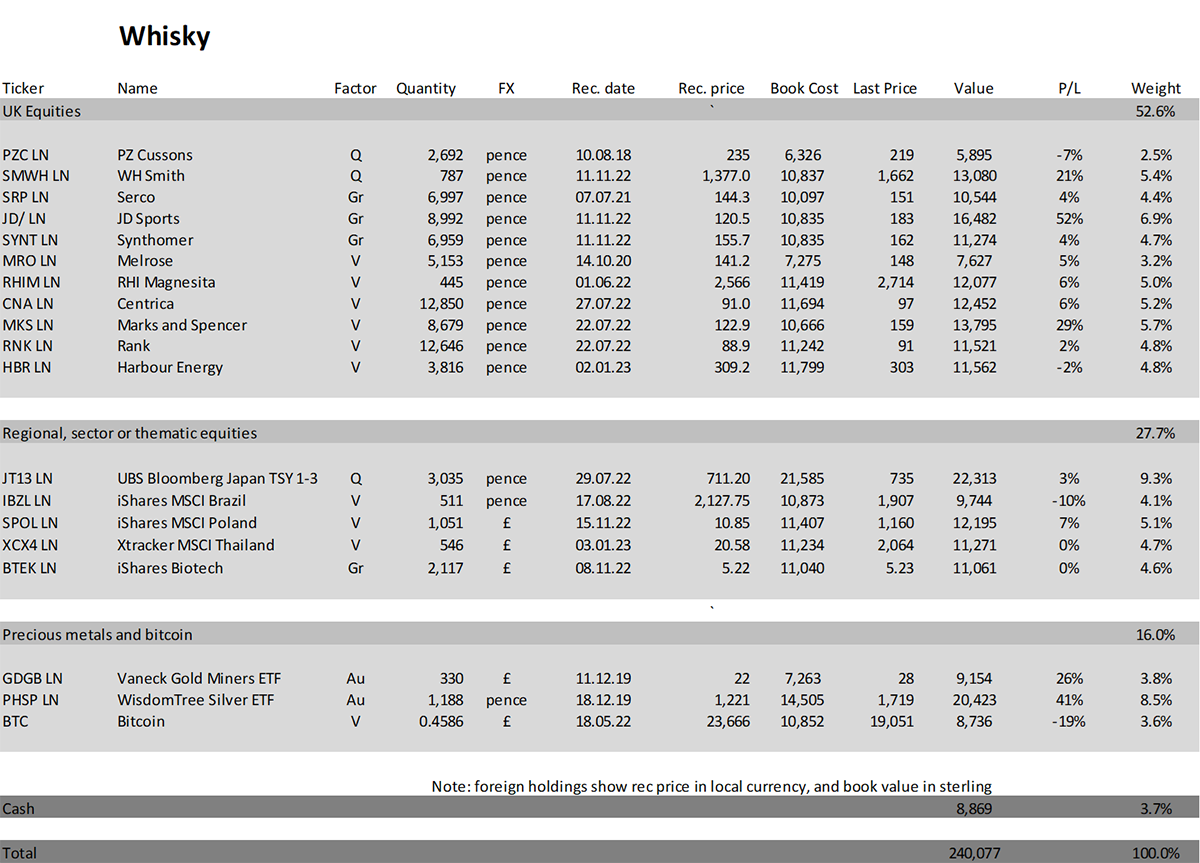
Whisky - a tactical, actively traded portfolio investing in stocks in the FTSE 350 Index, investment trusts, global ETFs and bitcoin. The Whisky portfolio is up by 7.5% this year and up 140.2% since inception in January 2016.
2016   +24.7%
2017   +5.4%
2018   -4.3%
2019   +21.4%
2020   +20.4%
2021   +12.9%
2022   +8.0%
Summary
I was very sad to hear the news about the earthquake in Turkey and Syria. It was a reminder that not all disasters can be blamed on the human race, but the ability to help in the aftermath most certainly is.
Please let me know your thoughts by emailing me at charlie.morris@bytetree.com, or tweet me @AtlasPulse.
Many thanks,
Charlie Morris
Editor, The Multi-Asset Investor
General - Your capital is at risk when you invest, never risk more than you can afford to lose. Past performance and forecasts are not reliable indicators of future results. Bid/offer spreads, commissions, fees and other charges can reduce returns from investments. There is no guarantee dividends will be paid. Overseas shares - Some recommendations may be denominated in a currency other than sterling. The return from these may increase or decrease as a result of currency fluctuations. Any dividends will be taxed at source in the country of issue.
Funds - Fund performance relies on the performance of the underlying investments, and there is counterparty default risk which could result in a loss not represented by the underlying investment. Exchange Traded Funds (ETFs) with derivative exposure (leveraged or inverted ETFs) are highly speculative and are not suitable for risk-averse investors.
Bonds - Investing in bonds carries interest rate risk. A bondholder has committed to receiving a fixed rate of return for a fixed period. If the market interest rate rises from the date of the bond's purchase, the bond's price will fall. There is also the risk that the bond issuer could default on their obligations to pay interest as scheduled, or to repay capital at the maturity of the bond.
Taxation - Profits from investments, and any profits from converting cryptocurrency back into fiat currency is subject to capital gains tax. Tax treatment depends on individual circumstances and may be subject to change.
Investment Director: Charlie Morris. Editors or contributors may have an interest in recommendations. Information and opinions expressed do not necessarily reflect the views of other editors/contributors of ByteTree Group Ltd. ByteTree Asset Management (FRN 933150) is an Appointed Representative of Strata Global Ltd (FRN 563834), which is regulated by the Financial Conduct Authority.
© 2026 ByteTree Group Ltd