

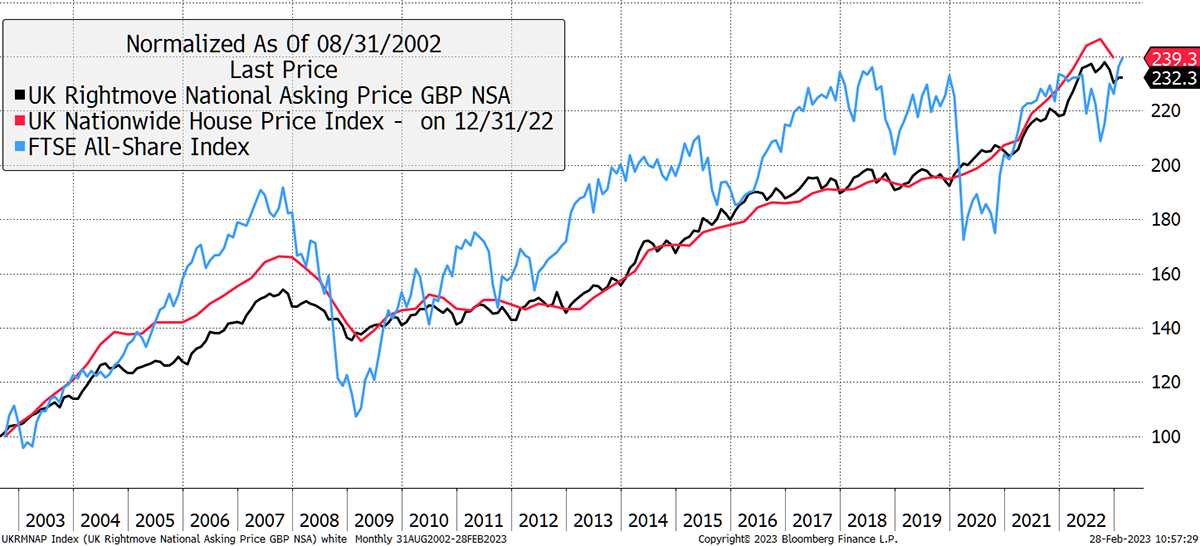
A typical UK house has risen by 140 times since the 1950s. Over a similar timeframe, houses have broadly done twice as well as the stockmarket (excluding dividends). This defies all reasonable expectations because homes are less risky than equities, and long-term risk-seeking investors are supposed to be compensated with higher returns. With low rates behind us, I ask whether housing is cruising for a bruising?
To set the scene, I show the FTSE All Share Index rebased against the Nationwide UK House Price Index (data to the 1950s) and the more recently created Rightmove Index since 2002. It is reassuring to see them confirm one another. Dividends are excluded to compare capital values. If they were included, I would need to show implied rents as well, and that data is unavailable. House prices have just registered a downtick.
Shares and Houses
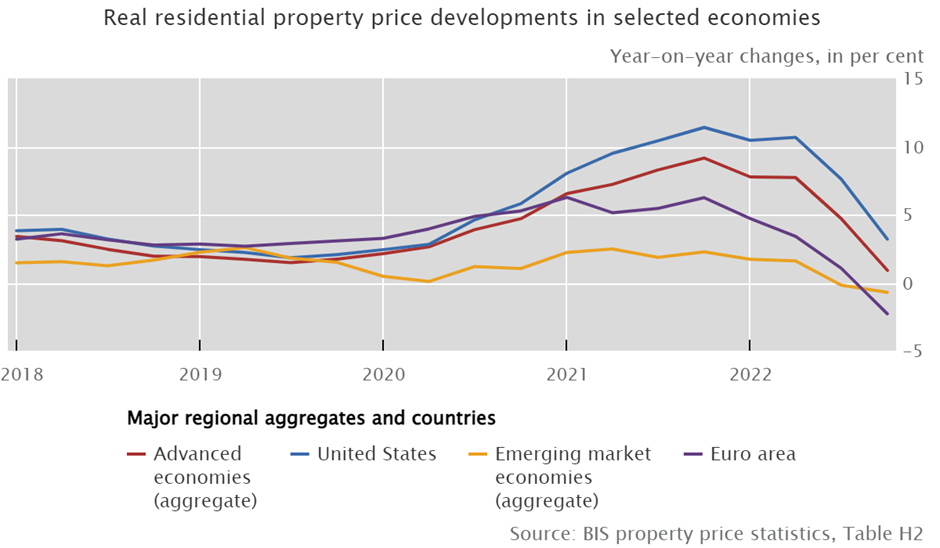
Higher interest rates are generally bad news for asset prices, not just for equities and bonds, but for houses too. Looking around the world, house prices are cooling, and all fingers are pointing at the surge in mortgage rates. In 2021, they were the lowest on record, and it is a similar story worldwide. The Bank of International Settlements (the banker’s bank) publishes global housing data. In all regions, the pandemic saw house prices rise, and now they are falling. The UK is not alone.
Global House Prices Are Falling
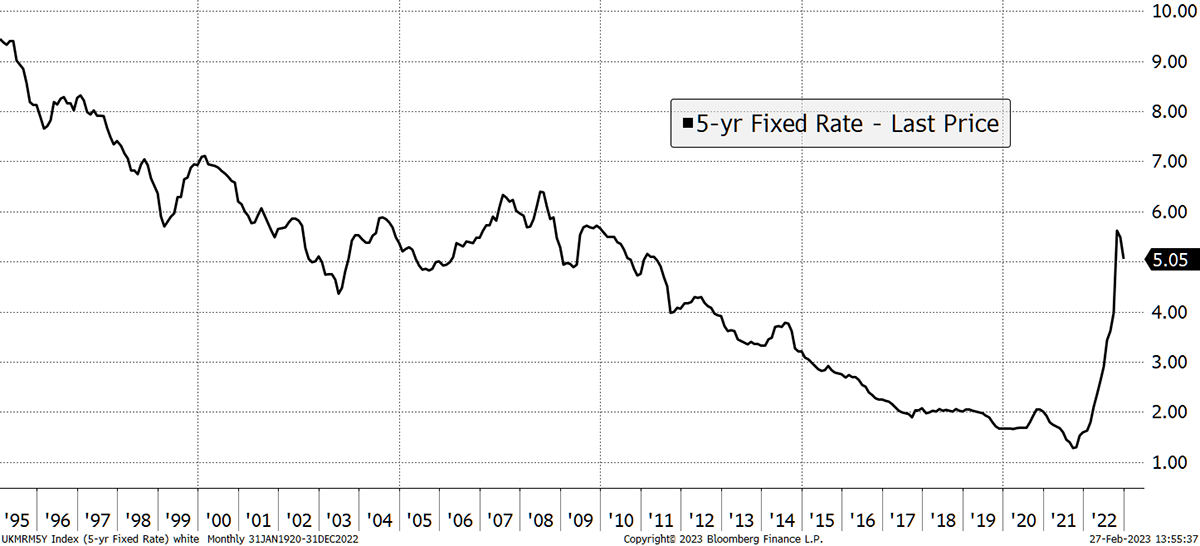
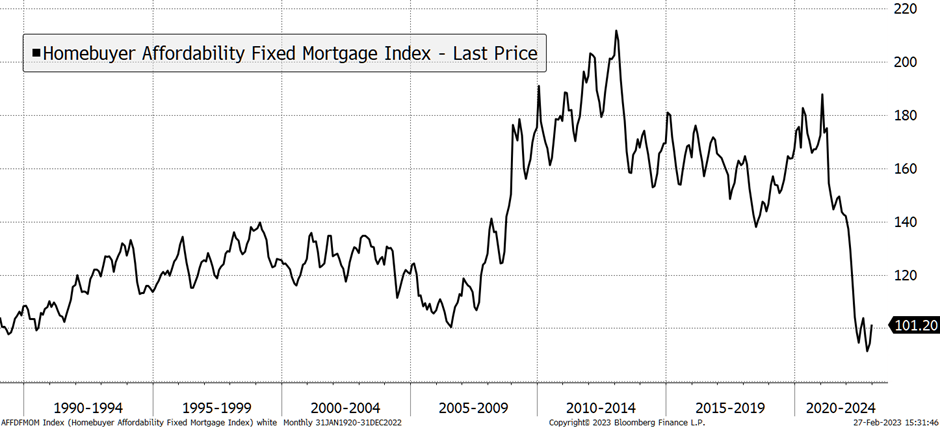
The smoking gun is higher mortgage rates. These have rocketed at breakneck speed, and you would have to go back to the late 1980s to find a comparable surge in the cost of borrowing.
Mortgage Rates Have Surged
The property bulls claim there is nothing to worry about, but then again, they always say that. They claim there is excess demand for housing driven by a structural shortage of supply. I disagree with this because demand for “shelter” is reflected by rents rather than prices. Over recent years, house prices have significantly outpaced rents, resulting in historically low rental yields today.
Steady Rents
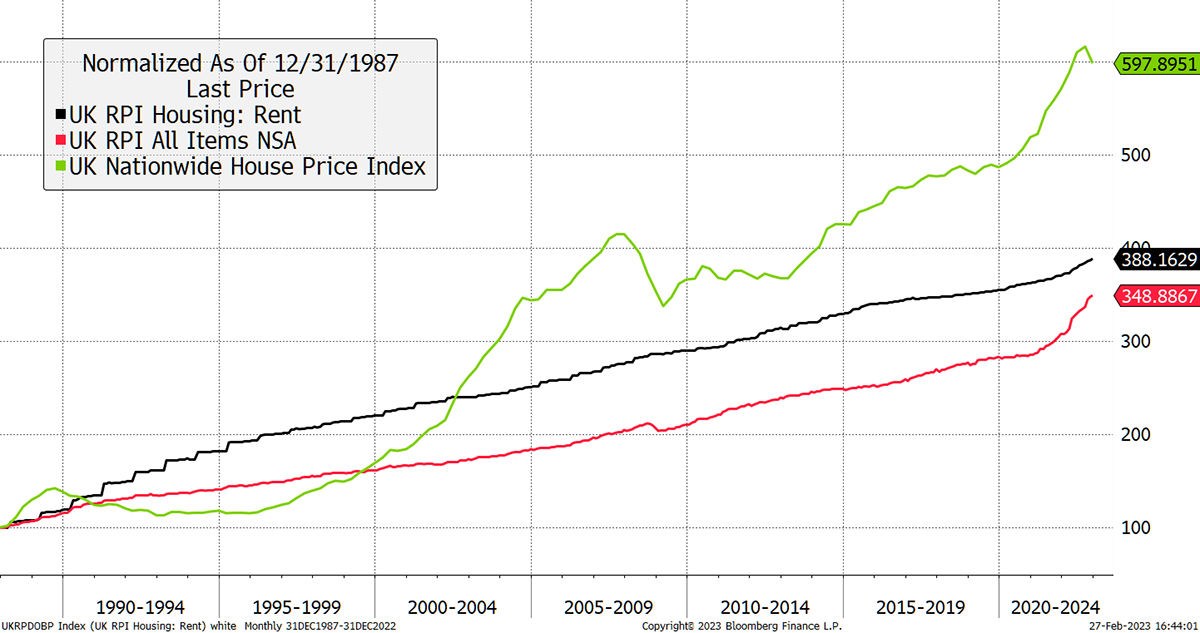
Here are a few observations from the above chart:
- Rents tend to rise steadily and have not seen a down year.
- Rents rose faster than inflation in the early 1990s.
- Rents have risen slower than inflation since 2009.
- House prices are cyclical.
- Following the 1989 peak, prices fell 20% in nominal terms and 37% in real terms. They took 99 months to make a new high.
- Following the 2007 peak, prices fell 19% in nominal terms and 25% in real terms (the low was in 2013) and took 81 months to make a new price high.
- Between 1995 and 2022, a typical landlord saw a 67% reduction in rental income compared to property value.
Unaffordable
We all know the young wonder how they will ever afford to buy a house. The only reasonable explanation is that prices are too high. Yet remarkably, every time the UK government tries to resolve this problem, the result is higher prices. Their “help to buy” schemes have done little for the young, but the property developers have been very grateful. What they need is lower prices, which will one day be inevitable. The price can only ever be what that generation can afford to pay.
The affordability problem has been illustrated by Duncan Lamontwith this chart, dating back to 1845, that links average earnings to average house prices. Unsurprisingly, houses were dirt cheap during the First World War. They held steady between 4 and 6 times the average income from the 1920s until the mid-1990s, only to surge thereafter. The last time they reached current levels of (un)affordability was in 1876, nearly 150 years ago. Yet another example of the monetary madness seen in the 21st century.
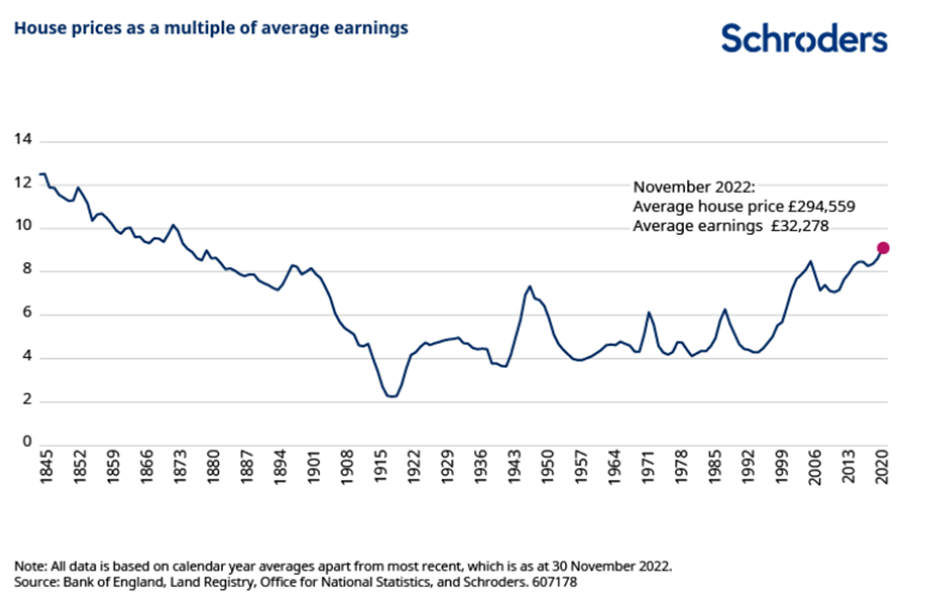
Lamont’s report highlights the three factors behind falling prices relative to incomes in the 19th century. More houses were built, they were smaller, and incomes rose. It is hard to imagine any of those being repeated in the future on such a large scale.
Looking at affordability in the USA, we get a similar message. The last time house prices were this high, relative to what buyers could afford to pay, was in 2006. The subsequent crash in 2008 not only brought down prices by 20%, but the cost of borrowing too. For a short time after 2010, it was a good time to buy a house. Alas, no longer.
Unaffordable Houses in the USA
Today, US house prices are 65% higher than at their 2006 peak and 100% above the 2012 trough. Don’t forget that the 2008 financial crisis had its roots in subprime US mortgages and took down the entire global economy. It is astonishing how quickly financial mistakes of historic proportions can repeat themselves.
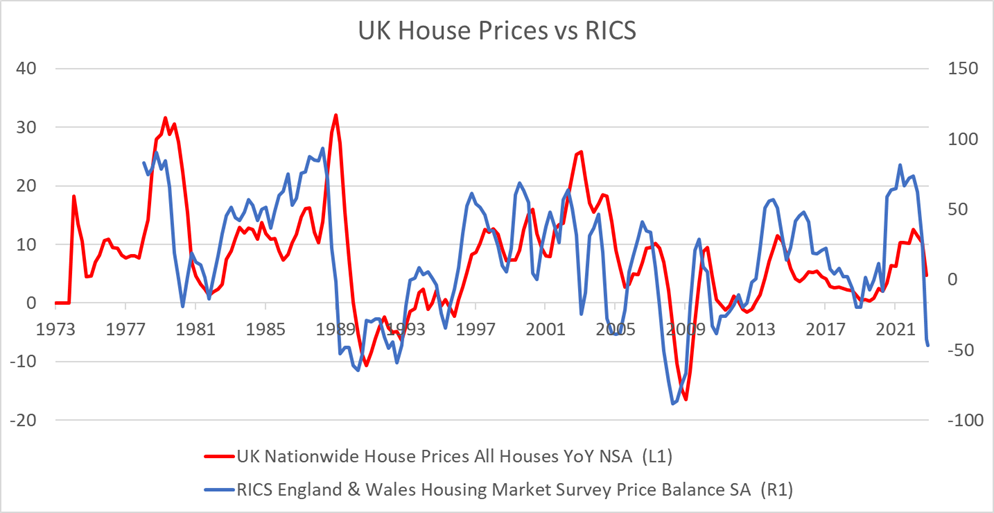
Leading Indicators
We have established that house prices are too high. Now that rates have surged, they are also unaffordable. The RICS Survey is published by the Royal Institute of Chartered Surveyors and dates back to the 1970s. It has been a remarkable leading indicator of future changes in house prices. The recent slump is on par with the late 1980s. That correction was also attributed to higher interest rates, as no doubt some of you remember.
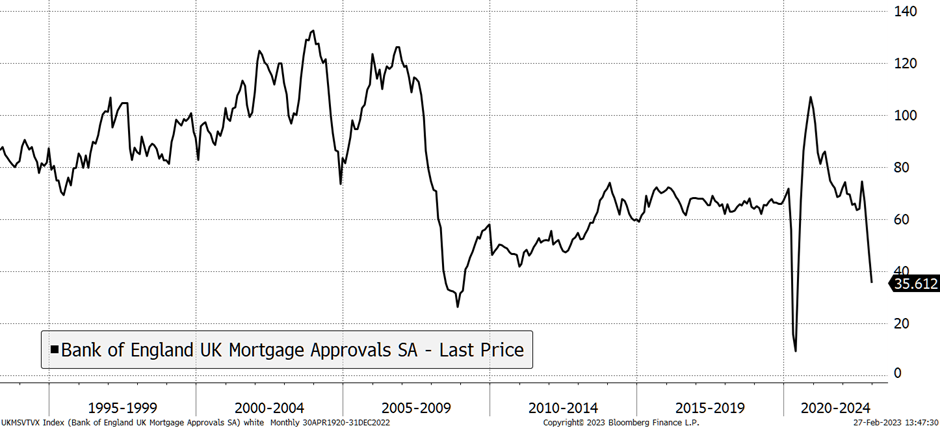
We have also seen a drop in mortgage approvals. That either means fewer people are applying for mortgages or are being awarded them. It is another clue that all is not well.
Falling Approvals
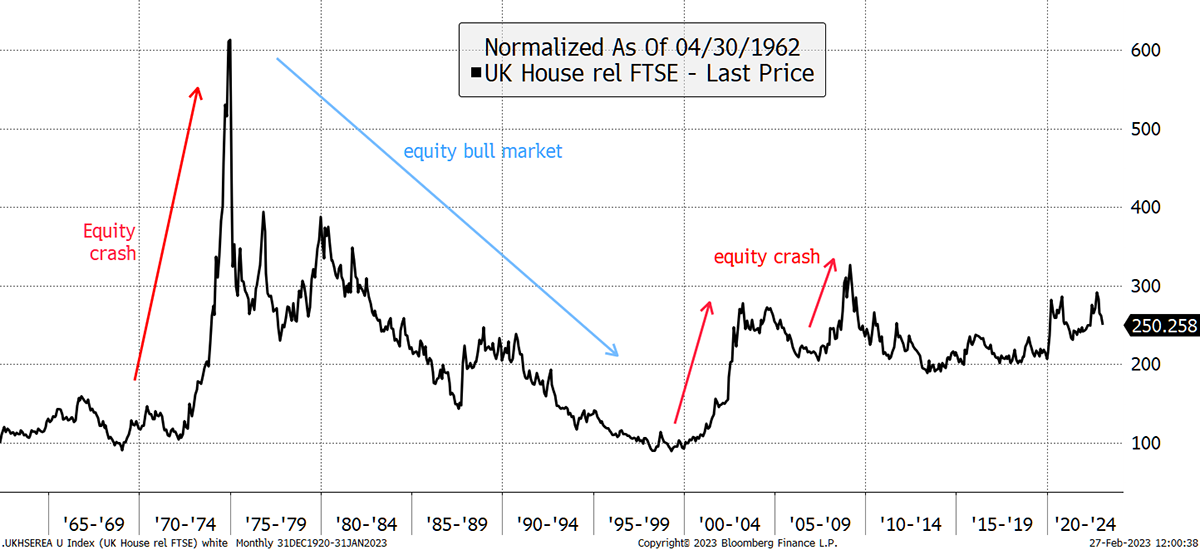
Going back to times past, I wanted to examine the relationship between UK house prices and the FTSE All Share. During stockmarket crashes such as 1974 and 2000/2, houses reliably outperformed stocks, but on both occasions, they were affordable to start with (according to Schroders). In 2008, they fell less than equities. Looking ahead, it is not clear which way they will go. It is highly doubtful that houses prove to be a safe haven at current levels.
Houses versus Shares?
Then there are the housebuilders, where I sometimes get asked if there is an opportunity. I show Taylor Wimpey (TW) and Persimmon (PSN) price to book value. Although imperfect, it gives an idea of the valuation compared to the fair value of the assets held, mainly land. Despite heavy share price falls, they still trade above book value.
Are House Builders Cheap?
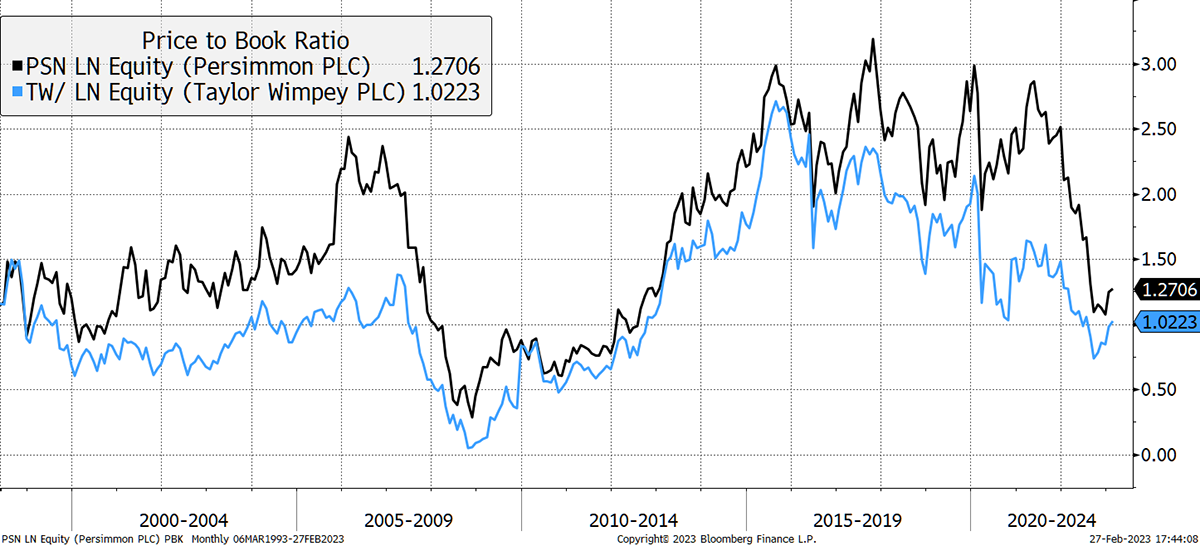
Notice how this cycle saw them reach 3x book, even higher than seen in 2006/7. It is staggering and was fueled by the government’s help to buy schemes. Proof, if it was ever needed, that those subsidies did more for the house builders than the first-time buyer. The pre-2005 norm was 1.5x book.
In 2008, TW touched 0.05x book. That’s because it nearly went bust. The house builders learnt their lesson as today they are debt free and sit on cash, which has dumbed down their business model. It has made them less risky for sure, but they are some way from being undervalued and do not fully factor in a significant downturn in prices, which would squash their margins.
Implications
A major correction in house prices would be a very serious problem for the economy, and I do not believe the markets are taking this risk seriously. Although I have mainly shown UK data, it is a global phenomenon and has the potential to be a highly destructive force.
There are two problems. Firstly, house prices are too high. That can be fixed with a fall in prices, higher wages (inflation), or, most likely, a combination of the two.
Secondly, borrowing costs are rising from ultra-low levels. Unfortunately, this is not a problem, but the normalisation of an extraordinary era of cheap money, which we will not return to. Higher rates will squeeze homeowners. This is a more painful fix.
Bond Yields Keep Rising
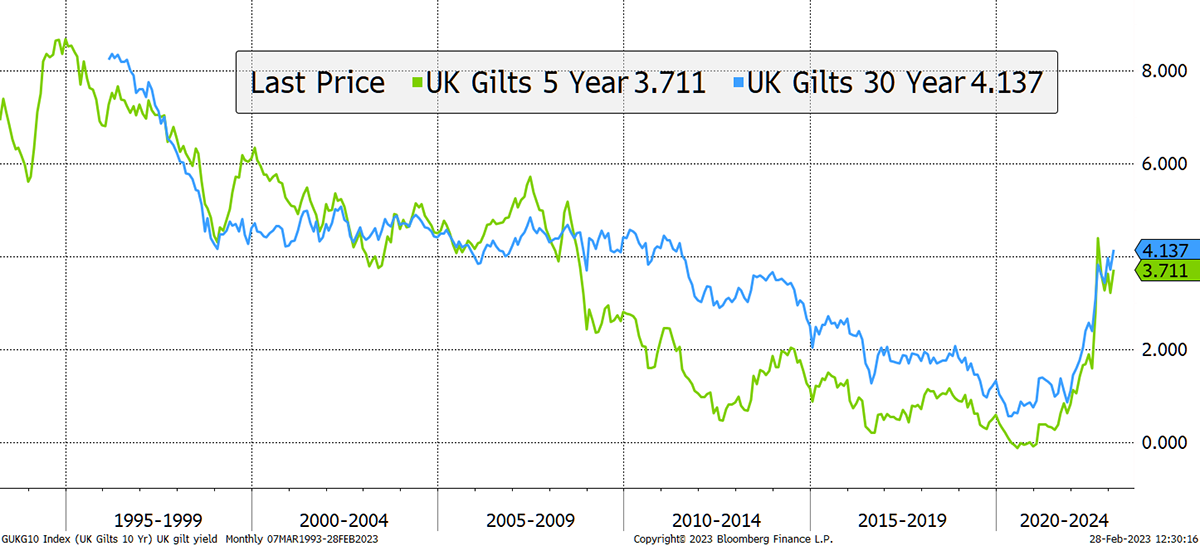
I remain highly concerned by the continued increase in bond yields which has the potential to derail not just houses but financial markets in general. The world index is down 5% since 2 Feb, following a strong January. That isn’t much, but it has coincided with the rise in yields. I don’t believe there is much room for yields to rise, although it is hard to quantify.
Action:
No action.
Postbox
It just does not make sense to me that the oil companies would not WANT to pass on some of their profit by selling oil at a lower price to avoid the mayhem the world finds itself in at this time. Presumably, OPEC(+) government groups take profit from their own oil producers in some way, but for the oil producers to still retain and not pass on their own profits all seems self-destructive as they too have to live in a world with the resulting massive cost of living rises and resulting mayhem.
The saying goes that the best solution to high oil prices is high oil prices. That is because high prices reduce demand and incentivise production. If producers sold below market price, demand would remain high, and so prices would have no natural way to fall. The whole point of free markets is to balance supply with demand. The alternative is managed markets which try to do the right thing, but history is littered with examples of their failure.
My view on foreign stocks is an overriding yes. I think we should definitely explore other markets. Have you had a look at Argentinian stocks lately?
Straight in at the deep end! I feel that market is twinned with Turkey. I was thinking more along the lines of the USA, Canada and Europe. Maybe one day!
Portfolios
Note for New Readers
The design of The Multi-Asset Investor investment process is to blend Soda and Whisky according to the level of risk you wish to take. Hopefully the clue is in the names as to which portfolio carries more risk. Most investors would be best suited to 80% in Soda and 20% in Whisky (a less risky blend) or 60% in Soda and 40% in Whisky (a riskier blend).
Example
A recommendation is often, but not always, 5% of either portfolio. If I added 5% of ABC in Whisky and you followed a 40/60 Whisky/Soda approach, then ABC would be 5% x 40% = 2% of your overall pot. If you followed a 20/80 Whisky/Soda approach, then ABC would be 5% x 20% = 1% of your overall pot.
This approach enables the Whisky Portfolio to pursue more adventurous opportunities than if it was designed to be the entire strategy. The inevitable, and hopefully infrequent, failure of some individual recommendations means the maximum loss is limited to between 1% and 2% of the overall pot which is within reasonable scope. Cautious investors can be 100% Soda, but a little Whisky brings your investment journey to life and will hopefully boost returns in the long run.
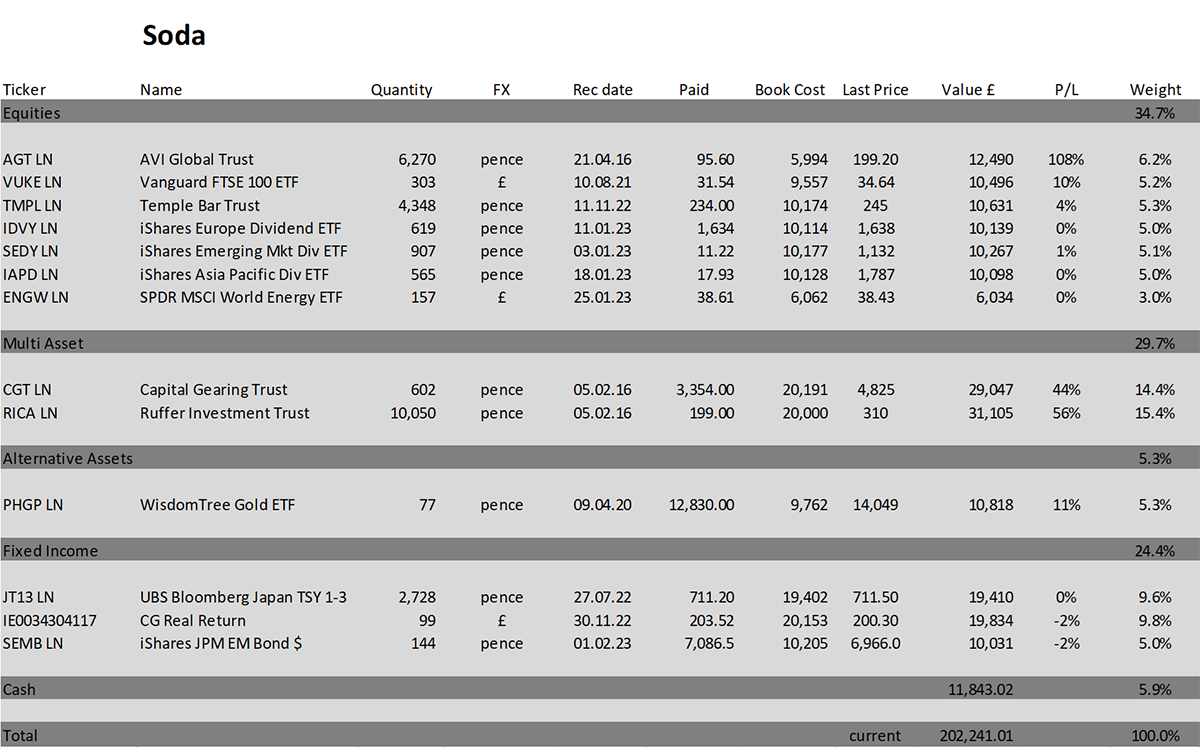
Soda - a long-term, low turnover portfolio investing in funds, exchange-traded funds (ETFs) and investment trusts (including Berkshire Hathaway). The Soda portfolio is up 1.0% this year and is up 102.2% since inception in January 2016.
2016   +21.7%
2017   +8.8%
2018   -1.8%
2019   +19.6%
2020   +8.9%
2021   +14.3%
2022   +3.5%
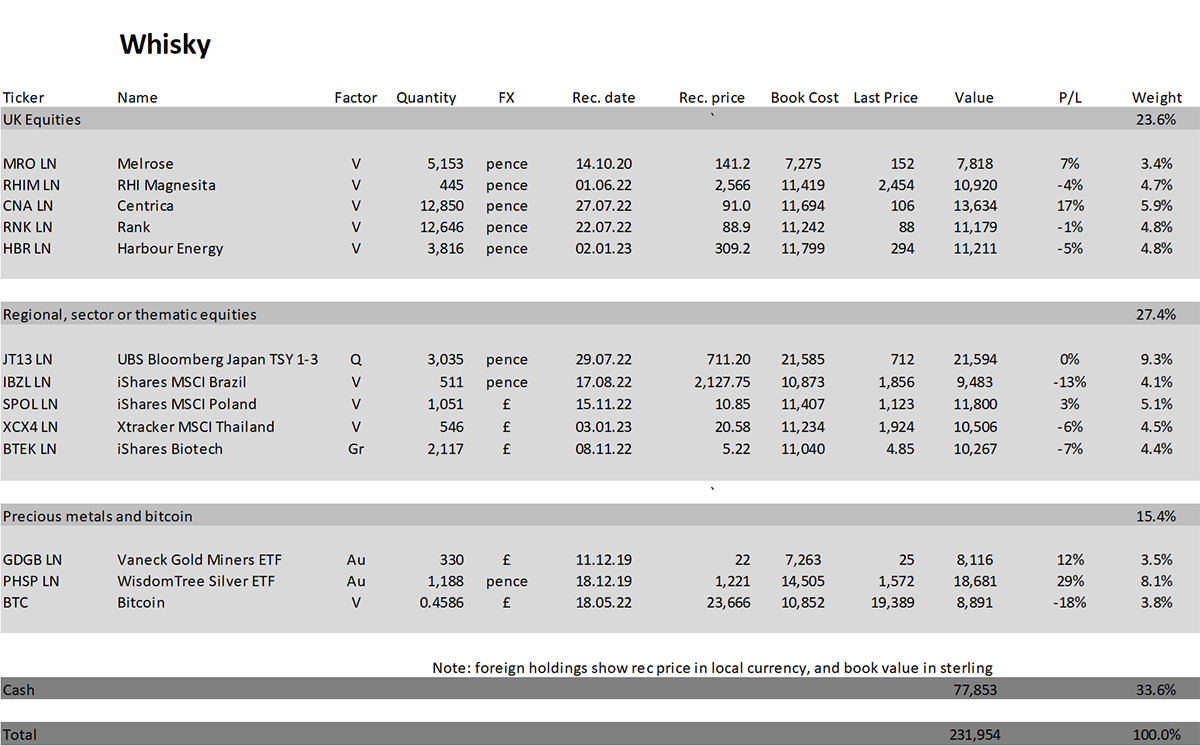
Whisky - a tactical, actively traded portfolio investing in stocks in the FTSE 350 Index, investment trusts, global ETFs and bitcoin. The Whisky portfolio is up by 3.8% this year and up 132.0% since inception in January 2016.
2016   +24.7%
2017   +5.4%
2018   -4.3%
2019   +21.4%
2020   +20.4%
2021   +12.9%
2022   +8.0%
Summary
I was adamant that 2023 would be the year that sees capital flow back to Asia and the emerging markets, but so far, that hasn’t happened. I shall need to address that soon.
The elephant in the room is cash. As rates rise, investors will realise it is a viable option rather than risk volatile asset prices.
Please let me know your thoughts by emailing me at charlie.morris@bytetree.com, or tweet me @AtlasPulse.
Many thanks,
Charlie Morris
Editor, The Multi-Asset Investor
General - Your capital is at risk when you invest, never risk more than you can afford to lose. Past performance and forecasts are not reliable indicators of future results. Bid/offer spreads, commissions, fees and other charges can reduce returns from investments. There is no guarantee dividends will be paid. Overseas shares - Some recommendations may be denominated in a currency other than sterling. The return from these may increase or decrease as a result of currency fluctuations. Any dividends will be taxed at source in the country of issue.
Funds - Fund performance relies on the performance of the underlying investments, and there is counterparty default risk which could result in a loss not represented by the underlying investment. Exchange Traded Funds (ETFs) with derivative exposure (leveraged or inverted ETFs) are highly speculative and are not suitable for risk-averse investors.
Bonds - Investing in bonds carries interest rate risk. A bondholder has committed to receiving a fixed rate of return for a fixed period. If the market interest rate rises from the date of the bond's purchase, the bond's price will fall. There is also the risk that the bond issuer could default on their obligations to pay interest as scheduled, or to repay capital at the maturity of the bond.
Taxation - Profits from investments, and any profits from converting cryptocurrency back into fiat currency is subject to capital gains tax. Tax treatment depends on individual circumstances and may be subject to change.
Investment Director: Charlie Morris. Editors or contributors may have an interest in recommendations. Information and opinions expressed do not necessarily reflect the views of other editors/contributors of ByteTree Group Ltd. ByteTree Asset Management (FRN 933150) is an Appointed Representative of Strata Global Ltd (FRN 563834), which is regulated by the Financial Conduct Authority.
© 2026 ByteTree Group Ltd