

Week 1 2023
If you missed the webinar yesterday, you can watch it here. I welcomed many new subscribers and answered questions about the Multi Asset Investor. I was caught out on platinum, which I will update readers on next week.
In the latest issue of the AAA Report, Robin and Rashpal did what they do every month. They dusted off their model, cranked the handle, gave a salute, and then scribbled down the results. Despite being clever people, they don’t have to use much brain power to update their model; that came many years ago when they first built it.
Trend-following, momentum investing, CTAs (trend-following funds), relative strength, price relative, and leadership are all terms that embrace the idea that the trend is your friend. Over the long-term, this is unquestionably true - and here’s why.
Rashpal showed this chart of stockmarket returns by year, which neatly fit inside a bell curve most of the time. The average year has been 11.8%, with most years returning between 10% and 20%. However, there is nothing average about stockmarkets, as they routinely do either much better - or much worse.
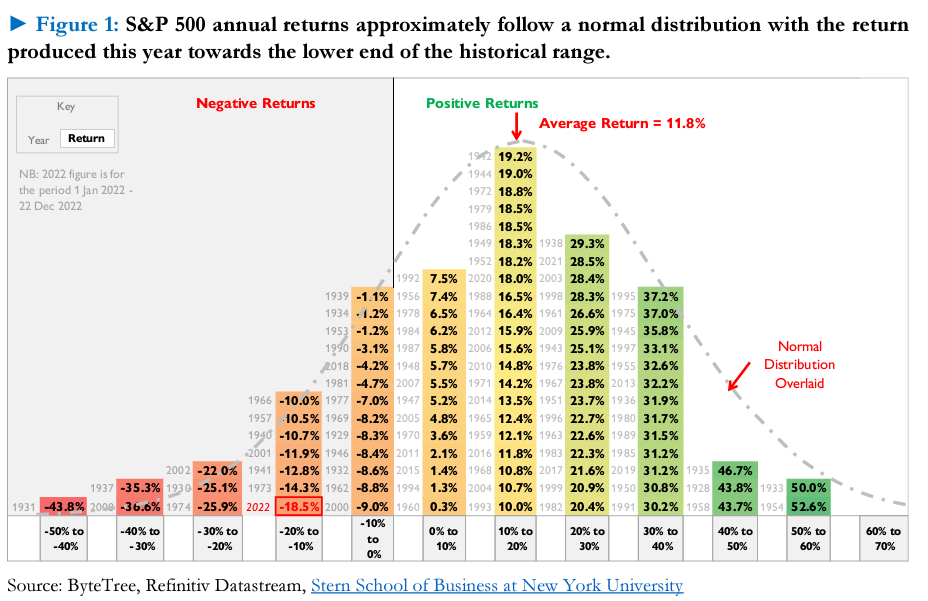
Notice how the best years don’t beat the bell on the right side, but on the left side, the worst years have often been worse than the bell suggests they should be.
What is happening? Most of the time, the bell curve works because things are normal – where normal is a good thing. That can be a modest loss, or a sizeable gain, but we call that normal. What is abnormal are heavy losses, which are a fact of life, but we don’t like them. When things go wrong in markets, they can go really wrong, and this happens more often than we think it should. Hence, the good times are “normal” and live inside the bell, while the bad times are “abnormal” and frequently ring the bell.
Rashpal cranked the handle to see what the AAA model has done since 1999. Despite some nasty years, such as:
- 2000: Dotcom crash
- 2001: Dotcom crash
- 2002: Dotcom crash
- 2008: Credit crisis
- 2011: Europe crisis
- 2015: China crisis
- 2016: Brexit
- 2020: Covid crisis
- 2022: Everything bubble
…it came out remarkably well. Notice how the AAA portfolio has a “right skew”, whereas the market has a “left skew”.
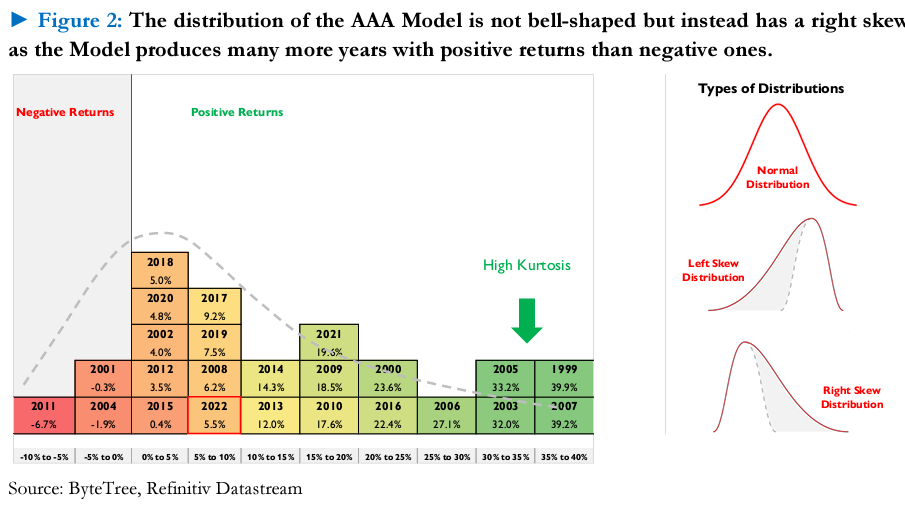
More proof that markets are anything but “normal”.
Trend-following can lose money, and despite it being a winning strategy over the long term, it requires discipline in implementation. It isn’t for everyone.
When Rashpal cranks the handle at the end of each month, he is looking for the strongest trends. By definition, the strongest trends have already risen in price and, more importantly, are beating (or leading) the market. Most of the time, these strong trends carry on for much longer than we would normally expect. Recall how the US tech sector was a license to print money from 2009 until 2021. That’s 12 years, and in the 1980s and 90s, it was even stronger – and for longer. But beware of the hangovers.
Identify the Leading Trends
That illustrates the power of identifying a great trend and hanging on, but not all trends behave that well. Some immediately reverse the day after you turn that handle, and it is currently a choppy time for trend-following in equities, which I can demonstrate.
The leaders versus the losers (strongest trends compared to the weakest trends in equities) are shown below. The chart rises over time, which shows that trend-following works in the long run. But in years like 2009, you get a momentum crash when the trends go into reverse, and doing the opposite is a better strategy (i.e. buying the losers and selling the winners).
Momentum and Momentum Crashes
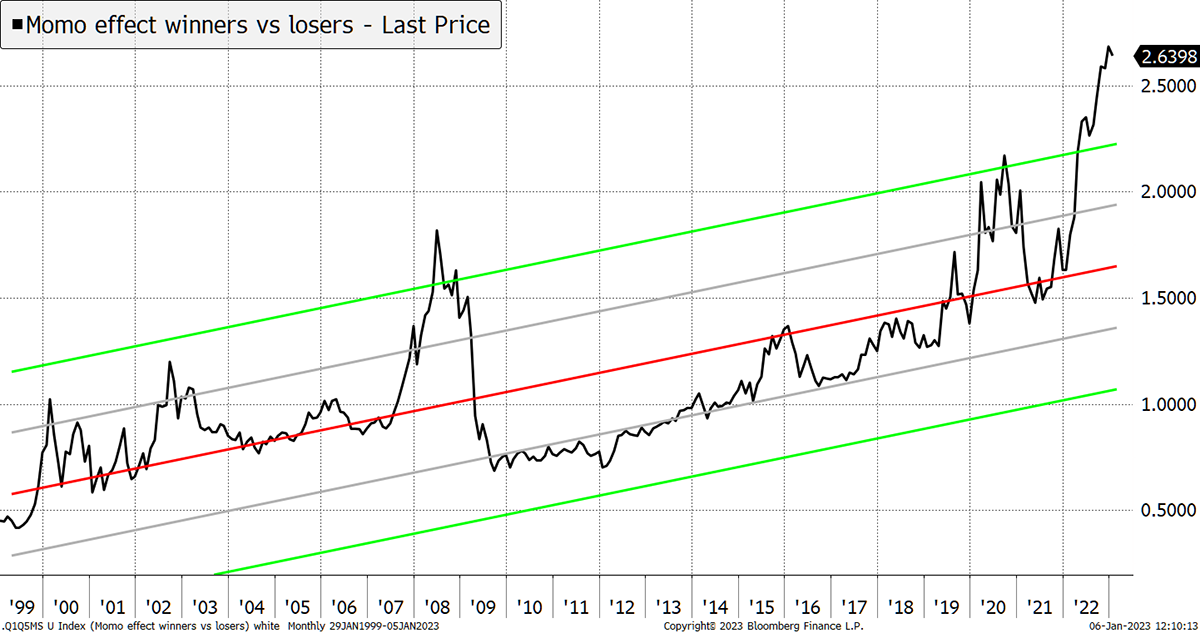
We had an equity momentum crash in late 2020 on the first reopening after lockdown. Then momentum reinvented itself with energy, defense and tobacco last year, and has become as extended as it was in 2008. That doesn’t mean the stockmarket will crash – indeed, it could mean it goes up, just as it did in 2009. But be in no doubt that it is telling us to be wary of mature equity trends until the dust settles. Trend-following has had a great run.
In my Multi-Asset Investor Letter, I am a huge fan of trend-following strategies but also try and forecast momentum crashes – which isn’t an easy thing to do. Currently, the strategy assumes an equity momentum crash is underway. We are avoiding old trends in favour of new trends accompanied by value. It’s doing well.
The AAA is not at risk from the full force of an equity momentum crash because it has a multi-asset class remit. It embraces bonds and commodities, which is great because bonds have already blown up, which makes them 100x safer than they were a year ago – although not necessarily yet safe.
In the latest issue, the AAA Team embraced corporate bonds and commodities. Of their four holdings, with 25% in each, only one is in equity, and a choice far away from the US equity bubble. The AAA strategy is a step ahead.
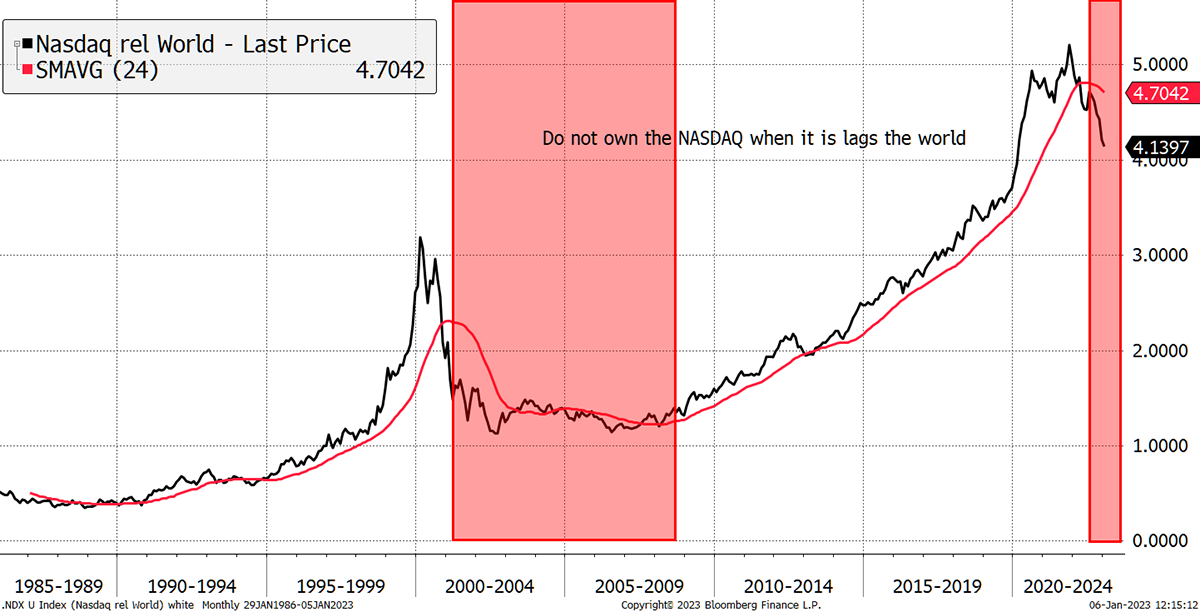
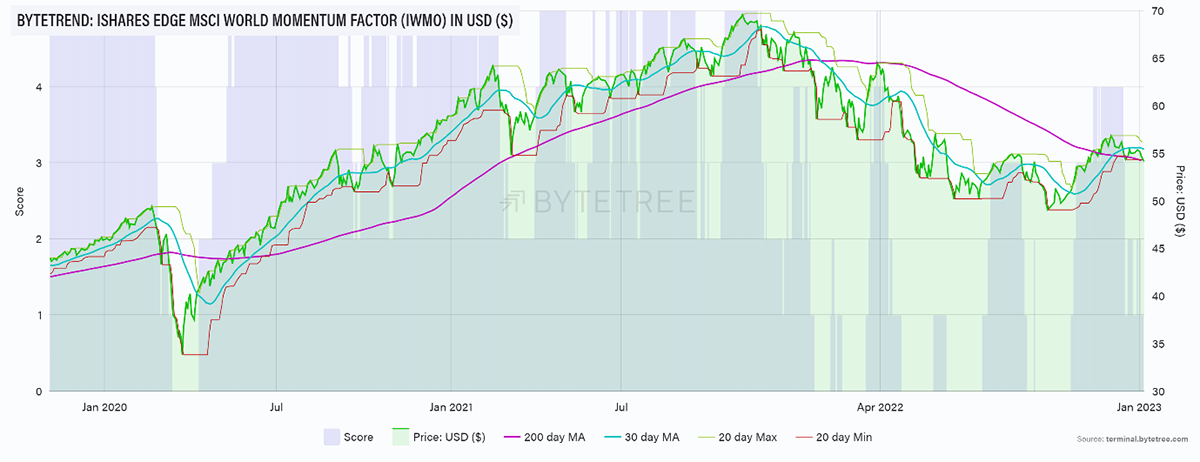
Being multi-asset will hold it in better stead than being a pure equity-only momentum strategy. You can buy an ETF that does that (somewhat well but dilutes it too much). I highlight the iShares World Momentum ETF (IWMO $ or IWFM £), and while it had a great 2020 and 2021, it is now under pressure.
Equity Momentum Has Had a Good Run
I have no doubt the AAA will have a spectacular decade, but it may have a few choppy months, or even a year. But those that follow the model, through thick and thin, will be pleased they did.
The AAA is an excellent investment process, but it isn’t for everyone. I would urge readers to fully understand it before they take the leap.
Trend-following is important at ByteTree, and that’s why we built ByteTrend, which is a simple way of screening 100 cryptos, 600 equity ETFs, and a bunch of commodities. We will be adding currencies, and possibly US-listed ETFs if there is demand, along with countries, sectors, and themes.
We can measure market strength using our breadth charts. The strong trends (navy blue) are few and have seen declining peaks for the past two years. That said, there are fewer weak trends (red skies), which implies stability. This is a powerful tool for keeping an eye on market strength.
Not Many Positive Trends in Equity ETFs

It is worth noting that most equity ETFs include US stocks, and that explains the recent dip, as US equities have been weak in recent months. Yet, the lack of blue perhaps understates the opportunities elsewhere because most ETFs by quantity are US-centric.
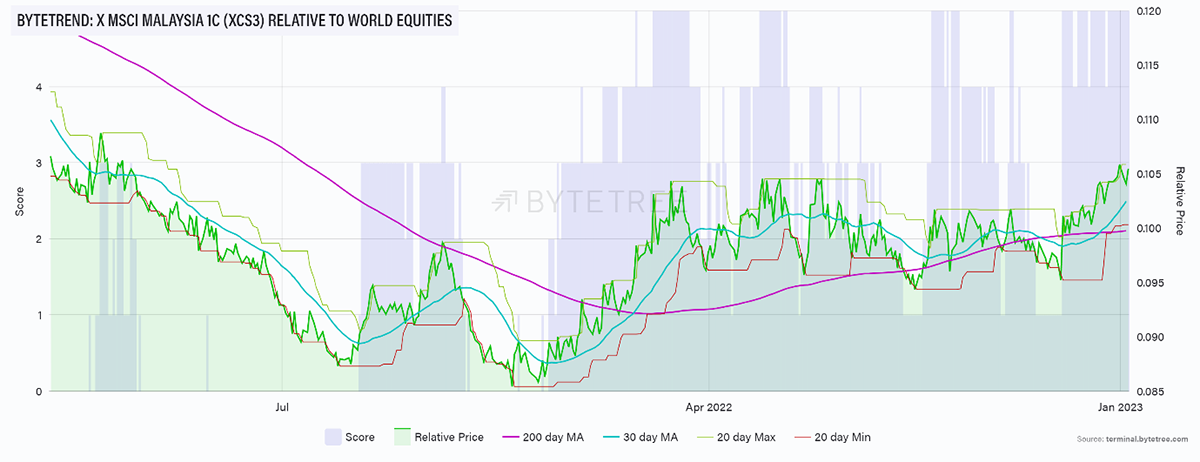
Here’s an example that isn’t much talked about- Malaysia. It has been lagging the world since 2011. Now it’s a leader. Get used to this.
Malaysia the Winner
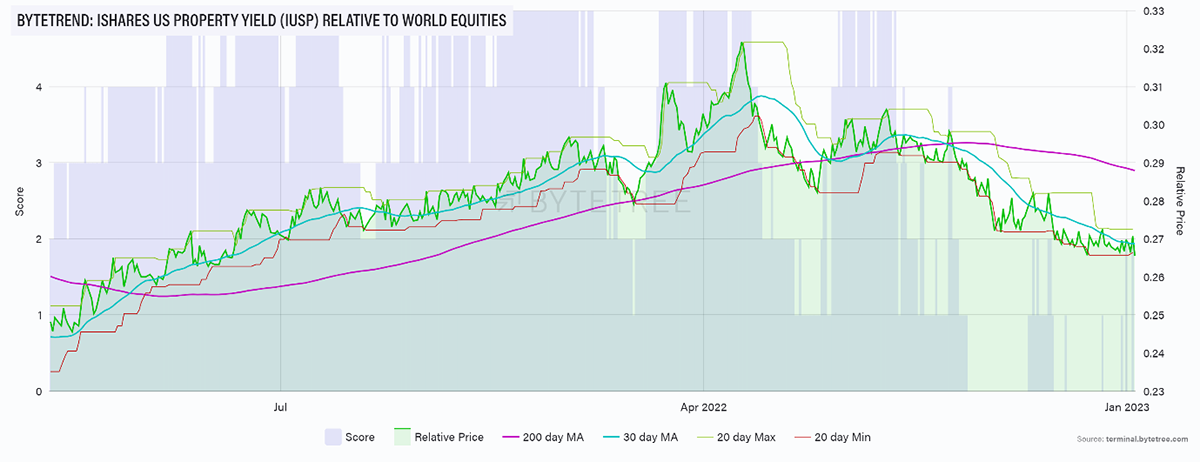
Contrast that with US Real Estate, which is melting before us.
As Safe as Houses
In commodities, where Goldman Sachs are forecasting a mega-double-bubble-boom, we see copper turning down. We already have oil and gas in downtrends, but as of last night, the same message was coming through for nickel as well.
Copper Bottomed
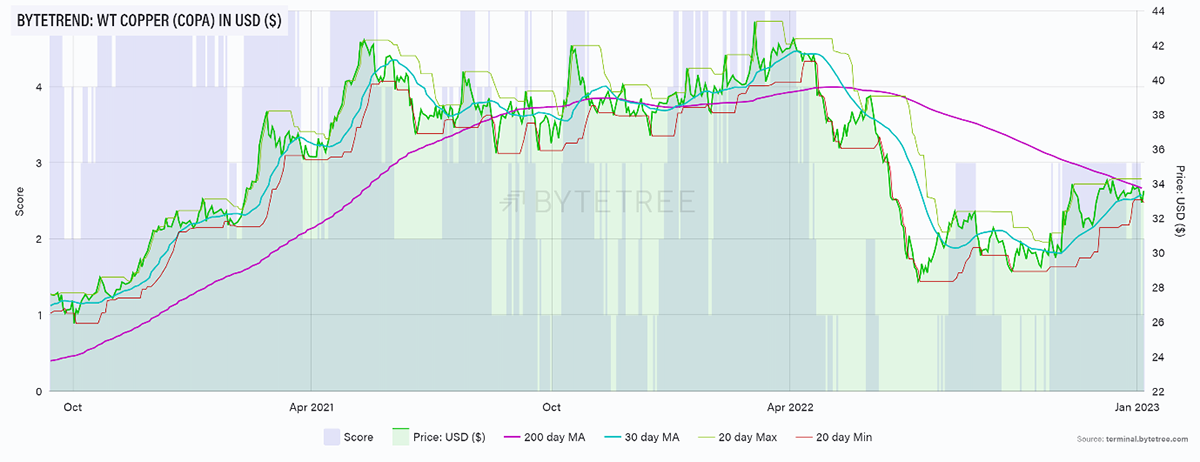
Nickel? You mean the thing we don’t have enough of? Surely to the moon! The trend urges caution. But it goes without saying; trends can change.
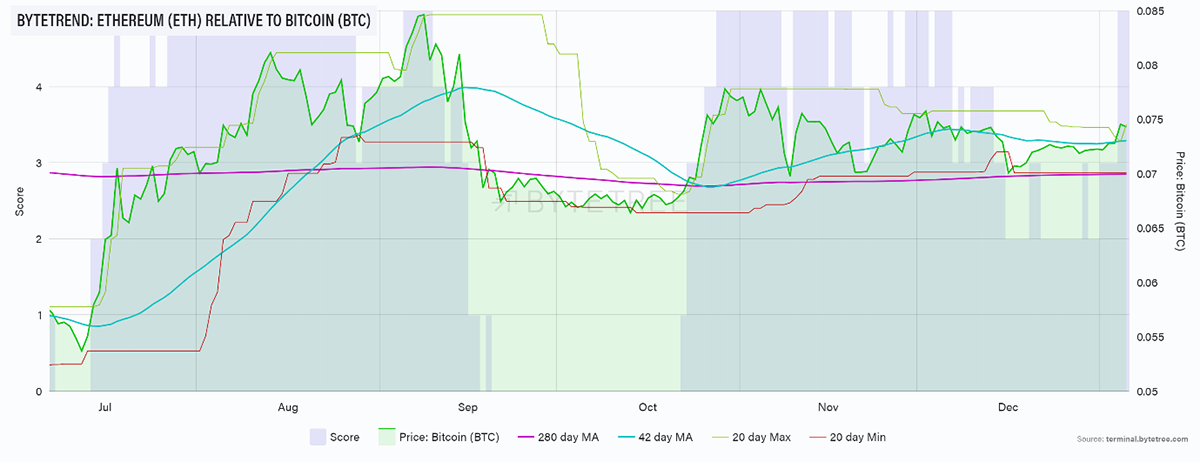
For the crypto bears, who insist it is a pointless Ponzi scheme, the number two token, Ethereum (ETH), is back in an uptrend versus bitcoin. To my mind, ETH is the crypto post office where you go to send assets around the world in a secure manner. It works well, and it may be telling us to prepare for better times ahead.
Ethereum Leads
In a momentum crash environment, the message from the market is that new trends are a much better bet than the old ones. We understand that, and our research communicates it. The AAA is excellent, but before you embrace it, please take the time to understand it.
Have a great weekend, and don’t forget to watch my video.


