

ATOMIC 57
The average time between blocks is designed to be 600 seconds and has risen to 660. This will see difficulty fall by around 10% on Thursday, in the next bi-weekly adjustment. One beauty of the blockchain is its ability to self-correct.
ByteTree ATOMIC
Analysis of Technical, On-chain, Macro, Investment Flows and Crypto.
Highlights
| Technicals | Fighting the NASDAQ |
| On-chain | Finding its feet |
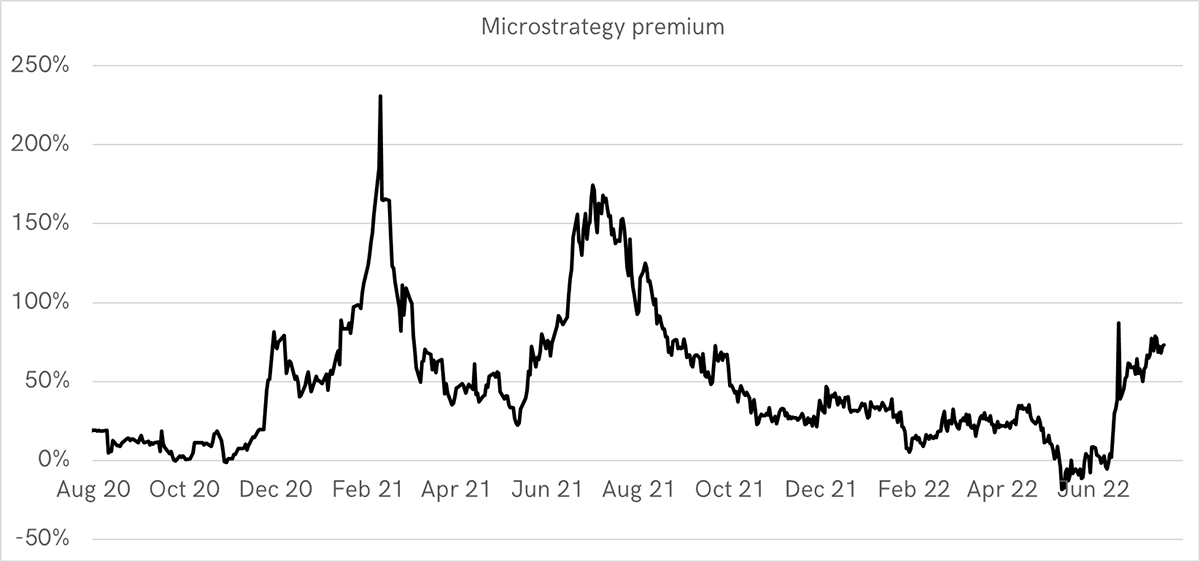
| Investment Flows | MicroStrategy Premium is too rich |
| Macro | Might the dollar have peaked? |
Technical
The ByteTree Crypto USD breadth chart shows how the space has improved. The red is the percentage of tokens with zero-star ByteTrends (weak), and the dark blue, five-star ByteTrends (strong). There are few strong trends, which we hope will come in time, but the good news is the deteriorating number of weak trends. Crypto technicals are stabilising.
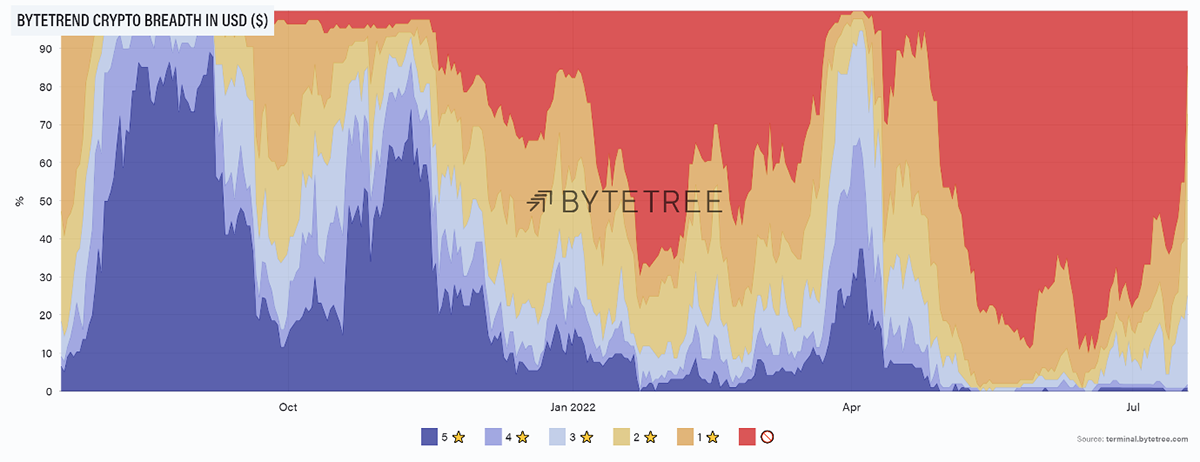
Source: ByteTree. ByteTrend crypto breadth chart in USD over the past year.
One example of this is the recent strength in Ethereum that I wrote about yesterday in ByteFolio.
The other chart of interest is the relief rally of bitcoin in NASDAQ. It was the break in May that saw bitcoin fall nearly 50% in NASDAQ. Until then, things were looking good, at least in relative terms.
I believe bitcoin deserves to be higher against tech, so it is good to see some strength in BitDAQ (BTC vs NASDAQ), even if it is early days. I believe bitcoin is underpinned, whereas stocks have still a long way to drop.
BitDAQ
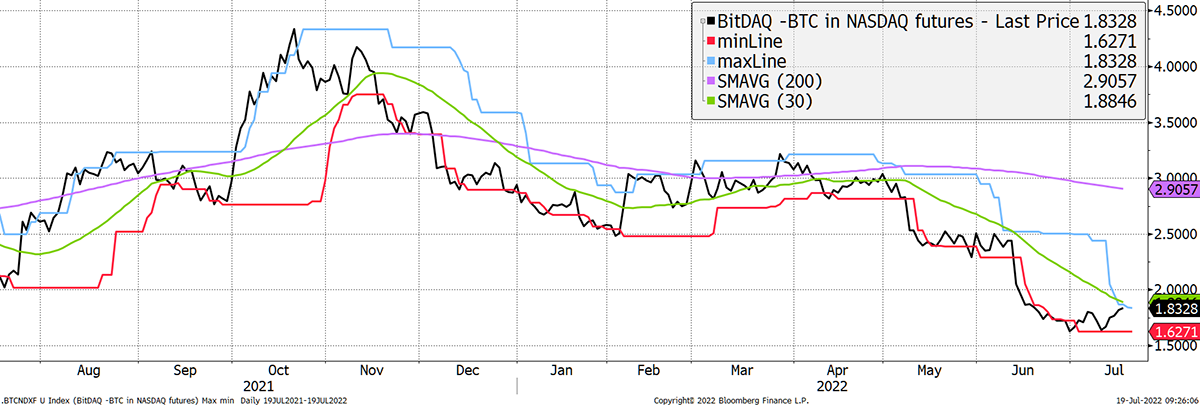
Source: Bloomberg
Bitcoin has held the line for the past month and is attempting a rally. I doubt we get much, at least for a while, but stability is all we ask for.
Bitcoin holds the line
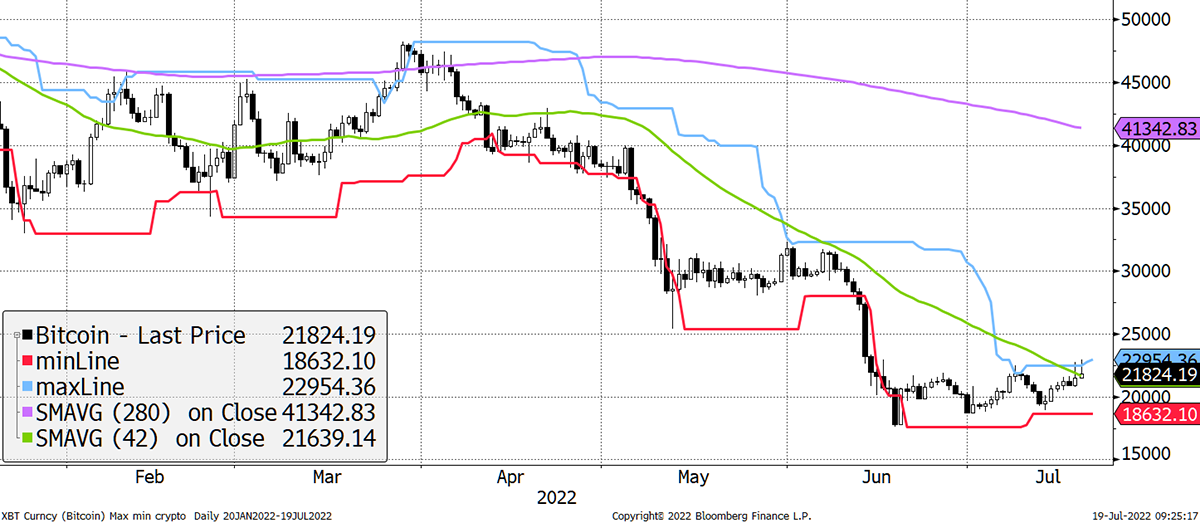
Source: Bloomberg
On-chain
The Network Demand Model is 2/6 and has remained weak since the break from $30,000. The network indicators, transaction value and fees are off, with the others on.
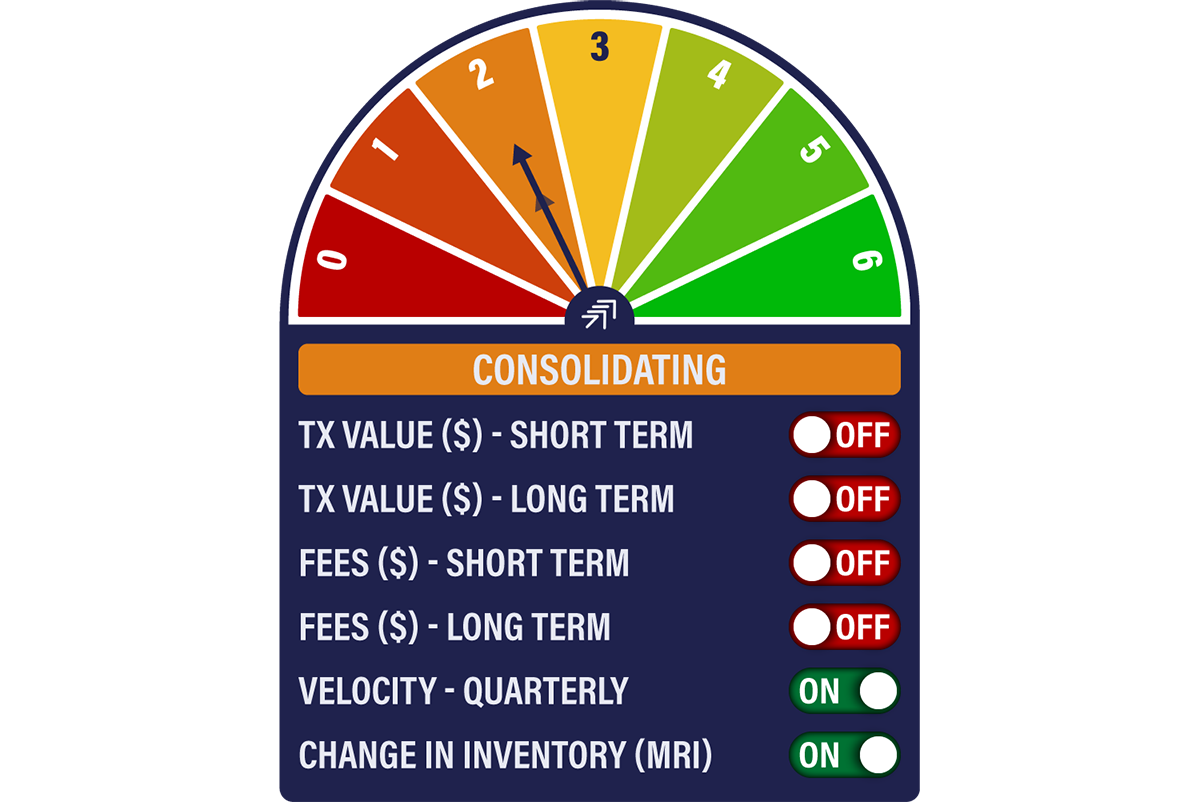
The network is contracting, but not severely. The one-week transaction value (TV) is shown in green. The recent spikes reflect heavy selling pressure in bitcoin on the price falls. The 12-week TV average in red is falling but at nothing like the pace seen in 2018.
This is a different kind of bear market for crypto. Prices have collapsed, but the underlying network has seen modest contraction compared to the past cycles.
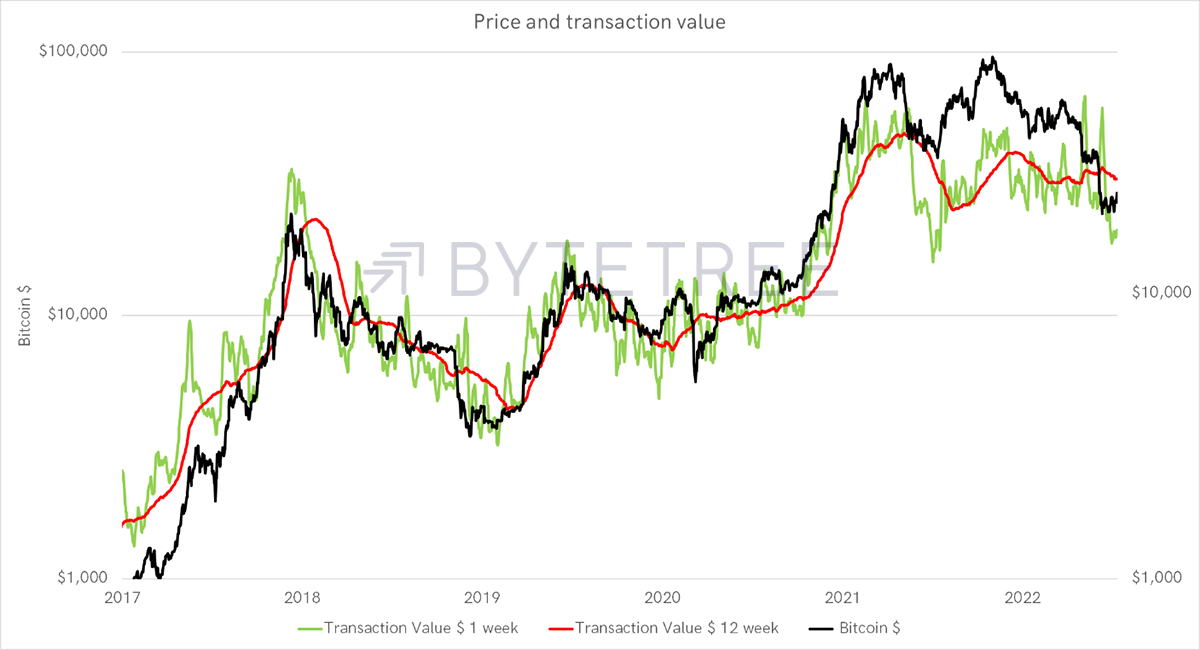
Source: ByteTree
The Network to Transaction Value (NVT) of 10x has been a pretty good gauge, and the price has returned to this line. Bitcoin is good value at these levels.
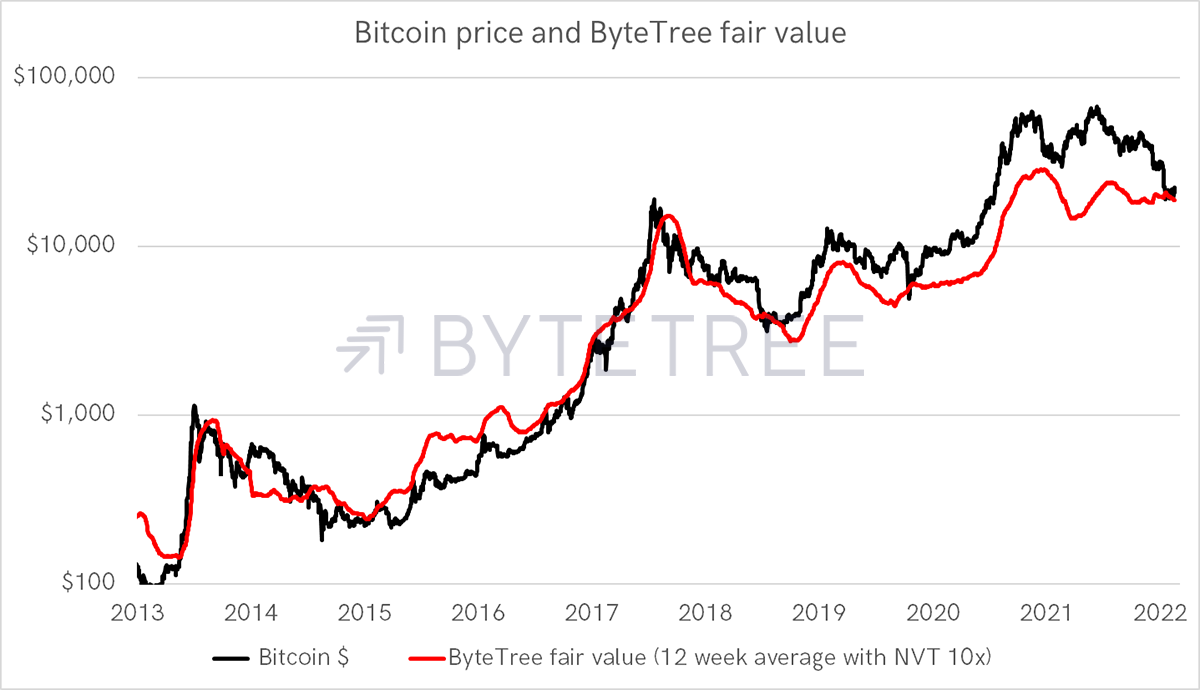
Source: ByteTree
ByteTree is working on an upgrade to the valuation framework, which I will discuss in more detail over the coming weeks. It asks what the NVT should be and questions the network value (mkt cap) as to how many bitcoins should be counted?
Should that be all that has been mined or just those that have been seen in recent months or years? There’s much to do here, and we look forward to sharing the results.
Another measure of the network comes from the institutional bid. The green line shows the dominance of large transactions in the network, which is a reasonable proxy for institutional activity. It has remained high, and a reading above 99% has been a good sign in the past. A collapse would be bad, so it is encouraging that IDR is stable.
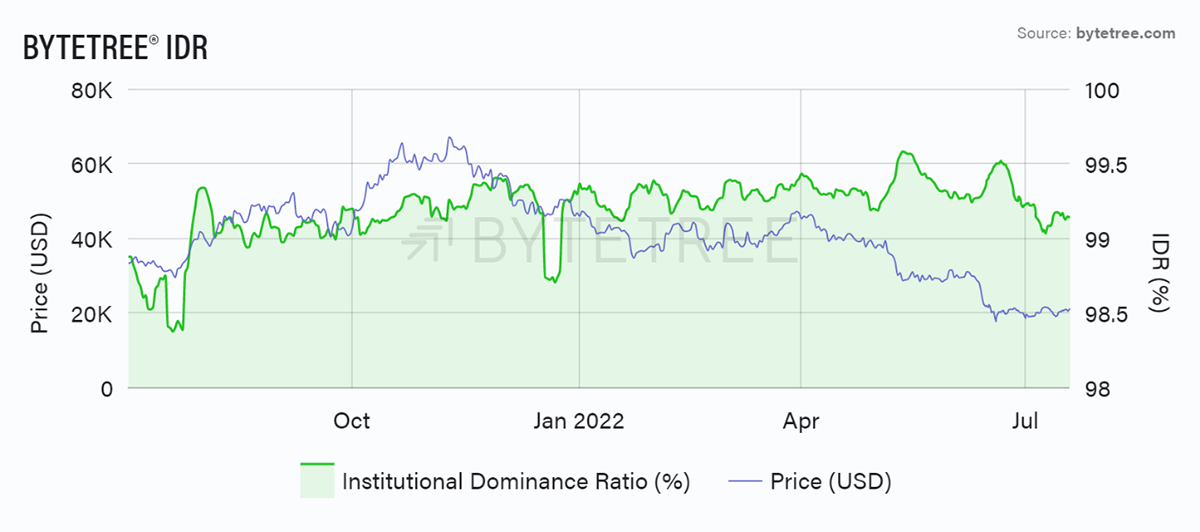
Source: ByteTree. ByteTree IDR (%) and bitcoin price (USD) over the past year.
You have to wonder how much of the damage done is due to the “everything bubble” and the bad actors in the space, such as Terra LUNA, Celsius, and The Three Arrows Fund. Excessive leverage is always a problem when it unwinds. At least in crypto, bad news emerges quickly, so with luck, these shoes have already dropped.
Looking into the blockchain, fees have risen despite lower TV.
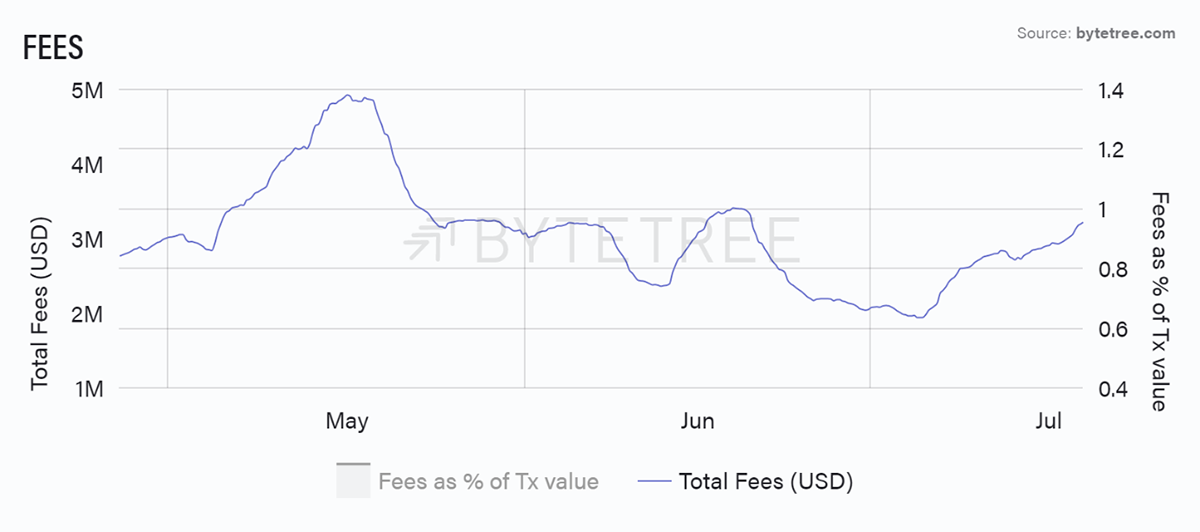
Source: ByteTree. Bitcoin Total Fees (USD) over the past 12 weeks.
This is because the blockchain is slowing down. Miners are presumably scaling back capacity as prices have fallen. Some blame the hot weather, others the high energy costs, but for whatever reason, fewer rigs are operating.
The average time between blocks is designed to be 600 seconds and has risen to 660.
Block interval rises
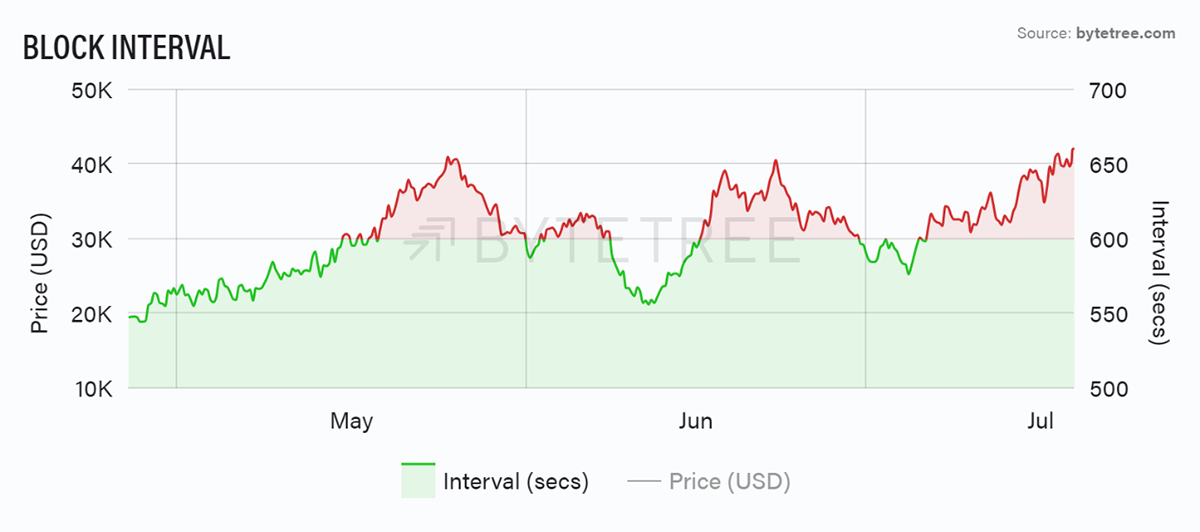
Source: ByteTree. Bitcoin Block Interval over the past 12 weeks.
This will see difficulty fall by around 10% on Thursday, in the next bi-weekly adjustment. One beauty of the blockchain is its ability to self-correct.
The miners have taken a pay cut from $1.8bn per month to just $600m (left-hand scale). Difficulty will fall but probably not that much. If it is 10% easier to mine, the case gets stronger for them to return.
The Miners took a Pay Cut
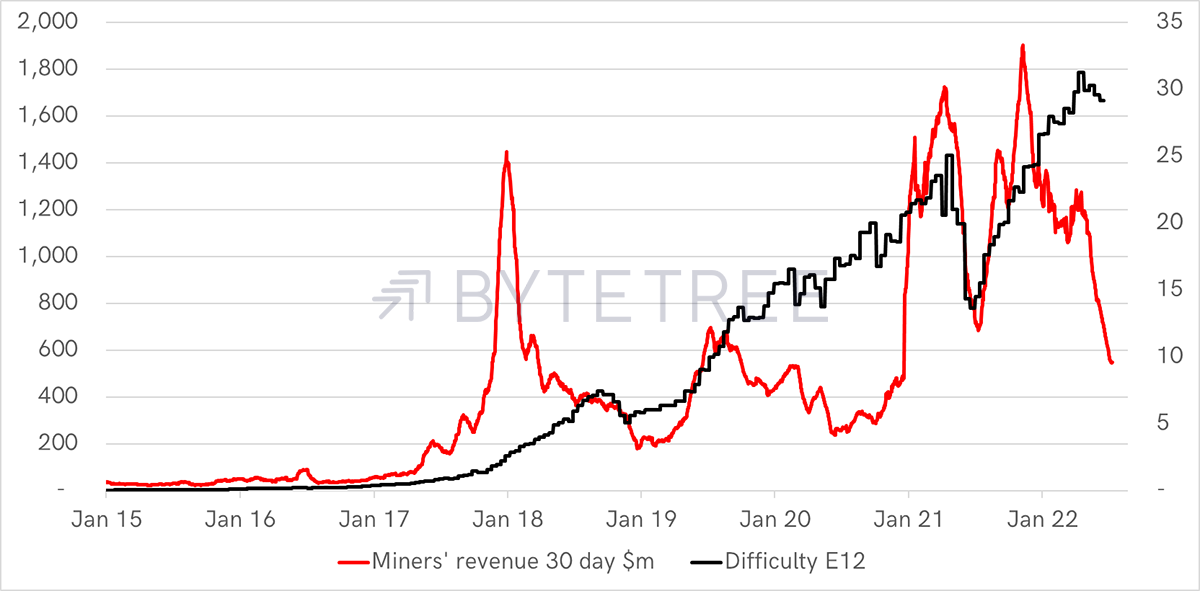
Source: ByteTree
While on the subject of mining, I’d remind you of the extraordinary link between miners’ inventory and price. In past cycles, rising inventories were bearish because it was so bad that they were unable to sell. Conversely, when they could sell, it was a sign of market strength.
In this cycle, things have reversed, and price has become correlated with inventories, which is the case in a normal commodity market. The good news here is that inventories will struggle to get much lower unless Satoshi’s coins turn up, which seems unlikely. These were mined in 2009 and early 2010 and have never been seen. Most believe they never will be.
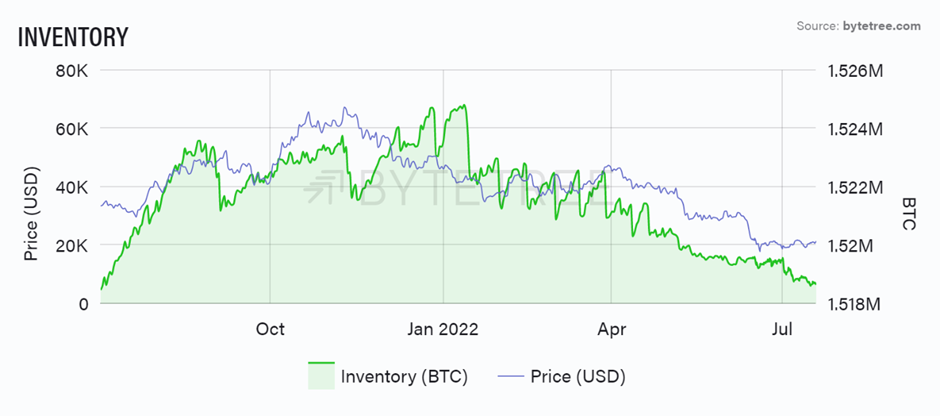
Source: ByteTree. Bitcoin Miner Inventory (BTC) and the bitcoin price (USD) over the past year.
Investment flows
The fund flows have stabilised, and the Grayscale discount is wide, but one conundrum is the MicroStrategy (MSTR) Premium which has ballooned to 73%. Is this a contra-sentiment indicator or a sign of renewed vigour from the smart money?
Source: Bloomberg
You can’t blame outliers or thin trading because MSTR is a liquid stock with $300m of volume on a normal day. But what is impressive is how the premium spike last summer and last month both happened close to the lowest day for the bitcoin price.
In any event, at the current price, MSTR is an inefficient way to play the bitcoin rally. Better to wait for the premium to fall.
Macro
The US dollar might be topping, and if so, this is a positive development for alternative assets such as crypto and commodities.
Short-term dollar reversal
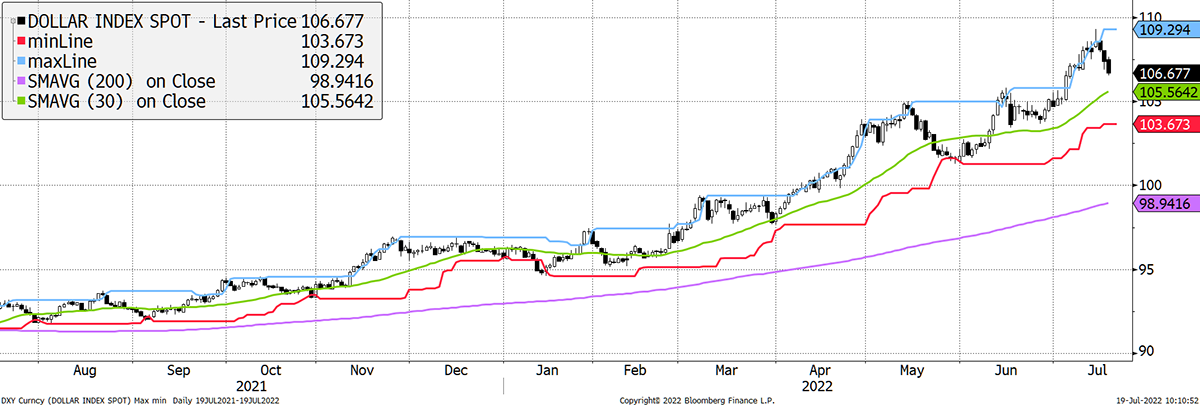
Source: Bloomberg
I can’t be sure, but the dollar is now heavily extended on a multi-year basis, so if the top isn’t now, it ought to be soon.
The recent selloff is only a few days old but might be something. The trigger was higher expected inflation. Could the system finally accept inflation is here for the long haul? If so, the Fed won’t hike rates enough to fight it because the cost to the economy will be too high. I reiterate that it is still early days, but something to watch.
Inflation is being acknowledged
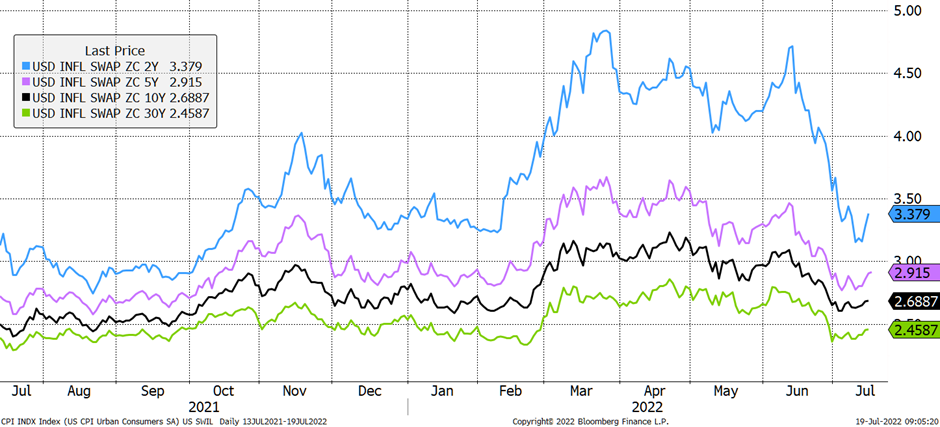
Source: Bloomberg
Looking at real rates (bond yield less expected inflation) with the dollar overlaid (red), there has been a clear linkage. That means if the Fed hike less than they say, and inflation proves resilient, then the dollar will fall.
This is becoming an increasingly likely scenario.
Easy money will keep the dollar soft
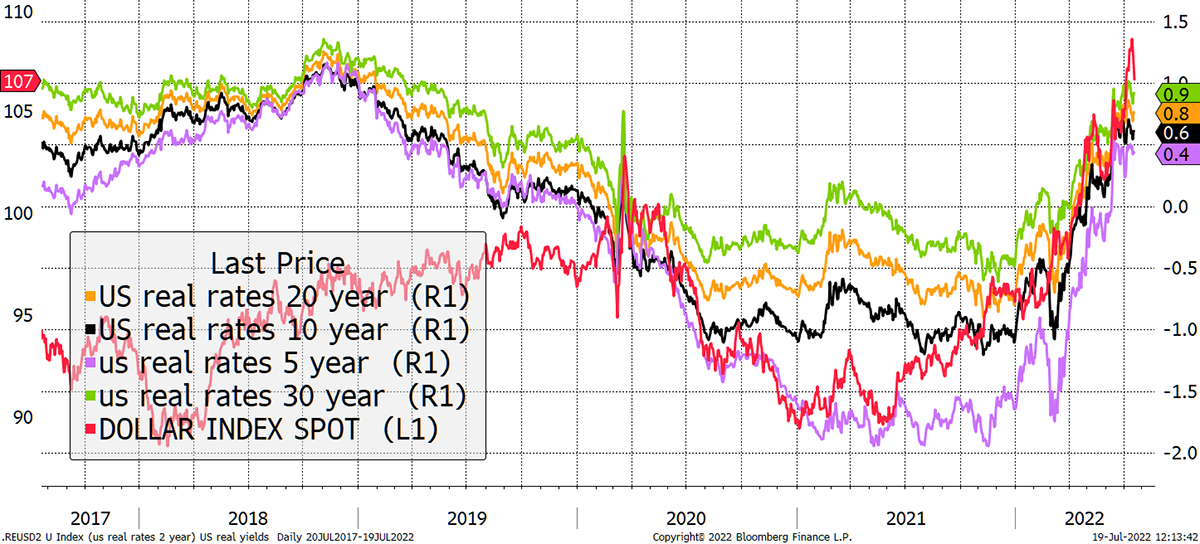
Source: Bloomberg
Summary
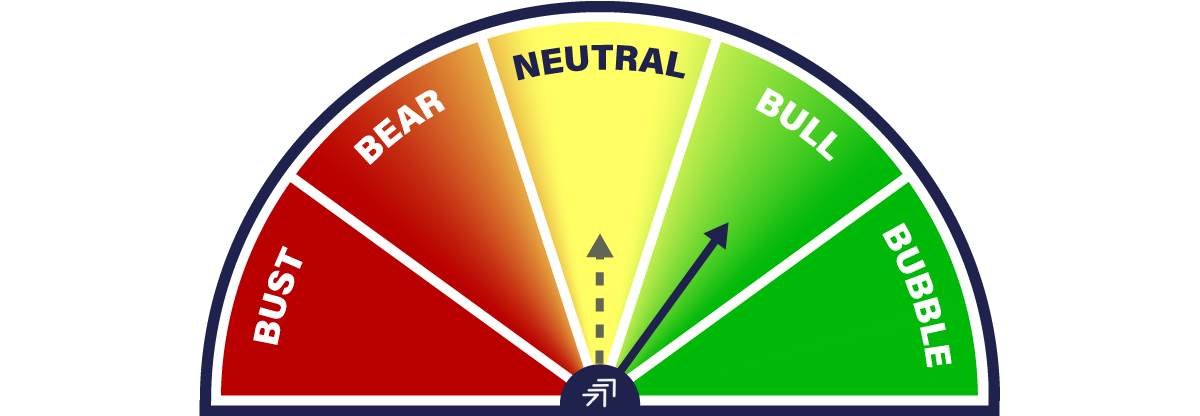
The dial remains bullish.
ATOMIC upgraded from neutral to bull on 10 May at $30,000, which has been wrong. This followed the price fall to $30,000, triggered by Terra LUNA. We were $10,000 early, which is a shame because in March 2020, the last major low, we were spot on. Nor did we do too badly last summer, upgrading to neutral from bear on 27 July at $37,000. We do our best, in a fast-changing environment, with risk at the forefront of our minds.
The evidence suggests that it is too late to be cautious and better to be patient. The network is stable, the institutions are still here, the blockchain will self-correct, and the macro will, at some point, improve.

