

ATOMIC 53
Bitcoin is a pure risk asset, and there is something beautiful about that. It is the canary in the coalmine and telling TradFi to watch out. Even those who do not embrace bitcoin should recognise its qualities as a leading indicator.
ByteTree ATOMIC
Analysis of Technical, On-chain, Macro, Investment Flows and Crypto.

Highlights
| Technicals | Deeply oversold |
| On-chain | Valuation attractive |
| Investment Flows | Surprisingly calm |
| Macro | The canary in the coalmine |
| Cryptonomy | CEL-off |
Technical
By: Charlie Morris
There are basically no trends to speak of in the entire crypto space. Breadth has collapsed, with red coins now making up 90% of the market.
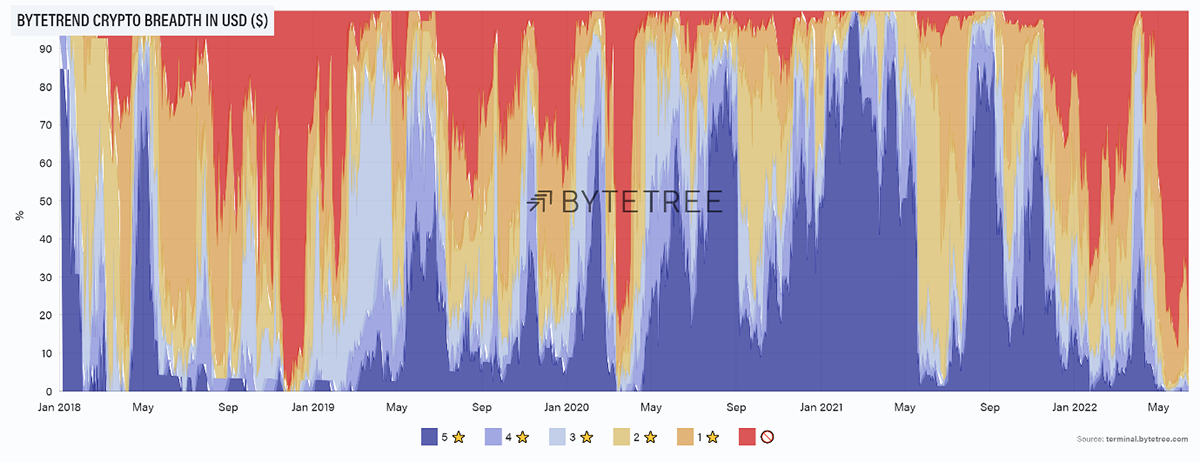
Source: ByteTree. ByteTrend crypto breadth since January 2018.
The current bitcoin price is now deeply oversold (-43%) against the 200-day moving average. This was exceeded in Jan 2015 when the price touched $200, in late 2018 ($3,000), March 2020 ($5,000) and today. That is a series of rising lows, which is a comfort for the bulls.
Bitcoin is deeply oversold (again)
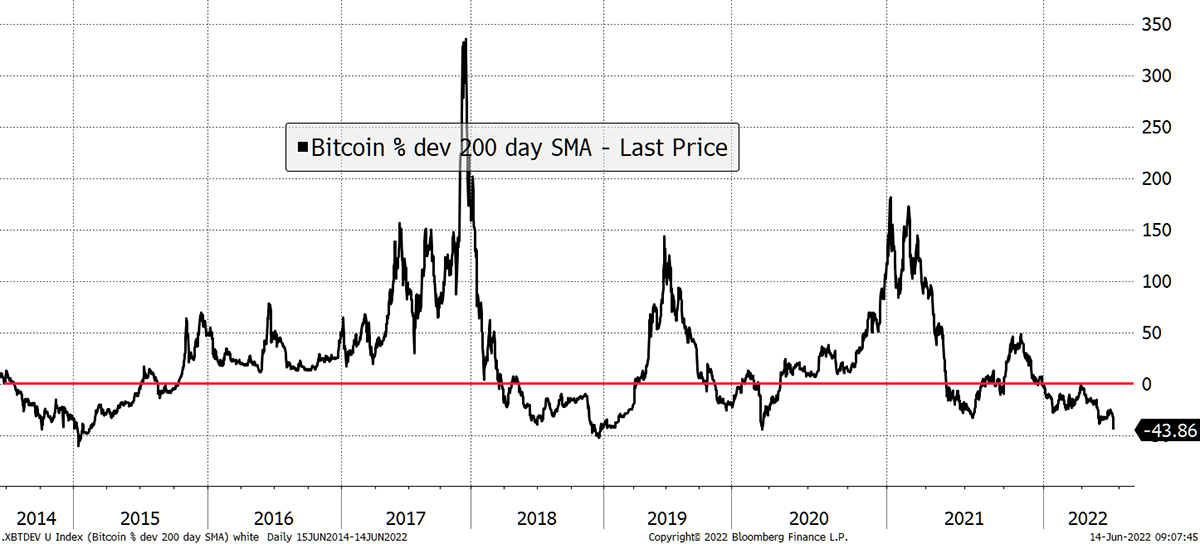
Source: Bloomberg
Knowing that the major capitulation points have a history of higher highs is somewhat reassuring during times like this.
Shorter-term, the price shows that it is deeply oversold on 10-day data as well.
Bitcoin flash crash
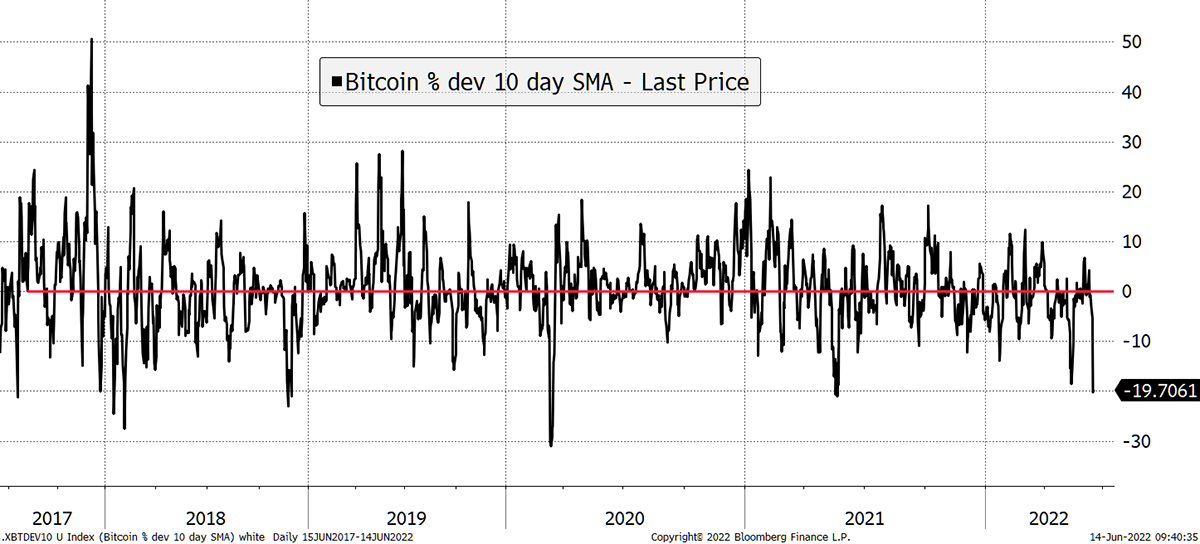
Source: Bloomberg
Crypto has capitulated, and the bonus is that it’s so bad it’s good. I wrote that a month ago. In hindsight, that was too early.
On-chain
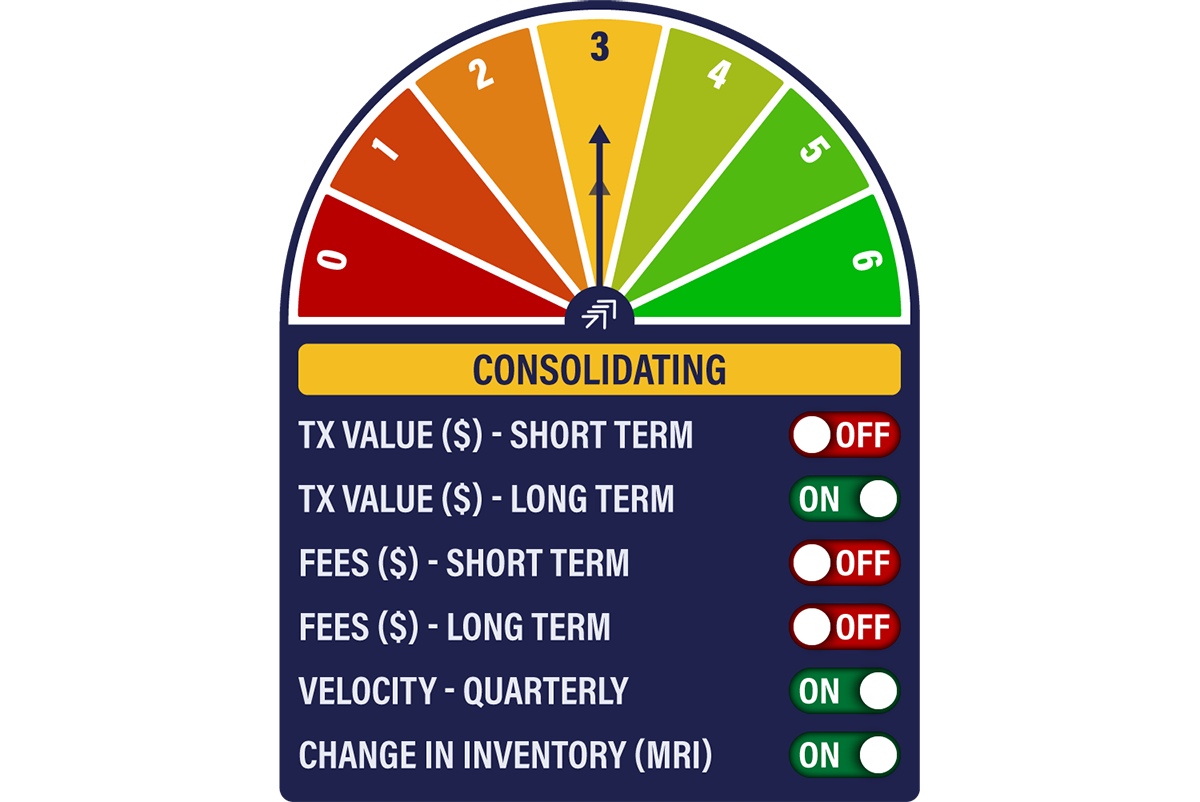
The Network Demand Model holds 3/6. Short-term spend has turned off, but other measures seem robust. What’s more, the on-chain fees have had a year to adjust from the China collapse in May 2020 and could turn positive at any time.
This is a surprise for me as, historically, we have never seen the price collapse to this extent while the underlying network has remained healthy.
If the network is doing fine, then the problem must be valuation. The Network to Transaction Value Ratio (NVT) provides the basis for our fair value calculation. Yesterday it dropped to 11.3
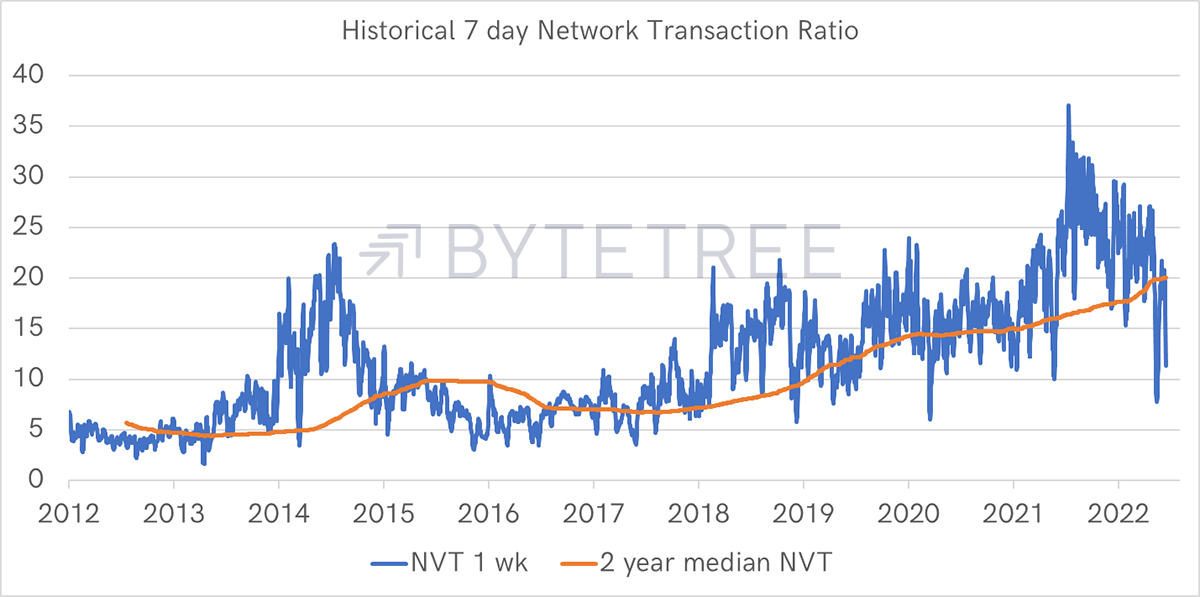
Source: ByteTree
My thinking pre-2018 was that the historical average was 7.7, but it then kept on climbing. The idea of a two-year trailing median was designed to accept that there was no right answer as to what the NVT ought to be.
Seeing it trade structurally higher for five years, one of which was a brutal bear market, gave us confidence that 7.7x was too low. Using the two-year median, the NVT comes to 20.6x and implies a fair value of $40,821. Given the price has fallen so much, that is either wrong, or bitcoin really is dirt cheap.
There have been moments in history when the NVT has seen 5 or lower, but that was a younger and less established bitcoin market. Even so, the corrections in 2018 and 2020, and even last month, got close.
We continue to believe that the NVT today deserves to be higher than pre-2018, but as is often the case with these things, we need more time, more data, and more market tests to build a more robust understanding and framework.
For the live fair value calculation, we use a much more conservative NVT of 10x, as shown below. That is why it has consistently stated that bitcoin has been trading at a premium.
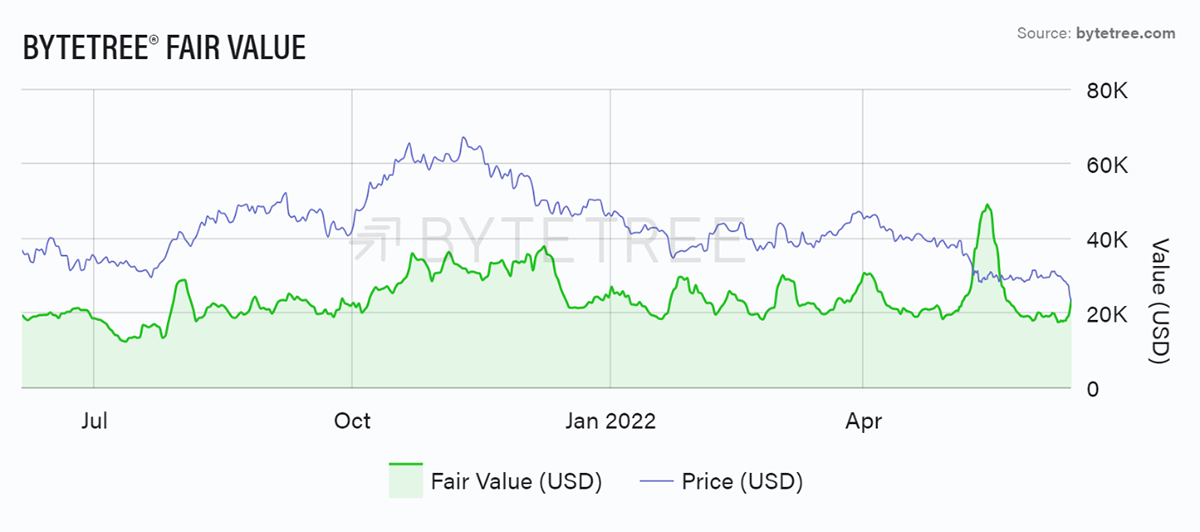
Source: ByteTree. ByteTree Fair Value (USD) for bitcoin and price (USD) over the past 52-weeks.
Using our data, I have taken that back to 2012. Maybe we have been living in cloud cuckoo land for the past few years, and in the 20k’s, we are back to basics.
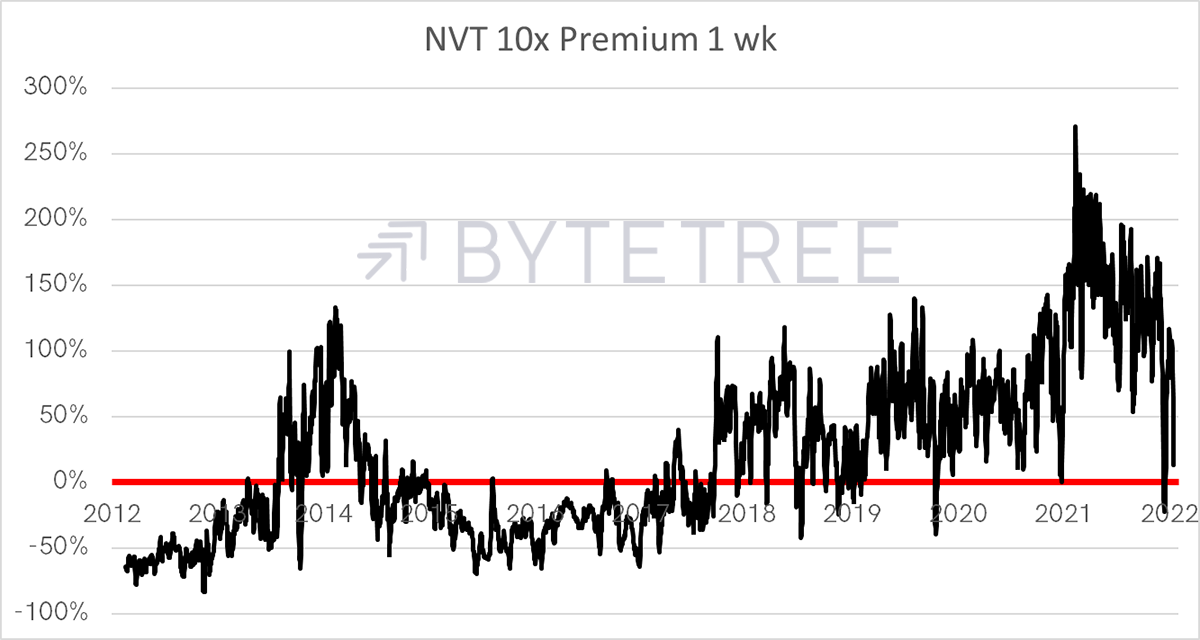
Source: ByteTree
If so, that’s not the end of the world because, as you’ll see, the equity correction has barely started.
Investment flows
Last May we saw significant redemptions by investors, but today, they seem surprisingly calm.
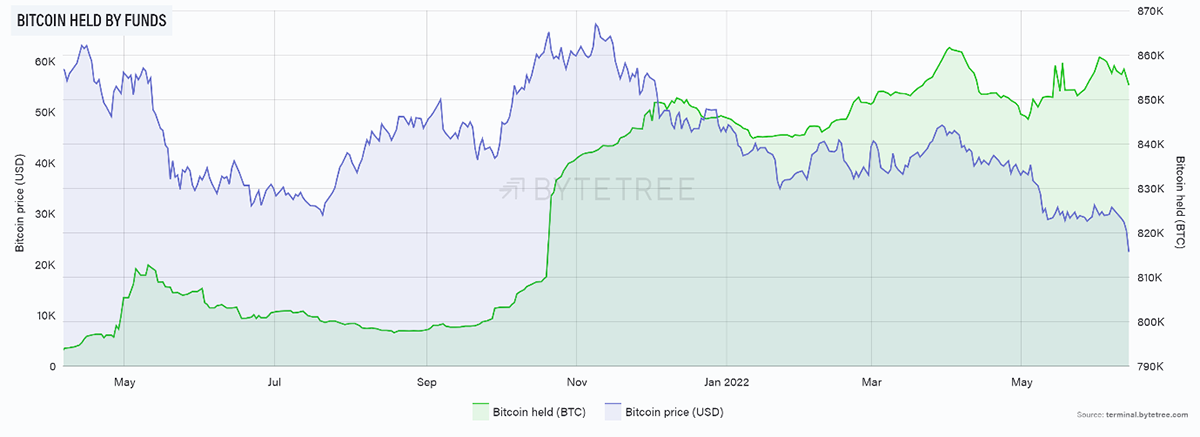
Source: ByteTree. BTC held by funds (green) and bitcoin price (blue) since April 2021.
It is worth remembering that the miners create 6,300 BTC per week. At $68k BTC price, that amounts to $428 million ($22.2 billion per year) of value accrued. At $22k, that falls to $138 million ($7.2 billion per year).
It is a reminder that the network is cheaper to support at lower prices. And when halving comes in April 2024, this number literally halves again.
The risk in that sense is that liquidity dries up, and the bitcoin network grinds to a halt. There are no signs of that, and it remains vibrant. The pull to halving normally starts 18 months before, and so there ought to be a positive pull by the autumn.
Macro
This selloff is 100% macro. Bitcoin has been following the NASDAQ lower this year on a pretty much 1:1 basis. That was until last month when it broke away to the downside.
Bitcoin breaks lower from NASDAQ
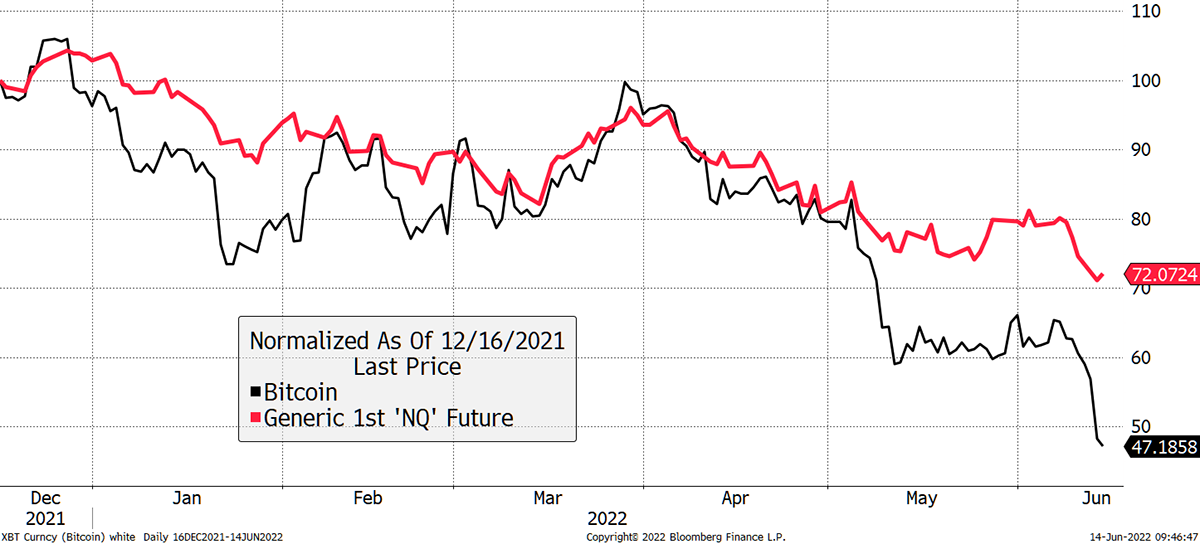
Source: Bloomberg
The BitDAQ shows BTC in NASDAQ. The great hope was that it would hold above 3 and prove to be the safe haven. That idea hasn’t worked out (yet), and bitcoin is back to where it was versus the NASDAQ a year ago.
Support?
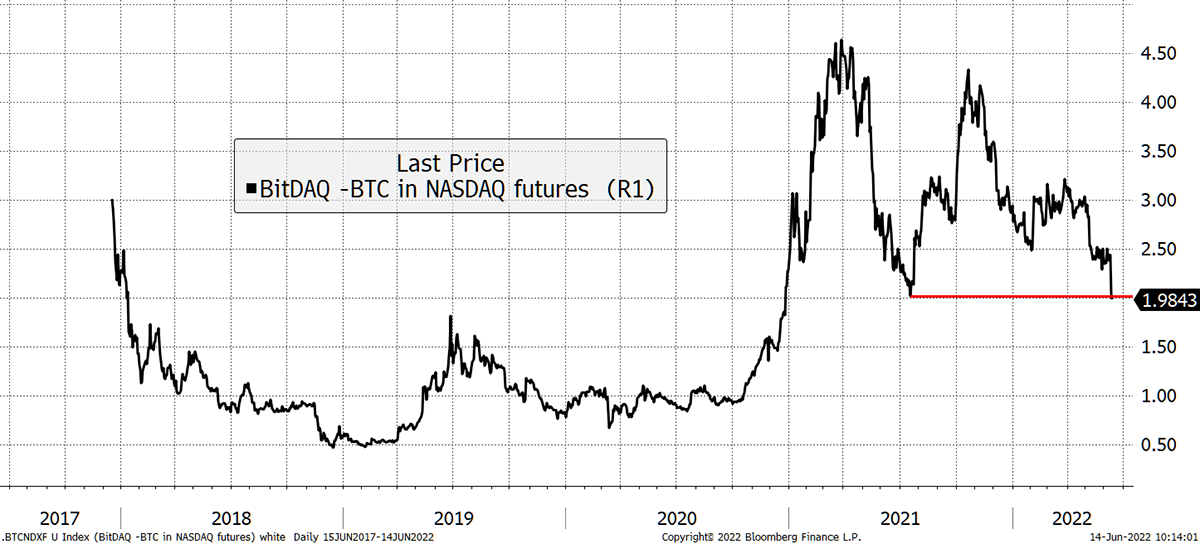
Source: Bloomberg
It would surprise many that bitcoin and the NASDAQ have enjoyed the same return over the past four years as the chart was at 2 in early 2018 and is at 2 today.
I believe there is a difference because bitcoin comes out looking cheap, whereas the NASDAQ is still pricey on basic valuation measures.
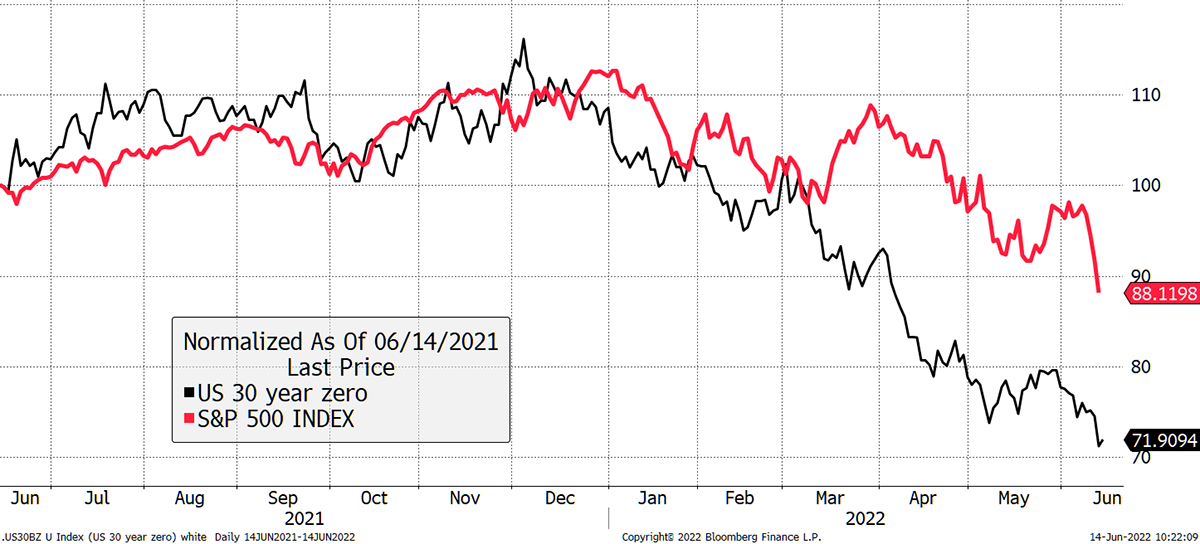
Looking at TradFi (traditional finance), bonds and equities are normally uncorrelated. That is, equities go up and bonds down or vice versa.
Bonds and equities are normally uncorrelated
Source: Bloomberg
In recent days, the bond market has sold off, and it is clear how equities and bonds are moving in step.
Did you know that the US long bond (at least a zero-coupon bond) is now down 50% from the March 2020 high? And people say Bitcoin is a Ponzi scheme.
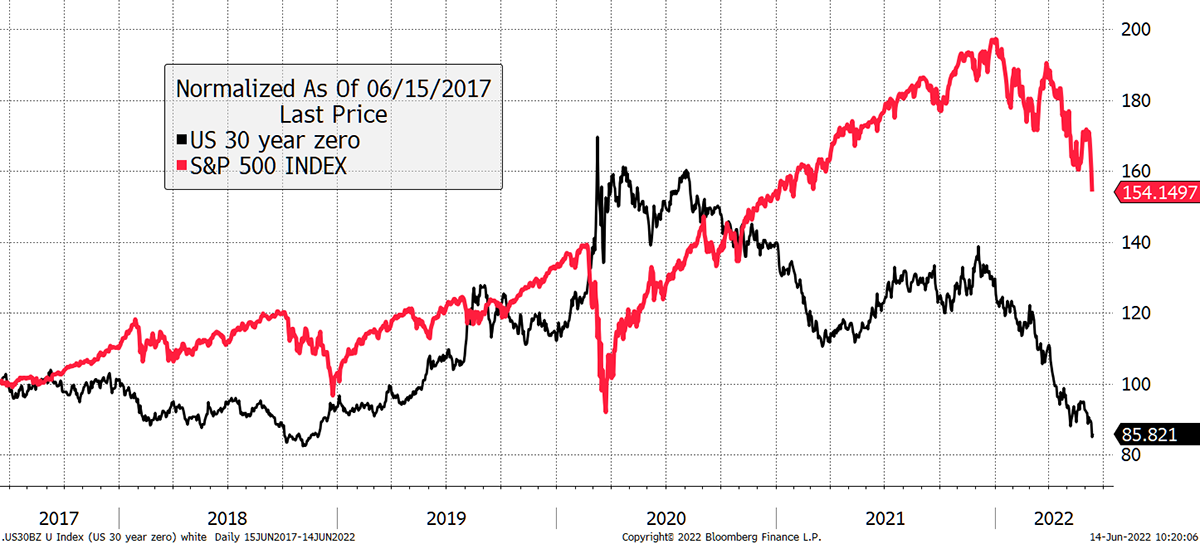
Bonds and equities are now correlated, and equities need to catch down
Source: Bloomberg
This equities versus bonds chart goes back four plus decades. The selloff in bonds is making equities super expensive. This is worse than the dotcom bubble.
The Everything Bubble
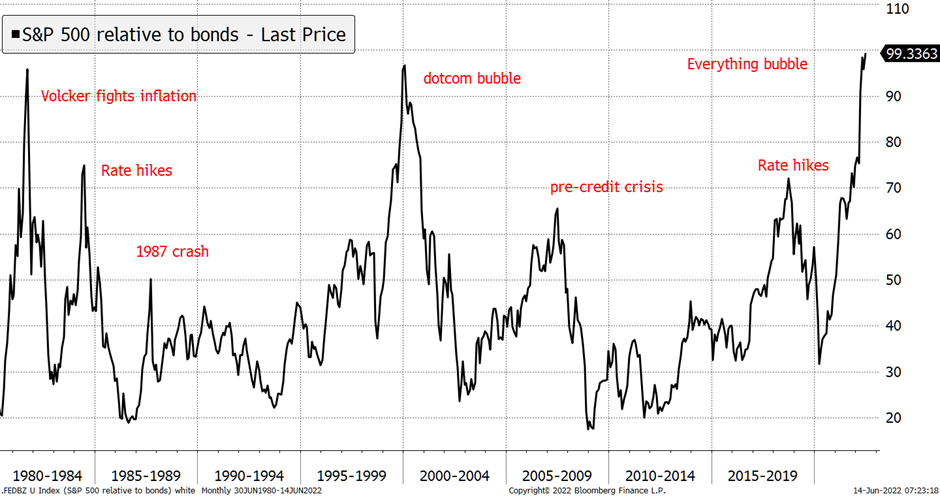
Source: Bloomberg
In recent years, equities have enjoyed a revaluation as interest rates have been so low. Rates are now rising, and equity valuations are stretched.
Bitcoin is a pure risk asset, and there is something beautiful about that. It is the canary in the coalmine and telling TradFi to watch out. Even those who do not embrace bitcoin should recognise its qualities as a leading indicator.
Cryptonomy: CEL-off
By: Laura Johansson
The crypto market is still shaken from the collapse of LUNA and terraUSD (UST), and the fear level remains high. Celsius, a cryptocurrency lending platform, announced in the early hours of Monday (UK time) that they have paused all withdrawals with no timeline for when they would resume. Consequently, yesterday was a dark day for cryptos across the board.
Following the Terra collapse, traders were looking out for the next possible catalyst, with Celsius being at the top of the list, according to a Forbes article from last month. The reason quoted was that the Celsius token CEL had dropped by 70% in price between April and May. As of yesterday, CEL is down 91% since 1 April.
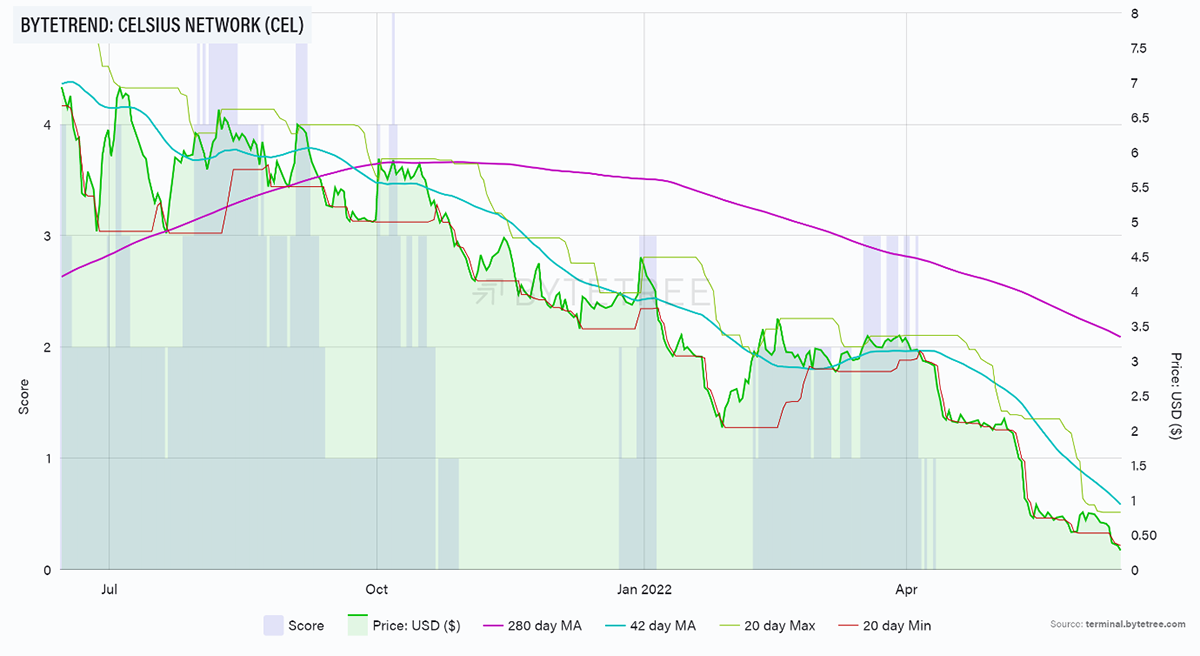
Source: ByteTree. CEL ByteTrend over the past 52 weeks.
The downturn of the CEL token is a reaction to the real problem behind the scenes: a liquidity crisis. Celsius is a centralised DeFi company where investors can deposit money for a fixed interest rate. Celsius then reinvests that money in DeFi and on-chain to earn a yield. What has led us to this crisis is a string of bad luck and choices. The Twitter threads by @otteroooo and @JackNiewold outline this very well. I’ll cover a brief summary below, but I very much urge you to read the threads as well.
Celsius has lost at least $120m in hacks as well as the funds that were tied to the Anchor Protocol (part of Terra). The majority of their ETH deposits are currently locked. Following Terra, the demand for withdrawals has increased, with their assets under management dropping by billions of USD.
This is just the start of the rabbit hole (see threads above), but in a nutshell, they do have enough assets to cover investors’ funds, but not enough of it is liquid. Despite the previous messages of reassurance, the full pause in withdrawals is a telling sign of how bad the situation really is, which will further be amplified by investors losing trust in the company. Their only choices are to secure external funding, get a loan to increase liquidity, acquisition by another company (rival company NEXO has already offered), or go bankrupt. What a week, and it’s only Tuesday.
Summary
These are tough times. We have been here before, and no doubt will see this repeated. But each time, the crashes seem less severe than in times past. I suppose that is progress.

