

ATOMIC 16
I have a dream that one day Bitcoin will cease to be a risk-on asset. If there was just one hint of resilience during a financial market shock, the price of bitcoin really would “go to the moon”. The world is crying out for a safe haven.
Highlights
| Technicals | BTC bearish, ETH stronger |
| On-chain | Stable |
| Macro | Evergrande could dent growth |
| Investment Flows | Stable |
| Crypto | Breadth deteriorates |
ByteTree ATOMIC
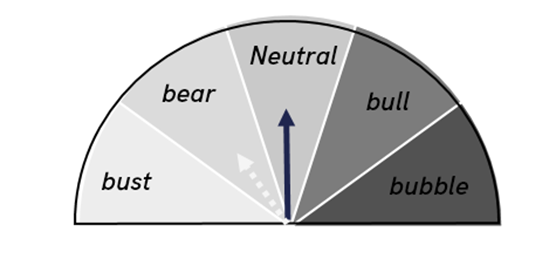
Ever the risk-on asset, the bitcoin price has responded to external events linked to Evergrande, the troubled Chinese developer. We tentatively hold the dial at neutral, with $43,000 being the key level.
Technical
Twelve days after the last flash crash, there has been a repeat that saw the intraday price make a new low at $40,221. This takes the ByteTrend score to a zero.
Bitcoin trend
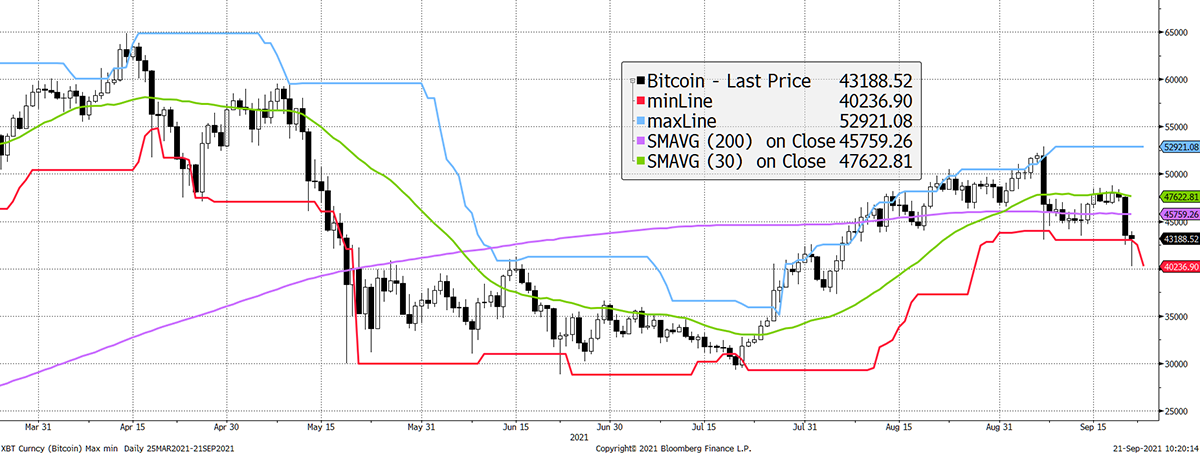
Source: ByteTree; Bloomberg. Bitcoin with 20-day max and min lines, 30-day and 200-day moving averages past six months.
We urge you to become familiar with the ByteTrend score concept because it will become a major feature in ByteTree technical research. Quite simply, it enables a trend to be quantified, which helps to remove emotion and provide a comparison across many charts for cross-market screening.
A ByteTrend score gets a point for each of the following criteria:
- Price is above the 200-day moving average
- Price is above the 30-day moving average
- 200-day moving average slope is rising
- 30-day moving average slope is rising
- The last touch of the max/min lines was blue
Currently, the 30- and 200-day moving averages have a negative slope and the price trades below both. On the max/min lines, the last intraday touch was red, having not seen a blue in the interim. BTC therefore scores no points this week, as none of those criteria are met.
Going back to 2017, the lesson is that bitcoin returns could have been matched, or exceeded, by being long when the score was 1 or better. That is, over this particular timeframe. Owning BTC when the score was zero turned $100 into $92 over the period, in contrast to HODL which delivered $4,573.
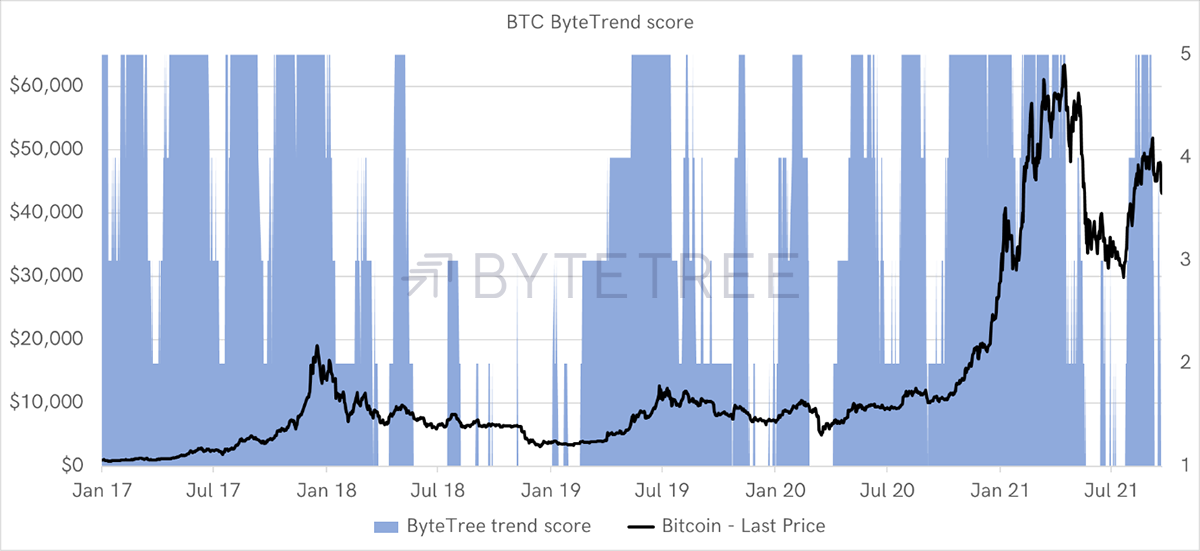
Source: ByteTree. ByteTrend BTC score since 2017.
Last week, we said that a breach of $43,000 would encourage us to shift the dial back towards bear. If there is a close below that, expect the dial to be downgraded.
ETH is more compelling as the ByteTrend score is 2. The difference is that the 200-day moving average sits at $2,583, and it has a rising slope. Price is circa $500 above trend and appears to be better supported.
ETH has stronger technicals
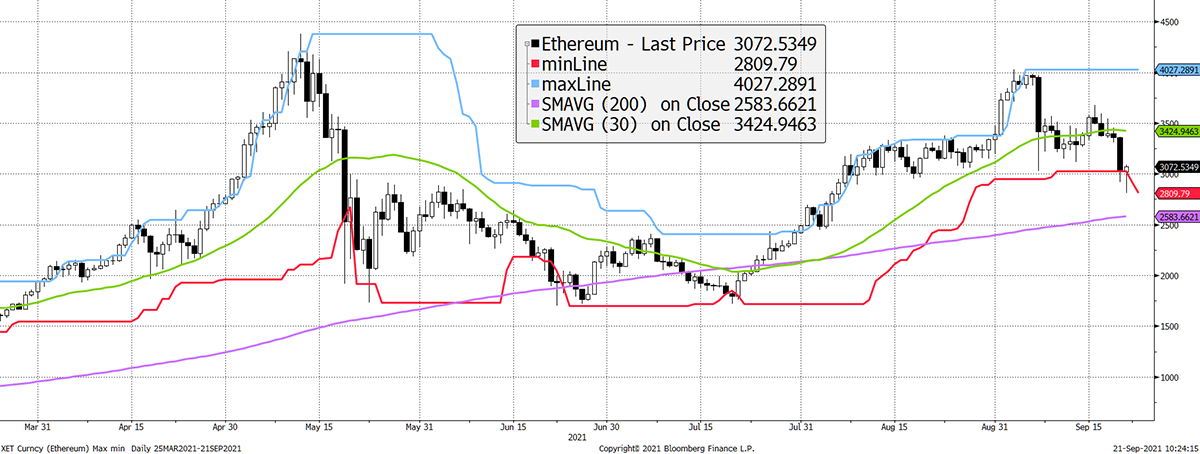
Source: Bloomberg. Ether with 20-day max and min lines, 30-day and 200-day moving averages past six months.
Consider that ETH has spent less time trading above $3,000 than BTC has traded above $50,000. That means there is less overhead resistance in ETH than in BTC. This doesn’t guarantee success, but ETH is technically stronger than BTC.
On-Chain
Bitcoin on-chain activity remains stable compared to last week. That is soft, but with the charts generally unchanged, there is little to say.
Investment Flows
Please take a moment to compare the coins held by BTC and ETH funds over the past three months.
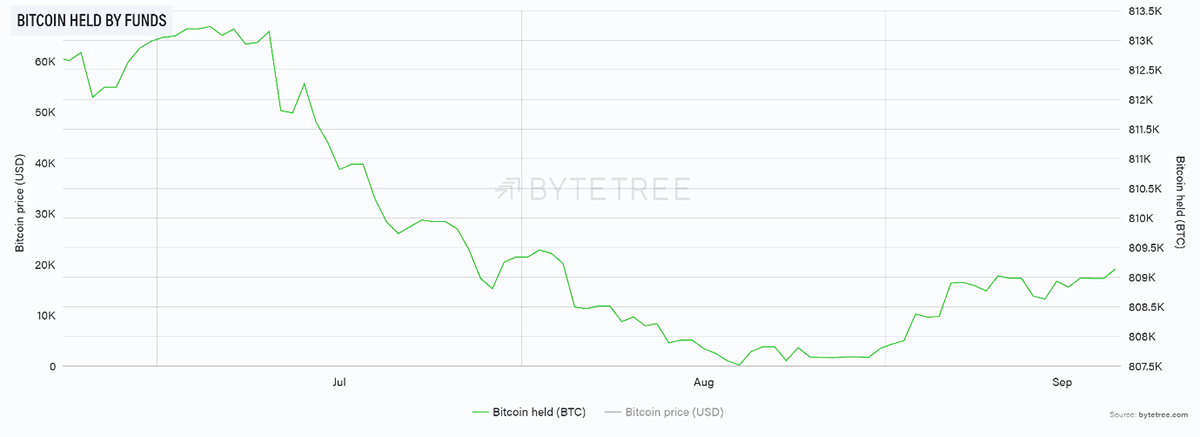
Source: ByteTree Terminal. Bitcoin (BTC) held by funds over the past three months.
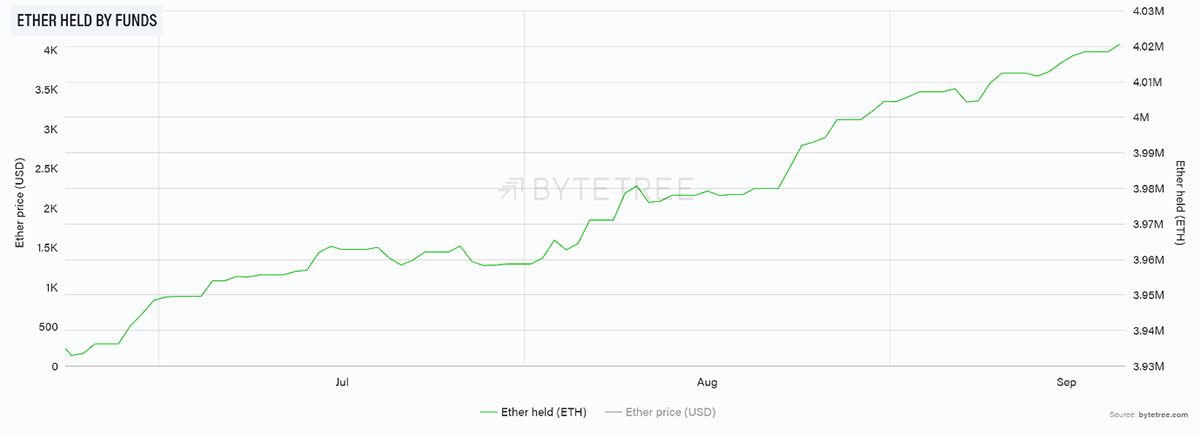
Source: ByteTree. Ether (ETH) held by funds over the past three months.
BTC is rebuilding following a sharp drop in fund holdings in contrast to ETH, which has seen continued inflows. Over the past 30 days, these coins have seen their funds grow by 1,314 BTC and 40,157 ETH.
During that time, bitcoin has seen 29,255 BTC enter the network (via mining), while ETH has seen 133,346. Institutional investment flows are snapping up 30% of the new ETH supply in contrast to 4.5% for BTC. It is a big difference and fundamentally suggests that ETH is better underpinned.
Recall that during the heyday from October 2020 to April 2021, institutional demand exceeded supply, which saw the space take off like a rocket. In the absence of growing on-chain activity, the sheer weight of institutional money can also drive a bull market.
Macro
The Evergrande debacle is the smoking gun, which has caused shockwaves, and for good reason. The company has huge liabilities and massive exposure to global urban real estate. It is the result of years of misallocated capital due to cheap credit, and with that, natural resources. This is precisely what Nakamoto and the cypher-punks feared and is the central reason for bitcoin's creation.
I have a dream that one day Bitcoin will cease to be a risk-on asset. If there was just one hint of resilience during a financial market shock, the price of bitcoin really would go to the moon. The world is crying out for a safe haven.
We asked Patrick Perrett-Green, a global macro guru, a simple question, “How scary is Evergrande on a scale of 1 to 10? 10 very scary, 1 passing storm.” He replied, “6, but more for global growth implications.”
He is telling us that the days of Chinese GDP growth, courtesy of pouring concrete, are behind us. The world will struggle to grow its way out of the current mess. That’s not great for debt as the fiat system depends on growth. Growing debt, slowing growth means even more debt compared to GDP. That’s not good.
One thing that struck us was the US bond market reaction to the Evergrande mess. Inflation expectations (red) fell slightly, which is normal when the stockmarket has a nudge. However, the 10-year bond yield (blue) didn’t.
US treasuries didn’t notice
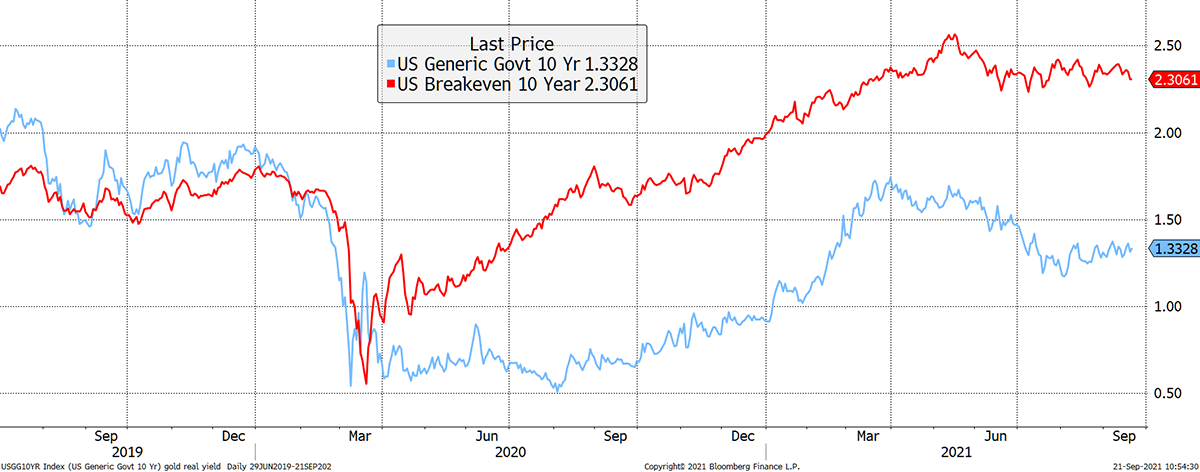
Source: Bloomberg. As described since August 2019.
Evidence is mounting that the financial system is changing. US treasuries, the tried and tested risk-off trade since the early 1980s, didn’t budge. Could it be that treasuries have become useless to investors? Having no yield is one thing, but then giving no return during a financial shock means treasuries no longer serve a useful purpose as a portfolio diversifier. Other than the government itself, who would buy them?
Crypto
The last two digital asset price shocks can be seen via crypto “breadth”. Here we look at the top 100 coins and ask whether they are trading above their 30-day moving averages. It is a way of seeing the general health of the space.
Crypto breadth
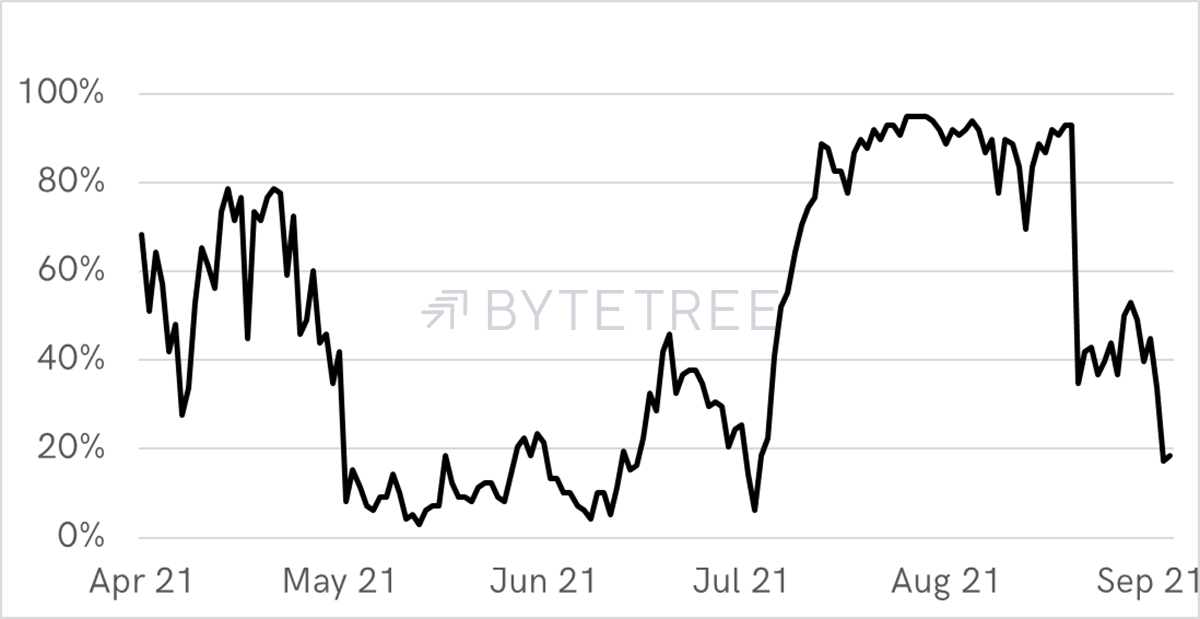
Source: ByteTree. The percentage of top 100 coins trading above their 30-day moving average since April 2021.
This chart is a useful guide to tell us when to start getting excited about tokens again. That’s probably not yet.
That said, we wrote about Tezos last week, and we like it. The project is more credible than people realise, and the Tezos Foundation has $1billion + in reserves, which means the team have staying power. They award grants to further the cause, and they keep on innovating. There is no guarantee they will succeed, but they certainly have the potential to do so. Anything that can survive will eventually thrive.
Summary
We keep bitcoin at neutral, but by a hair’s breadth. The on-chain is stable but soft, as are the flows. The macro is not bitcoin’s fault, but if it blows, all assets will come under pressure. Let’s hope this doesn’t escalate.
The technicals are weak, and that urges caution. A sustained break below $43,000 will imply that bitcoin’s behaviour in 2021 is a repeat of 2014 and 2018. That’s bearish.

