

ByteTree Market Health Update; Issue 91
There are many theories doing the rounds to explain the recent price crash, but at ByteTree, we believe the bitcoin price is at risk because it is structurally overvalued compared to the size of its network. This methodology has been working well for a decade, so why should this time be different?
I’ll get to that, but what just happened to Bitcoin? There’s an old saying that it’s better to travel than arrive. The official adoption of bitcoin as legal tender in El Salvador was something to celebrate. Then, not long after the event, the price tumbled in an 18% flash crash.
Bitcoin tumbles as El Salvador adoption begins
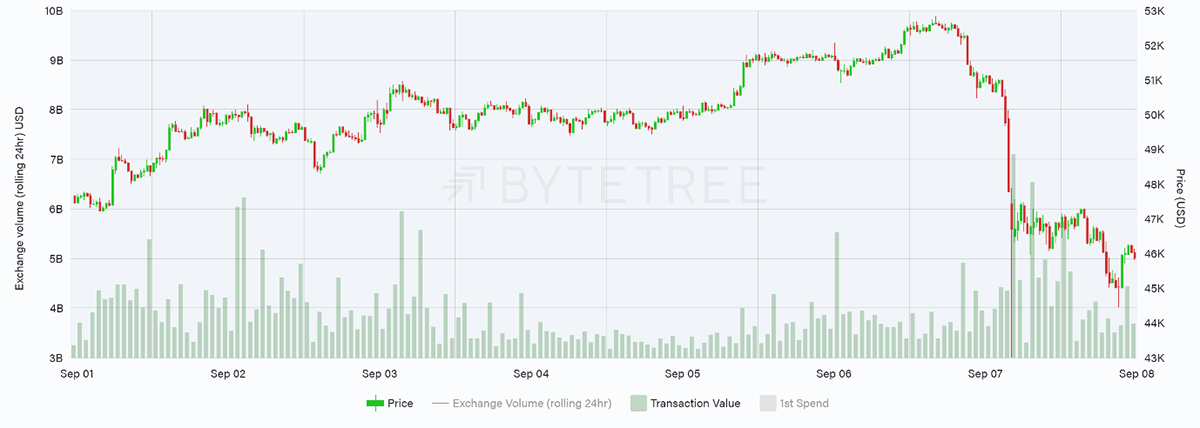
In the run-up to the fall, bitcoin’s price volatility was low, and a trend was building. Some are now saying this led to overconfidence, and the price fall was exacerbated by excessive leverage built up by traders.
Others believe the IMF dumped bitcoin, which they previously acquired to discredit the launch in El Salvador and capture the headlines. There’s also a rumour circulating that the European Union are about to clamp down. All of these theories are plausible to varying degrees.
The NVT is out of whack
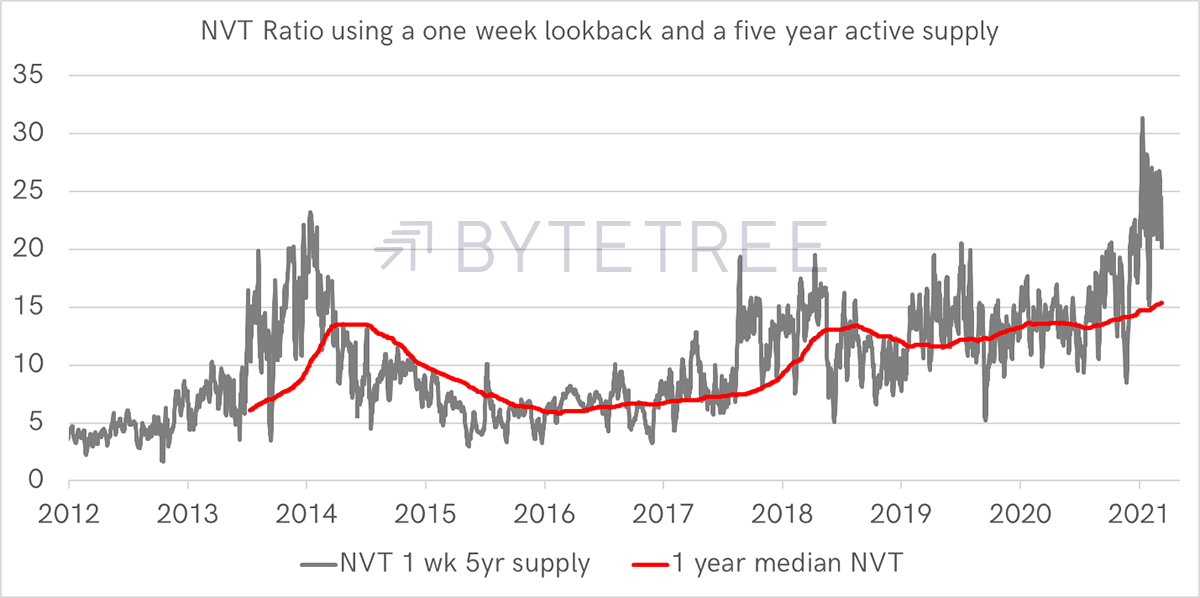
At ByteTree, we keep an open mind, but we like to understand the big picture. One inescapable truth that we have been highlighting for some time is that the Network to Transaction Value ratio (NVT) is unusually high.
The NVT shows you the relationship between the price of bitcoin and an attempt to calculate its intrinsic value. When the NVT is high, the price of bitcoin is expensive relative to the network, and when low, cheap.
ByteTree used to call this the Network to Spend Ratio (NSR) and started calculating it in 2014 using data from Blockchain.com before building a primary data source of our own. It later became known as the NVT ratio by Willy Woo in 2017.
The simple theory is that Bitcoin’s job is to transfer value. If it transports lots of value, it is doing a good job and becomes ever more valuable. And if it stops transferring value, it is failing, and the price will decline. It works like a price-to-earnings ratio in equities.
This relationship is the single most important on-chain metric of them all. It allows the value of the blockchain to be measured and calls out the times when the price is too far ahead or behind fair value. Currently, the price of bitcoin is extended, and the past few months have seen the highest NVT readings ever recorded.
Recent months have seen Bitcoin jump to a record premium
Several adjustments can be made to calculate the NVT, but in principle it links the network value of bitcoin with the amount spent (transfer value in USD) over the blockchain.
Network value as opposed to market cap
The market cap includes all bitcoins mined to date, of which there are 18.8 million, which is an overstatement of reality. The network value is a more useful concept as it allows for adjustments such as removing coins that have never been seen or coins that have not been seen for a defined period of time.
These numbers are widely available from data providers. They are generally accurate and not subject to interpretation.
Transaction value
The amount of value that has changed hands over the blockchain is a complex calculation as the blocks do not give up that information easily. To calculate transaction value, change must be removed, which means every transaction must be analysed using a method that is not standard across the crypto industry.
These numbers are also widely available from data providers, but they are frequently inaccurate, differ wildly and are subject to error.
Given transfer value is the single most important metric in on-chain analysis, we were worried that our data might be wrong.
So we compared it with other data providers.
Is ByteTree Wrong?
With the ByteTree NVT calculation suggesting that Bitcoin was overvalued by 2x, despite a highly successful history, we have reviewed all aspects of our methodology.
The first test is to see how ByteTree data differs from the three industry data leaders: Blockchain.com, Glassnode and CoinMetrics.
It was striking that Glassnode published data that has recently jumped 22 times ahead of ByteTree data. If it were true, and could be sustained, then bitcoin would be dirt cheap. Indeed, we saw a tweet suggesting that was the case.
In any event, Glassnode data is typically 3x higher than ByteTree’s but recently spiked to 22x. Something’s not right.
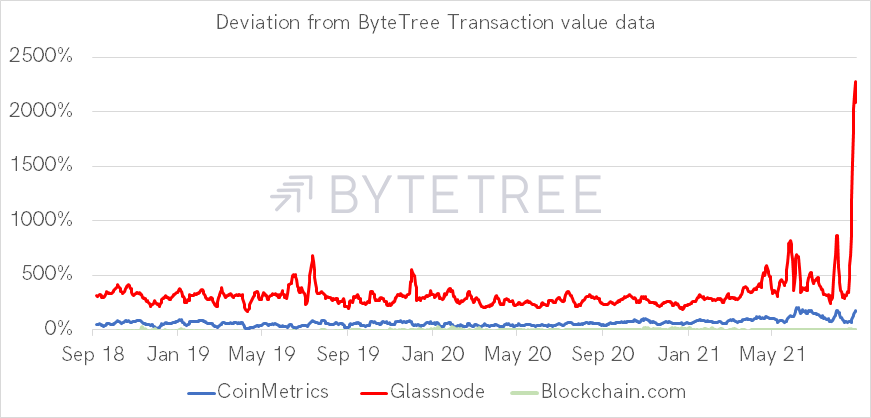
Glassnode data is so far away from the other sources that it had to be removed in the next chart. It is plain wrong.
Blockchain.com, which was the first to calculate transaction value, have similar data to ByteTree. CoinMetrics has been 50% ahead, with a similar spike to Glassnode’s 150% post-May 2021. This is not seen in either ByteTree or Blockchain.com’s data, which are similar.
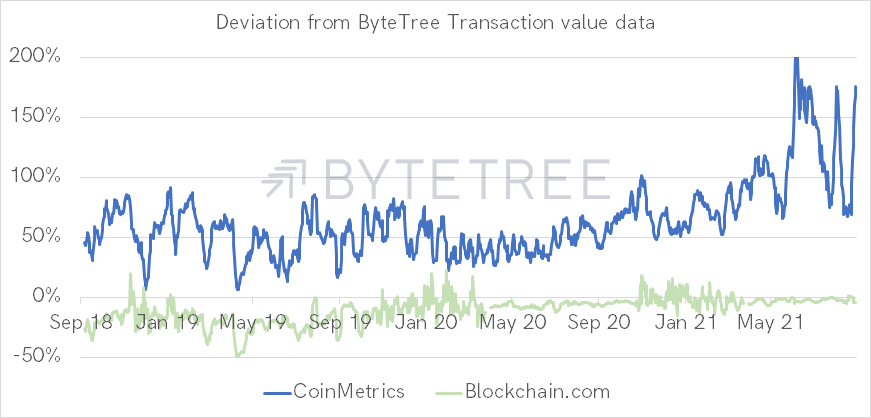
Whatever has impacted the Glassnode data post-May seems to have had some impact on the CoinMetrics data as well. If that data was correct, then bitcoin would be cheap.
We do not believe it is correct because it is unrealistic to see a surge in network activity following the price crash in May. A more subdued patch would be the norm.
Moreover, the past fortnight has seen both Glassnode and CoinMetrics data show high network activity during the weekends, compared to the week. Both Blockchain.com and ByteTree maintain the normal relationship, where a typical weekend sees 18% of the week’s network activity. Busy weekends are the exception.
There is good reason to believe that ByteTree’s methodology used to determine Bitcoin’s most important financial metric is accurate. We take comfort from similar data coming from Blockchain.com; the first to calculate this.
In which case, our NVT calculations are also accurate. Using 1 to 5 years of active supply data and 1 to 5 years of past NVT averages, the lowest fair value for bitcoin is $15,216 (5y5y), and the highest $32,349 (1y1y).
Valuing Bitcoin
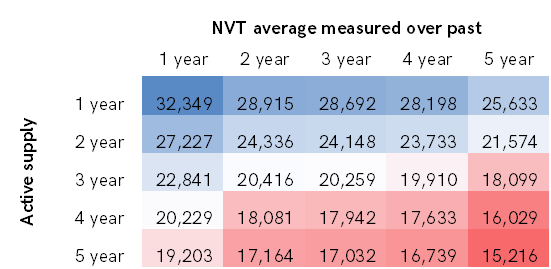
The middle boxes offer a compromise in the $18 to $24k range, in keeping with the data on our site.
With the price touching $52,000 yesterday, even using the most generous valuation measures (i.e. only taking into account the past year’s data), the current price is ahead of events.
In explaining why El Salvador’s launch coincided with a flash crash, we would suggest the biggest risk to bitcoin is the current high valuation. This risk will remain until the level of network activity, which was lost after the China ban, is restored.
This subject is an ongoing discussion in ByteTree ATOMIC - see my latest ATOMIC piece here.


