

ATOMIC 14
Today Bitcoin became legal tender in El Salvador at midnight local time (06:00 UTC). It is an exciting development, and we can’t wait to see what happens next. Could this lead to greater usage and stability? We hope so.
Highlights
| Technicals | Bitcoin breaks into the 50s |
| On-chain | Improving yet still mixed |
| Macro | Rates and inflation potentially bullish |
| Investment Flows | 1,500 BTC purchased, keep going |
| Crypto | El Salvador! |
ByteTree ATOMIC
The ATOMIC view remains neutral.
Technical
The trend remains bullish, with the price getting used to being back in the 50s. There’s still lots of resistance, and so a new all-time high remains possible but will take time. There is a buffer building as the price would need to test the $46k area before giving reason for concern.
Bitcoin trend
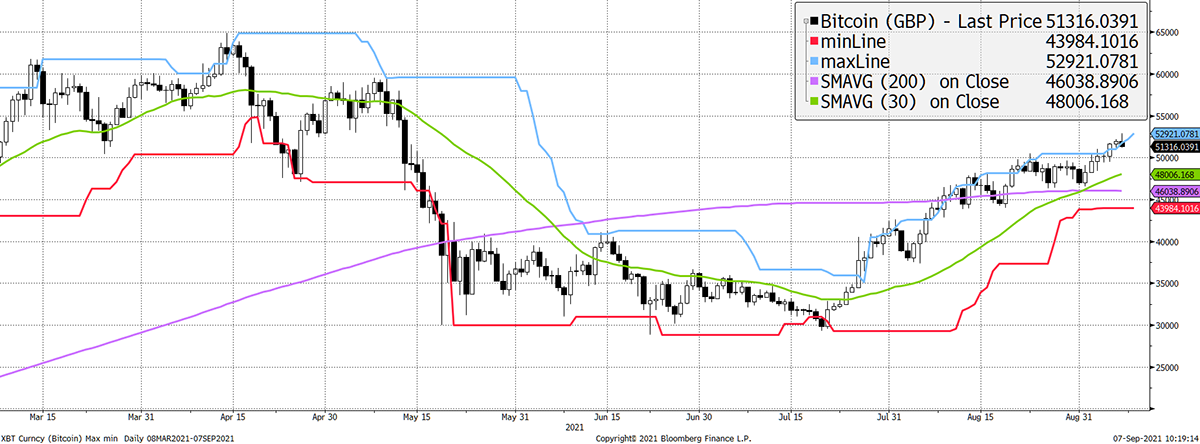
Source: Bloomberg. Bitcoin with 20-day max and min lines, 30-day and 200-day moving averages past six months.
Volatility has fallen again, which means the trend remains relatively calm. The 30-day reading was 45% last week, 41% this week and is falling. That compares to a five-year average of 60%. The trend is fine.
Bitcoin volatility is falling
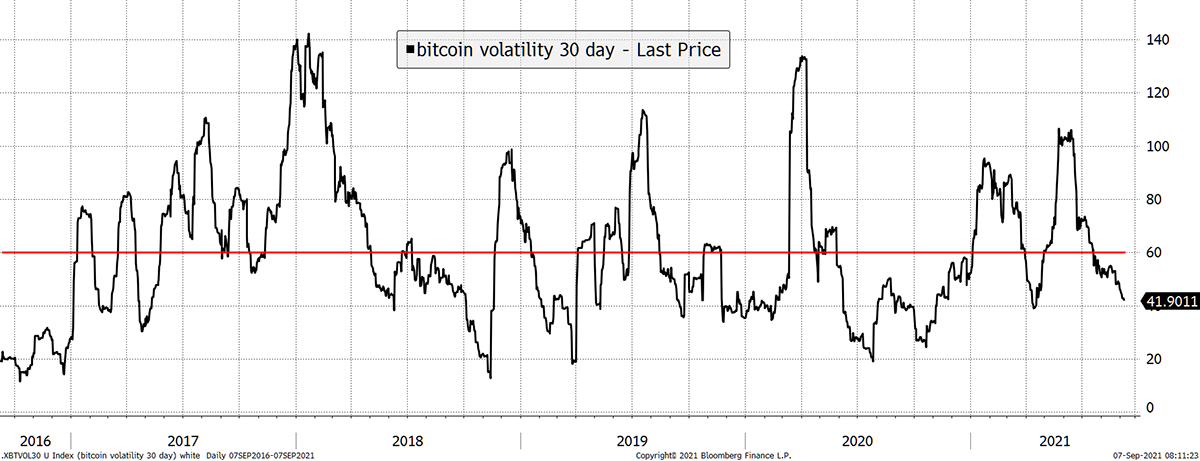
Source: Bloomberg. Bitcoin volatility, realised over 30 days, since 2016.
In addition, the price is not overbought compared to the 30-day moving average. That means this trend is not only strong and calm, but it’s not overhyped either.
Price remains close to the 30-day moving average
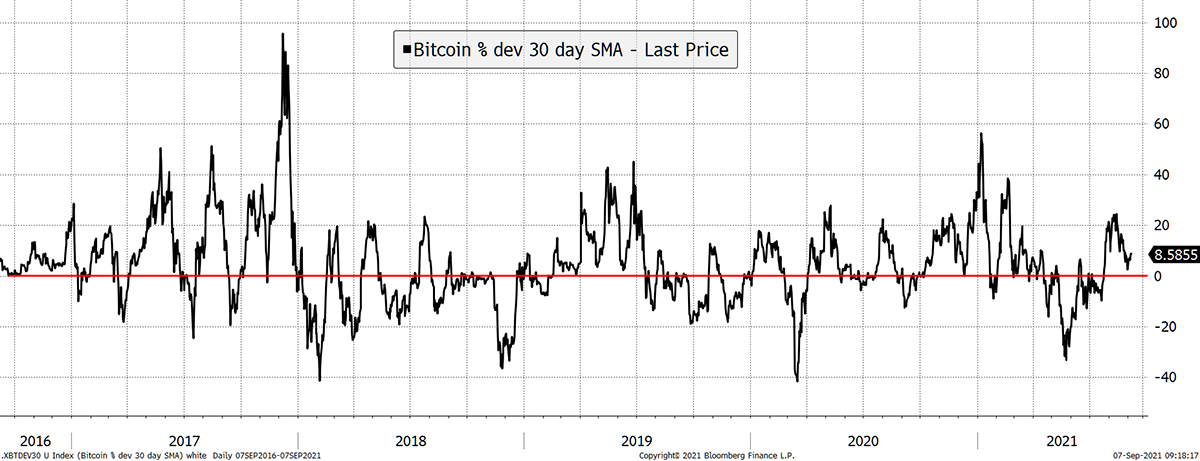
Source: Bloomberg. Bitcoin deviation from the 30-day moving average since 2016.
We repeat, bitcoin’s technical factors are strong, and if that was all that mattered, the dial would point to bull market.
On-chain
There are mixed messages here. Following the China shutdown, the number of transactions is recovering; 2 million tx/week is the new target, last seen in April.
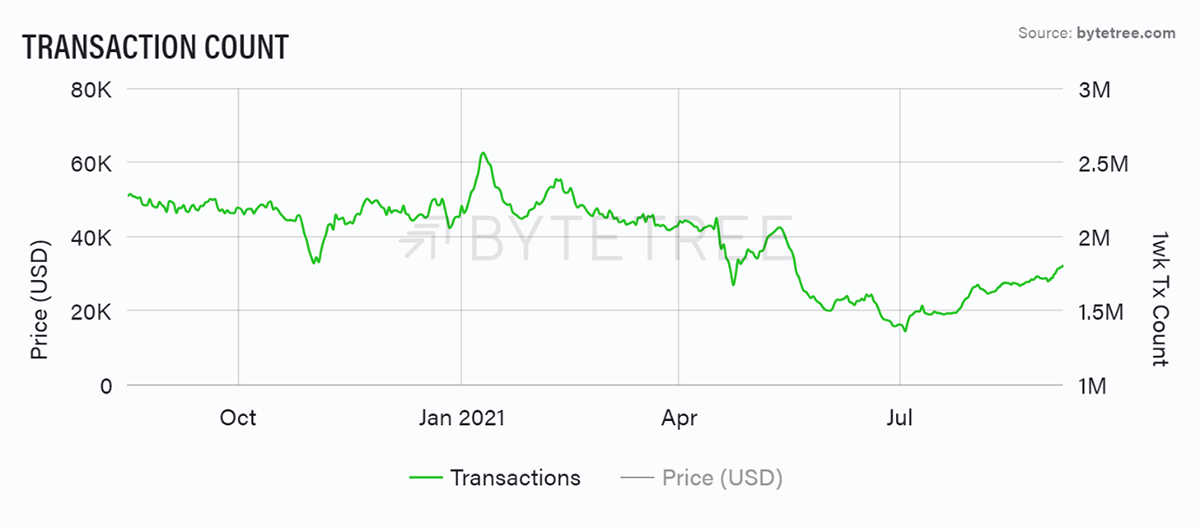
Source: ByteTree. 1-week transaction count over the past year.
More transactions have driven fees higher, yet the fees remain at levels last seen a year ago. The gradual implementation of Segwit has had an impact on reducing fees, which is a good thing in the long-term, as it means the blockchain has more scale. Yet from an econometric perspective, rising fees are something that has consistently been associated with bull markets.
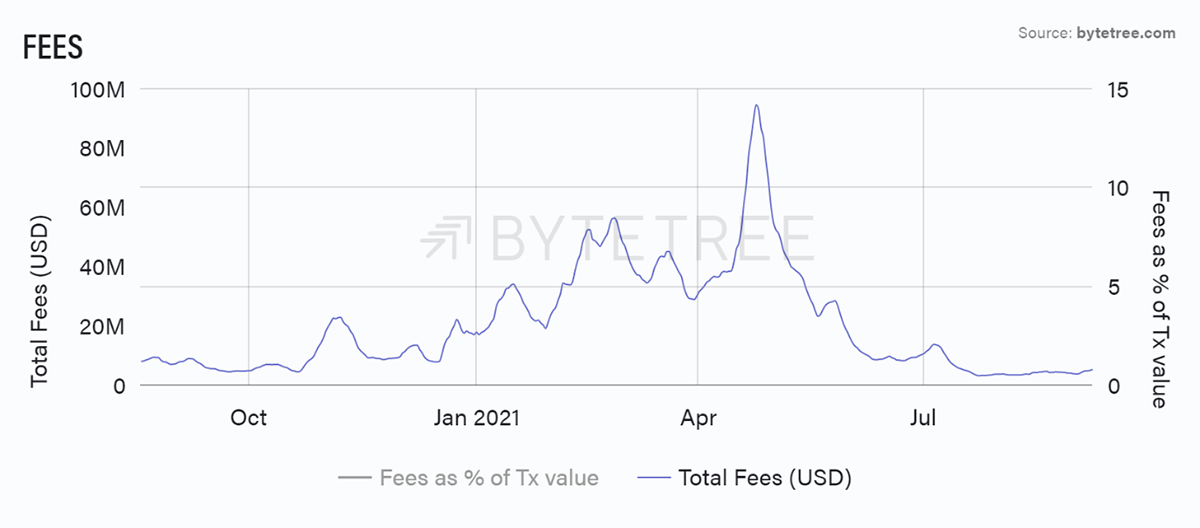
Source: ByteTree. Total Fees (USD) over the past year.
There has been some modest improvement in transactions and fees, but the bigger picture is more alarming, and this is why ByteTree is hesitant to shift the dial to a bull market.
The Network to Transaction Value Ratio (NVT) is something we have been calculating since 2014*
*ByteTree called it the Network to Spend Ratio (NSR). It was popularised as NVT in 2017 by Willy Woo.
It shows you the relationship between price and the fundamental value. When the NVT is high, the bitcoin price is expensive relative to the network, and when low, cheap.
There are several adjustments that can be made to calculate this, but in principle, it links the network value (mkt cap USD) of bitcoin with the amount spent (transfer value USD) over the blockchain.
The network value can include all bitcoins mined to date (mkt cap $950 billion), or it can look at active coins, over say, the past five years, or anytime you care to choose. A lower number of BTC included will reduce the NVT. Here, we have selected the five-year active supply, which excludes lost BTC and coins not seen for a while.
The spend for last week, less complex and batched transactions, amounts to $31 billion. The network value based on a five-year active supply is $761 billion. Hence the NVT is currently 761/31 = 24.5. That is shown on the chart (grey line) with a two-year average.
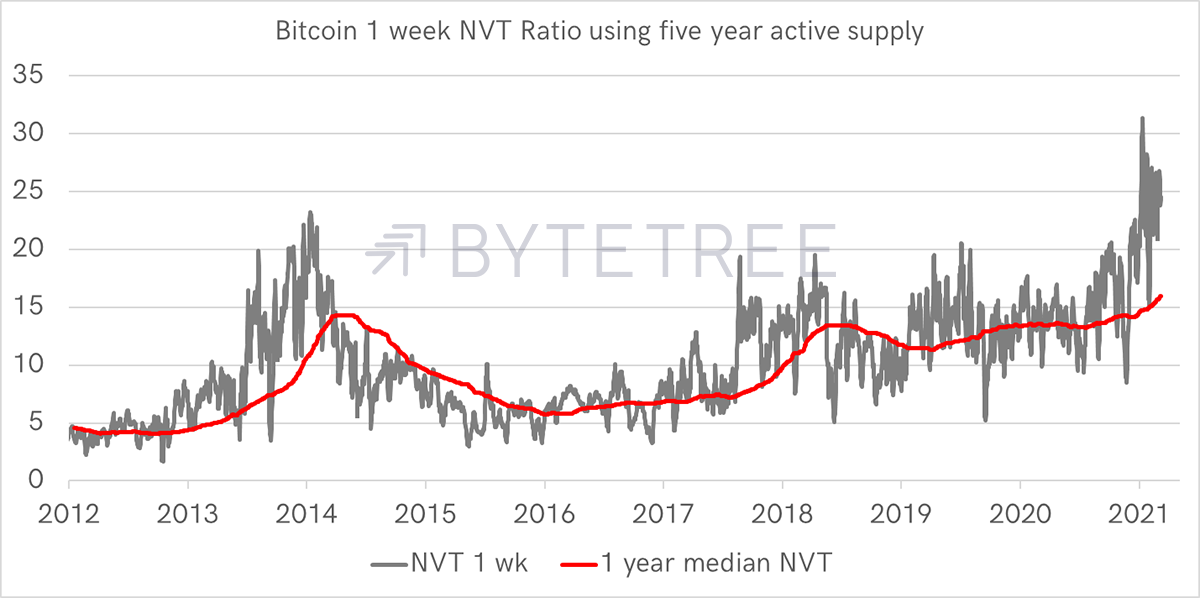
Source: ByteTree. NVT ratio using five-year active supply and one-week transaction value since 2012.
In both 2014 and 2018 (to a lesser degree), we saw high readings following the bull markets as prices remained high while the network didn’t recover. In 2021, we have the highest readings ever seen, all of which have happened after the April market sell-off.
Notice how the red line has drifted higher, with the previous lows exceeding the ones in the previous cycle. This means fewer BTC are moving around the network in contrast to price - equivalent to a high PE ratio in equities.
Some believe this is a structural change as there is less bitcoin around as everyone HODLs. Buy stocks while they last! There’s a problem with that as there are two types of bull market.
- Type one sees the fundamentals improve; investors notice and the price rises.
- Type two sees the fundamentals unchanged; investors don’t mind, and the price rises because the sellers go on strike.
Both of these will see higher prices, but type one is built on strong foundations and will see lasting higher prices, in contrast to type two, which will eventually unwind.
Bitcoin was built on type one bull markets, with occasional type two situations in 2014, 2018, and today.
Even if something has changed, why since May? The $65k all-time high coincided with an NVT at 20. So why now 24.5?
It could be that a network surge is coming or simply that price is ahead of events.
The NVT is a simple yet effective valuation measure with a decade to back it up. It currently remains out of whack, and this is one reason why ByteTree has kept the dial at neutral as opposed to bull market.
Investment Flows
In better news, the ETFs have seen 1,500 BTC acquired over the past fortnight. That’s exciting because the buyers are back.
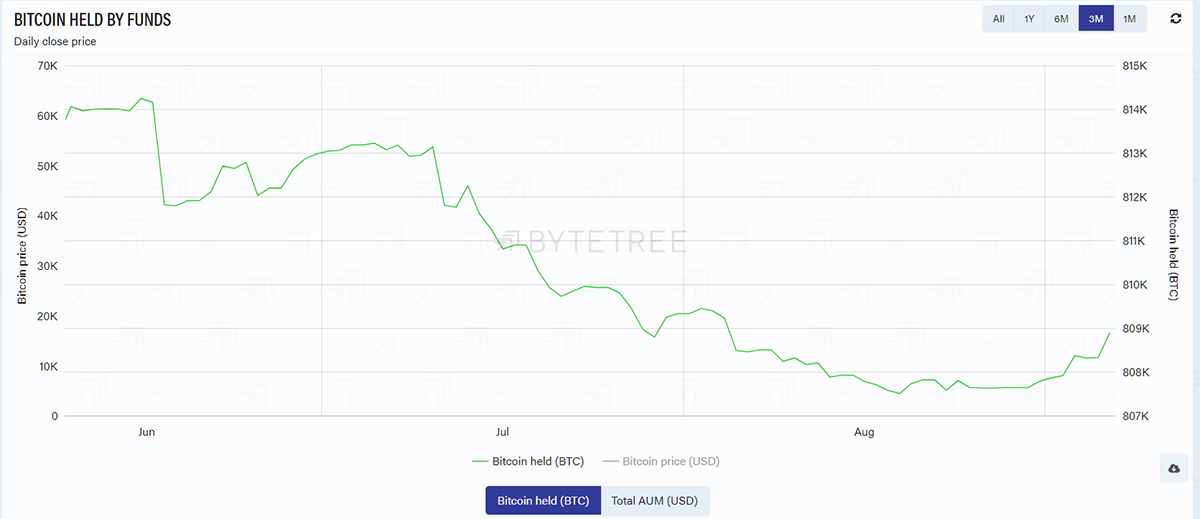
Source: ByteTree Terminal. Bitcoin held by funds (BTC) over the past three months.
Against that, the miners were selling circa 6k BTC per week in early August, which has jumped to 8.5k BTC this week. It means that in the past three weeks, funds have scooped up less than two days’ worth of coins sold by miners.
The Grayscale BTC Trust (GBTC) saw its discount narrow from 16% to 13% yesterday. That is further evidence of more institutional involvement.
It strikes us that the bitcoin summer rally has been driven by stablecoins. In other words, some investors sold high and bought back at lower prices. This is not new money entering crypto.
For a sustained bull market to $100k and beyond, the network needs to see significant amounts of net new money enter the space.
Macro
Another evolving positive is the fall in bond yields may have stalled (blue). Inflation expectations (red) have stabilised, and despite the Fed’s transitory talk, evidence of higher inflation mounts (see below).
By combining rates and inflation, you get “the curve” that doesn’t exist in proper economic analysis, but we like it regardless. In recent years, it has highlighted risk-on conditions, which have been bitcoin bullish.
US bond yields
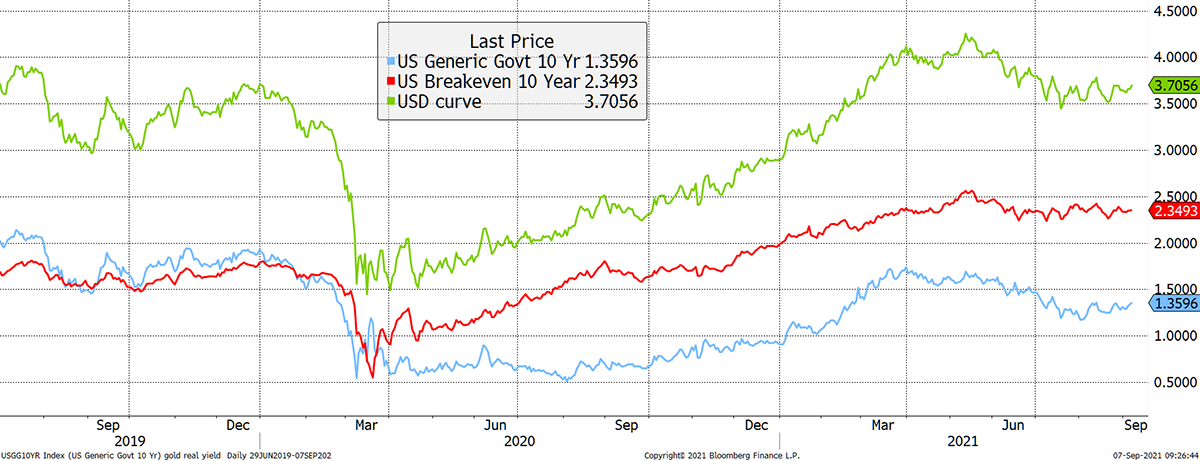
Source: Bloomberg. US 10-year bond yield, breakeven and the curve since 2019.
Here’s an anecdote of inflation, seen via the UK electricity price. Similar charts are popping up around Europe. It could mean one of two things. Either we pay more for electricity, or alternatively, we can’t afford to. In 2008, high energy prices were a significant contributor to the recession that followed. It wasn’t just the banks.
What happened to cheap energy?
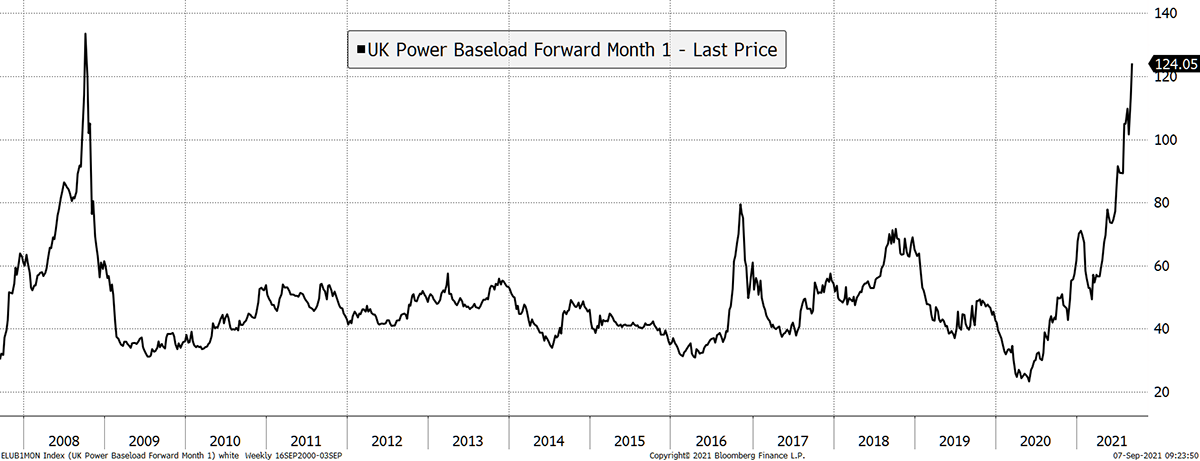
Source: Bloomberg. UK baseload electricity price 1 month forward since 2008.
If higher electricity prices are here to stay, the ESG attacks on bitcoin will become ever louder, even if mining takes place using renewables somewhere.
Crypto
Today Bitcoin became legal tender in El Salvador at midnight local time (06:00 UTC). It is an exciting development, and we can’t wait to see what happens next. Could this lead to greater usage and stability? We hope so.
In other news, Ethereum had its first deflationary day whereby more coins were “burnt” than were mined. This is a new feature that will reduce supply over time. This alternative approach to economics is terrifying policy makers whose finest tool is a printer. It confuses them.
Summary
The ATOMIC view remains neutral. Our hesitation in calling a new bull is the low level of network activity relative to the high price. It could be that something has structurally changed, but if so, we aren’t sure what it is. A similar divergence was last seen in 2014 and 2018. We know that much.

