The Bitcoin Market Is Flashing Amber

Disclaimer: Your capital is at risk. This is not investment advice.
ATOMIC 12
The last time we saw such a fast change in trend was back in October 2015, when the price was $264. Back then, on-chain activity was killing it and price was lagging the fundamentals. It was such a clear call to make at the time because growth, value, and trend were perfectly aligned.
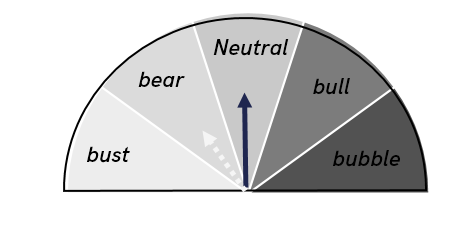
Highlights
| Technicals | Fastest trend improvement since October 2015 |
| On-chain | Neutral |
| Macro | Jackson Hole and a slowing economy |
| Investment Flows | A buyer is found |
| Crypto | Dominance still not rising despite the surge |
ByteTree ATOMIC
Maintains neutral
Technical
By any measure of the technical picture, the trend continues to scream buy. It is true that price is in the resistance zone, which ought to slow things down, but it doesn’t have to stop it.
Before I move onto the trend, I wanted to highlight the calm nature of this rally, despite the speed. The chart below shows the deviation from the 30-day moving average.
The price was 33% oversold on 23 May, yet kept falling for another two months before reversing. At the time of the last low on 20 July, the price was a mere 9% oversold. Yet today, and even after a significant rally, the price is 15% above trend, which is somewhat punchy, but no cause for concern. Healthy, more like.
Bitcoin deviation from moving average
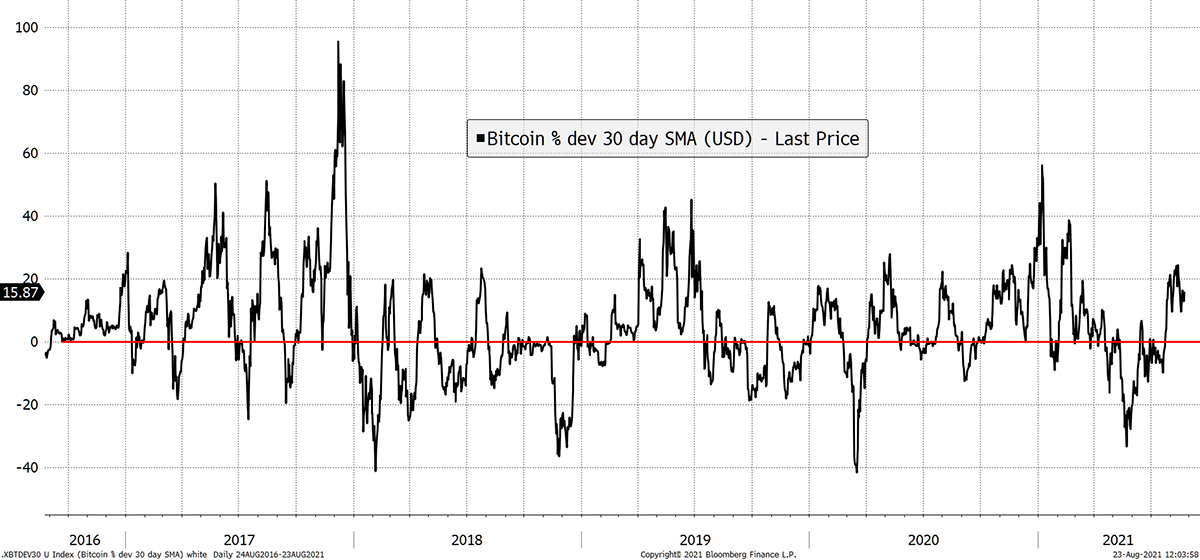
Source: Bloomberg. Bitcoin deviation from 30-day moving average since 2016.
With the price above $50k and the 30-day trend at 43k, that is not particularly stretched. More importantly, the trend score is a very respectable 5 out of 5, not seen since early April. We’ll explain.
Bitcoin trend
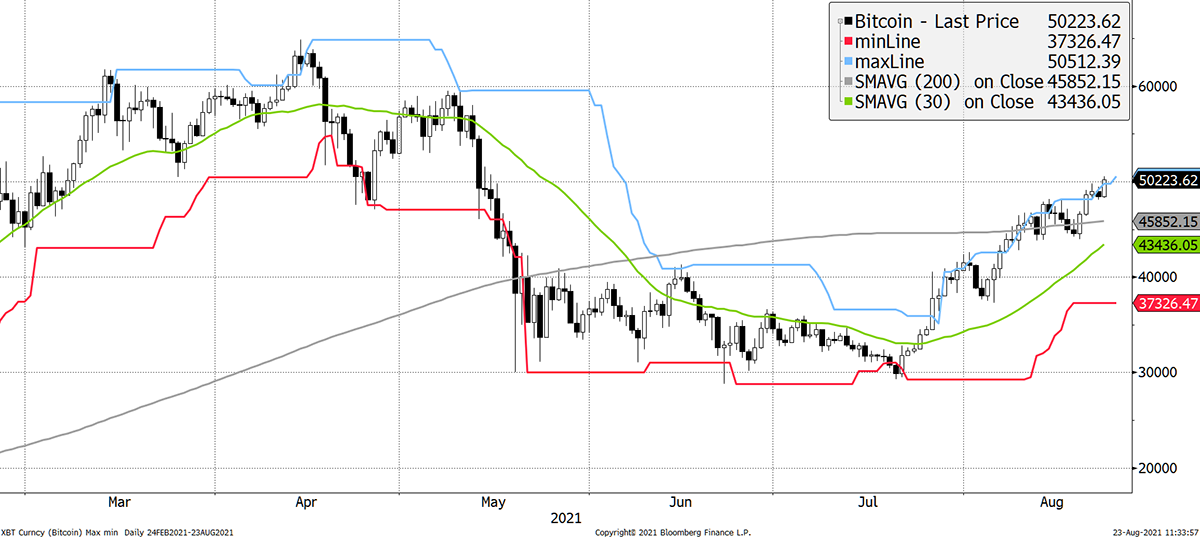
Source: Bloomberg. Bitcoin with 20-day max and min lines, 30-day and 200-day moving averages past six months.
ByteTree trend score
A trend scores a point for each of the following criteria:
- Price is above the 200-day moving average
- Price is above the 30-day moving average
- 200-day moving average is rising
- 30-day moving average is rising
- The last touch of the max/min lines was blue
On these criteria, Bitcoin’s current trend achieves a score of 5 out of 5. It is a simple idea that dates back to the Turtle Traders that captures “fat tails”. When the trend is zero, there is no good news, and when 5, there’s no bad news, at least from the perspective of the trend. It can still be extended and so on, but currently, it isn’t.
The below chart shows bitcoin’s trend score since 2013. It touched zero on 22 July for just one day before this rally began. Zeros are common in bear markets (2014, 2018) and periods of consolidation (2015, 2019).
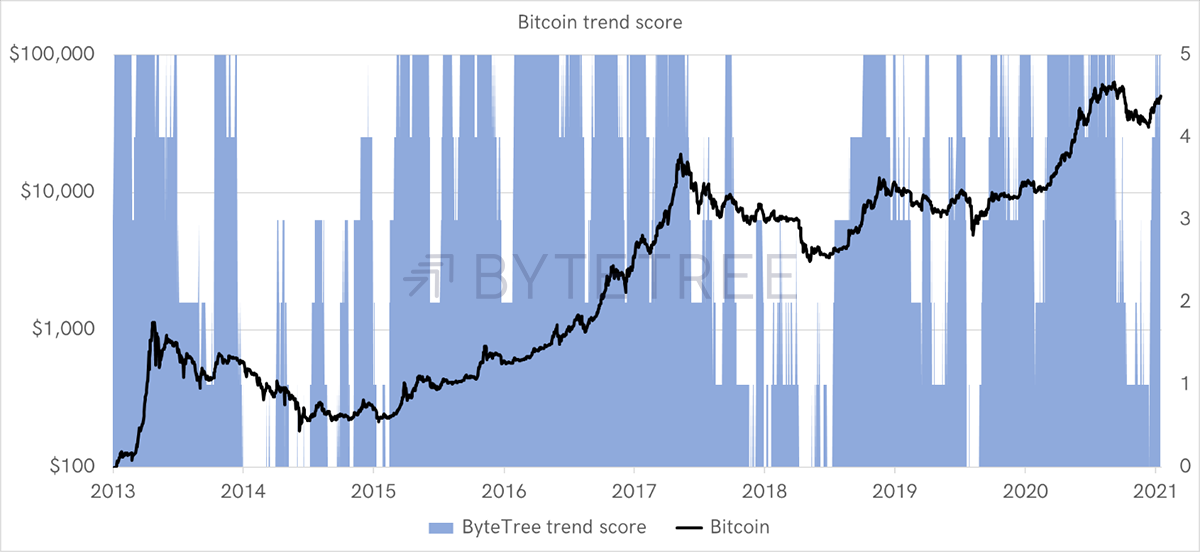
Source: ByteTree. Bitcoin trend score since 2013.
The last time we saw such a fast change in trend was back in October 2015, when the price was $264. Back then, on-chain activity was killing it and price was lagging the fundamentals. It was such a clear call to make at the time because growth, value, and trend were perfectly aligned.
That we haven’t seen a zero turn into a five so quickly since gives you a sense of the magnitude of this turnaround.
Incidentally, a score of zero is a money-losing strategy, turning $100 into $50 since September 2013, when buy and hold managed to create $38,418. Better still, a score of two or more turned that $100 into $124,097.
Since the start of 2019, a zero-score turned $100 into $84, with three or better $1,847, when bitcoin delivered $1,318.
A trend-based system will never beat bravado or luck when buying the dip, but it keeps you out of trouble and significantly reduces risk and volatility. As the saying goes, the trend is your friend.
On-Chain
Transactions are improving, which is good to see. It is notable how many trading pairs have shifted to stablecoins which explains much of the fall in transactions. But given the collapse in April, the Chinese crackdown was also impactful.
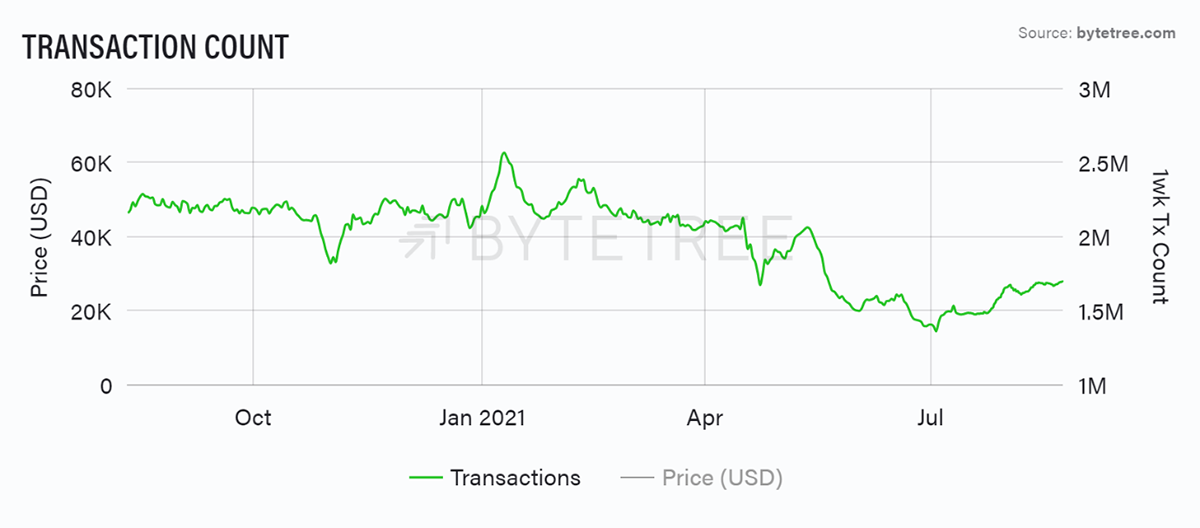
Source: ByteTree Terminal. 1wk transaction count (cumulative, rolling) over the past year.
And the Institutional Dominance Ratio (IDR) holds above 99%, which is the bullish threshold.
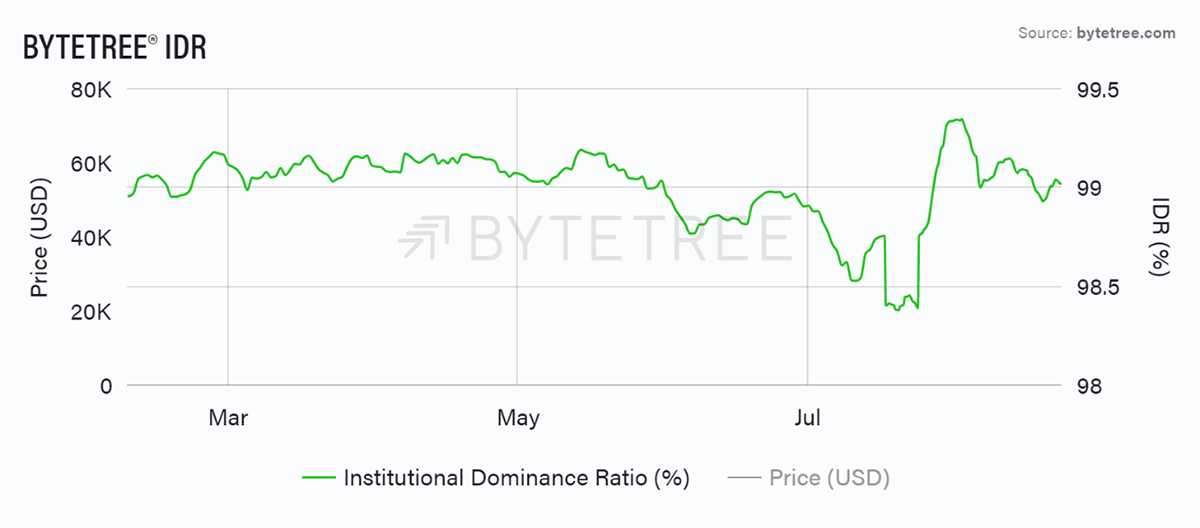
Source: ByteTree Terminal. The Institutional Dominance Ratio (IDR) % since February 2021.
Fees are also stronger but still low.
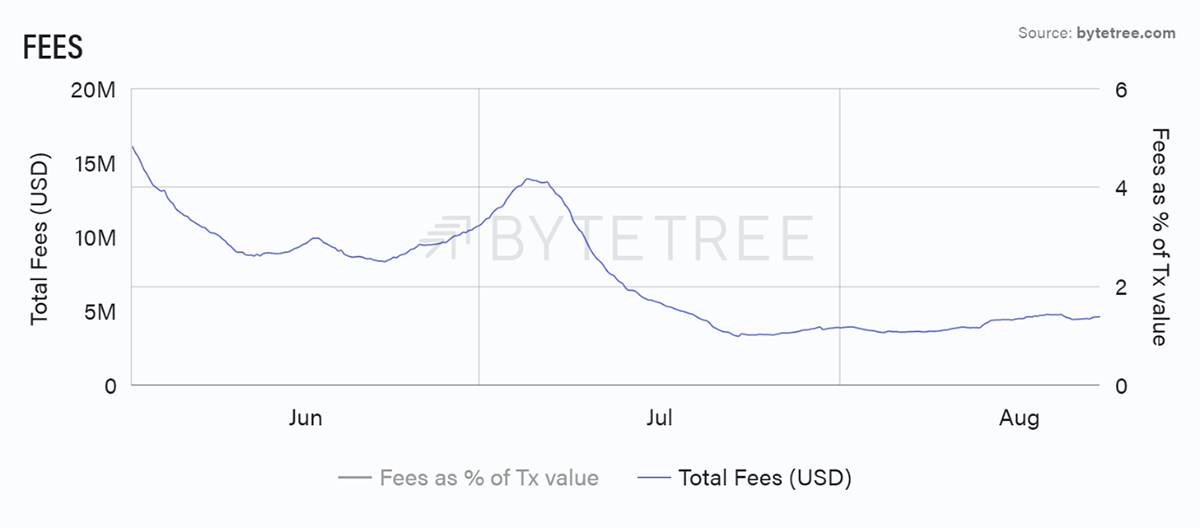
Source: ByteTree Terminal. Total Fees (USD), 1wk cumulative rolling, over the past 12 weeks.
Activity is picking up but remains materially below the levels we’d expect to see with current prices. It begs the question of whether something has structurally changed in the market.
Investment Flows
The fund flows saw a purchase of 311 BTC on Friday. This is small, but I’ll take it, and it is much better than continued selling. FOMO will set in, and the institutions will be back.
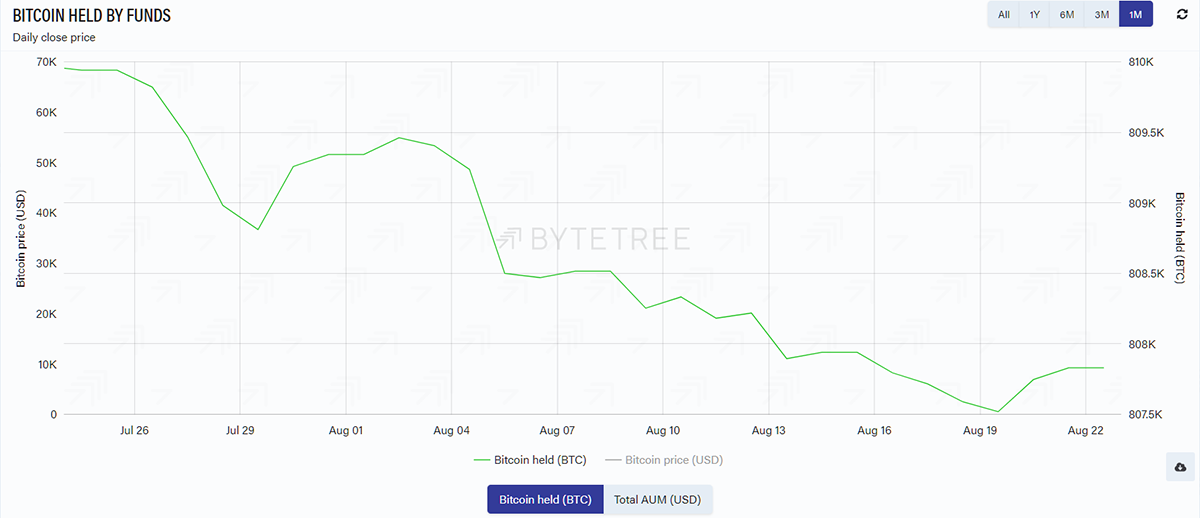
Source: ByteTree Terminal . Bitcoin held by funds (BTC) over the past month.
Then yesterday, we witnessed over $1 billion of stablecoins headed to the exchanges ready to buy. It is clear that this rally has been fuelled from within. Wherever we have looked, there have been no signs of external money creeping in.
The gamechanger is the stablecoin.
In cycles past, there wasn’t the option to sit on the sidelines. Stablecoins have changed that and have turbocharged this rally.
Macro
The world’s central bankers meet at Jackson Hole on Wednesday, at least virtually. The fact that it’s virtual suggests it will pass as a non-event. The economy is cooling, and the Fed will be in no hurry to slam on the brakes.
The fear is they will “taper”, which means slowing down the rate of quantitative easing. The likelihood is they will keep kicking the can down the road unless Biden wants the stockmarket to resemble Kabul.
I show the US housing market where sales have turned down versus new builds. Would you taper aggressively into that?
US home sales slowing
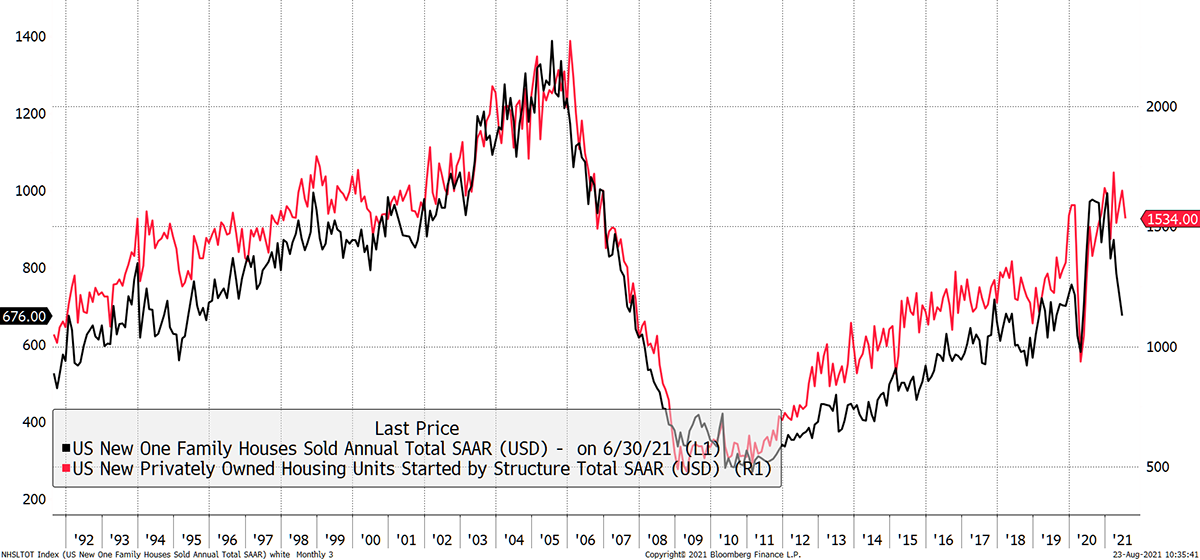
Source: Bloomberg. US housing new units and sales since 1992.
The Citigroup economic surprise index is falling into weak territory, meaning the data coming through is softening.
Slowdown
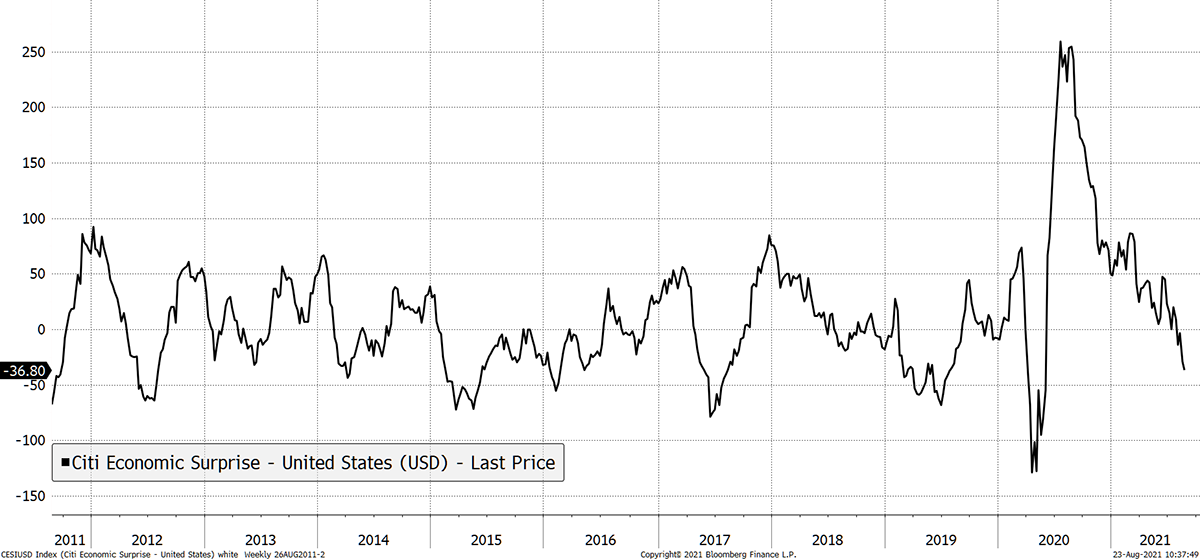
Source: Bloomberg. Citigroup economic surprise Index since 2011.
And to remind ourselves why we don’t like tapering. When QE stopped in 2014, Bitcoin died for a while. Then in 2018, when the actual taper came about, it was killed again.
Bitcoin dislikes tapering
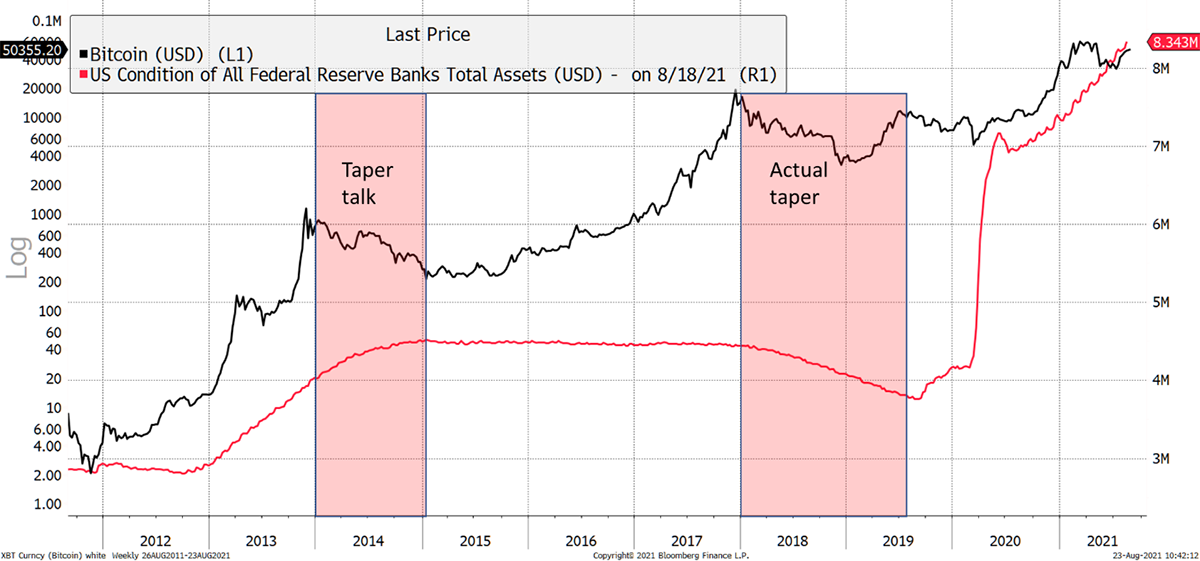
Source: Bloomberg. US Fed balance sheet and bitcoin since 2011.
Crypto
In other news, PayPal is allowing UK users to trade crypto. This is bullish. Maybe one day the UK regulator will allow people to buy Bitcoin funds again. They banned them when the price was $10k.
Also, consider that this is a broad rally where many tokens are in front. That trend score you saw earlier? We plan to make it available for dozens of tokens in the coming weeks for Premium subscribers.
Summary
ATOMIC remains neutral but is leaning towards a bull. Something significant has changed, and the old rules need updating, but it would be good to see stronger on-chain data before confirming a bull. We also await better fund flows. Given the recent price strength and the search for diversification, it would be little surprise if they start picking up.
While remaining neutral we are delighted that we made the shift from bear to neutral two weeks ago, within seven days of the low.
