Fresh Air Between $20k and $30k

Disclaimer: Your capital is at risk. This is not investment advice.
ATOMIC 7
Since 2010, a total of $3,251,841,501,701 ($3.25 trillion) has been transferred over Bitcoin’s blockchain over approximately 4,500 days. I show the BTC price in thousand-dollar increments and the amount transacted at those levels.
Highlights
| Technicals | Breakdown |
| On-chain | Weak and ignore the weekend spike |
| Macro | The delta variant propels risk-off |
| Investment Flows | 1,000 BTC sold by funds |
| Crypto | No hideouts |
To warm you up, here is a chart showing the number of days at which the Bitcoin price has traded within thousand-dollar bands.
Number of days Bitcoin has traded at various price levels
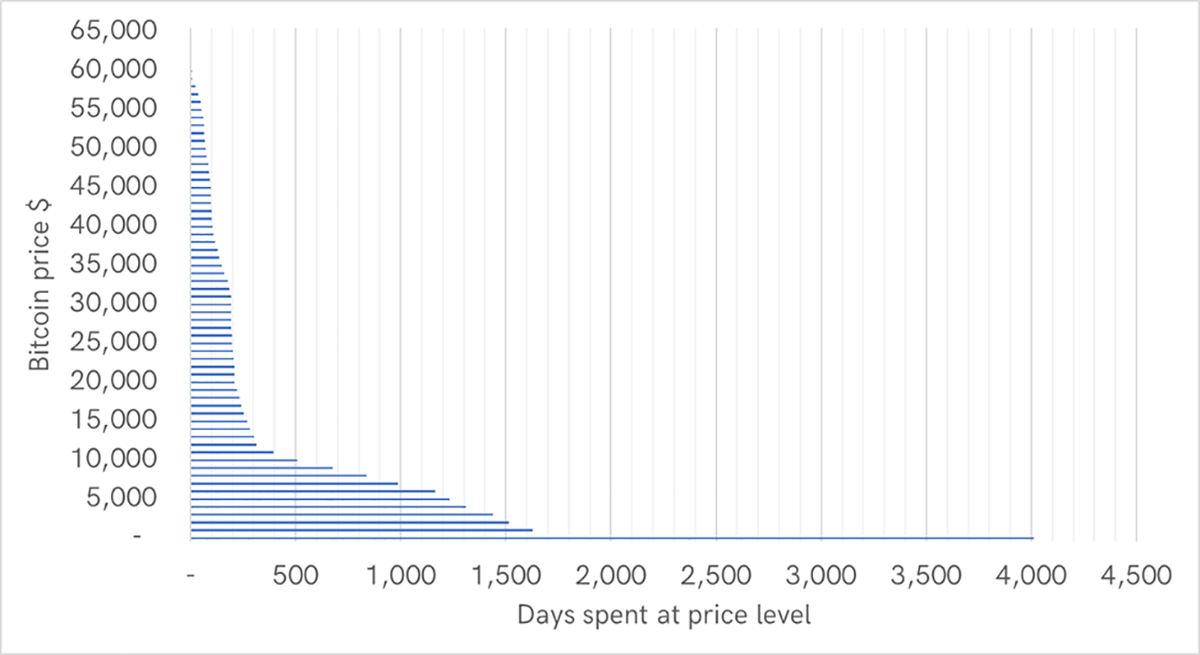
Source: ByteTree. Number of days Bitcoin has traded at stated price level since 2010.
While it was at those prices, it was doing its job and transferring value. Since 2010, a total of $3,251,841,501,701 ($3.25 trillion) has been transferred over Bitcoin’s blockchain over approximately 4,500 days. I show the BTC price in thousand-dollar increments and the amount transacted at those levels.
Bitcoin price with transaction value levels
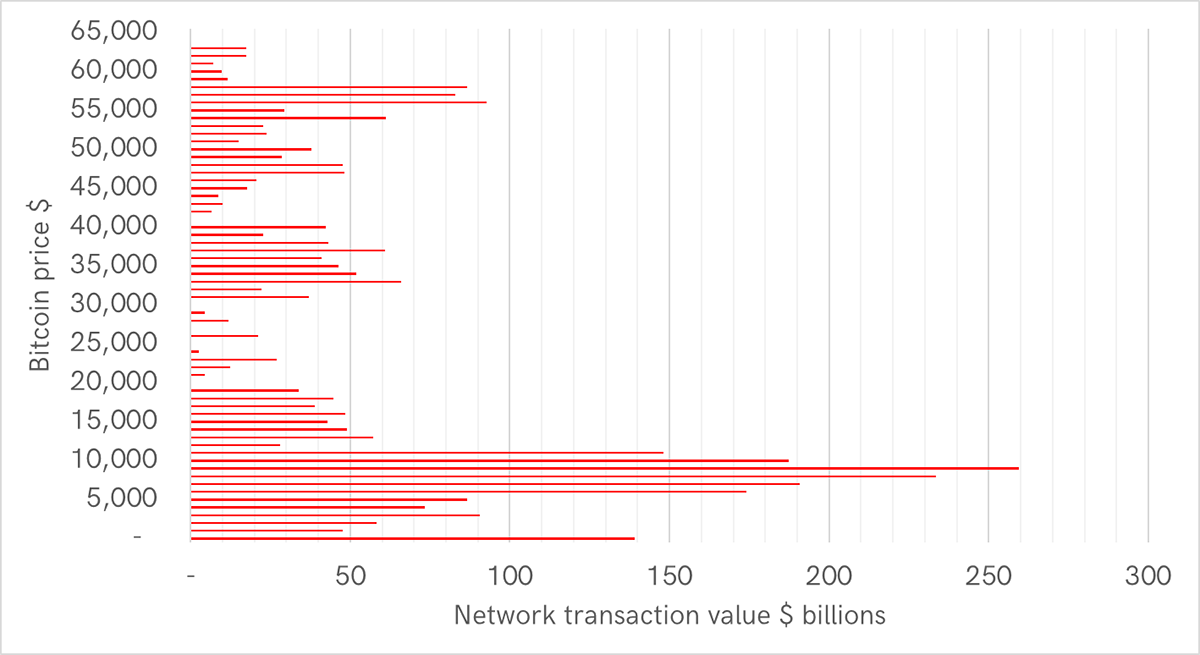
Source: ByteTree. Total on-chain value transferred at price levels since 2010.
The clusters show the areas of huge economic activity. The largest is the $9k to $10k level, where Bitcoin has seen 8% of all transactional activity. You might find it useful to see as a percentage.
Bitcoin price with percentage of past transaction value by level
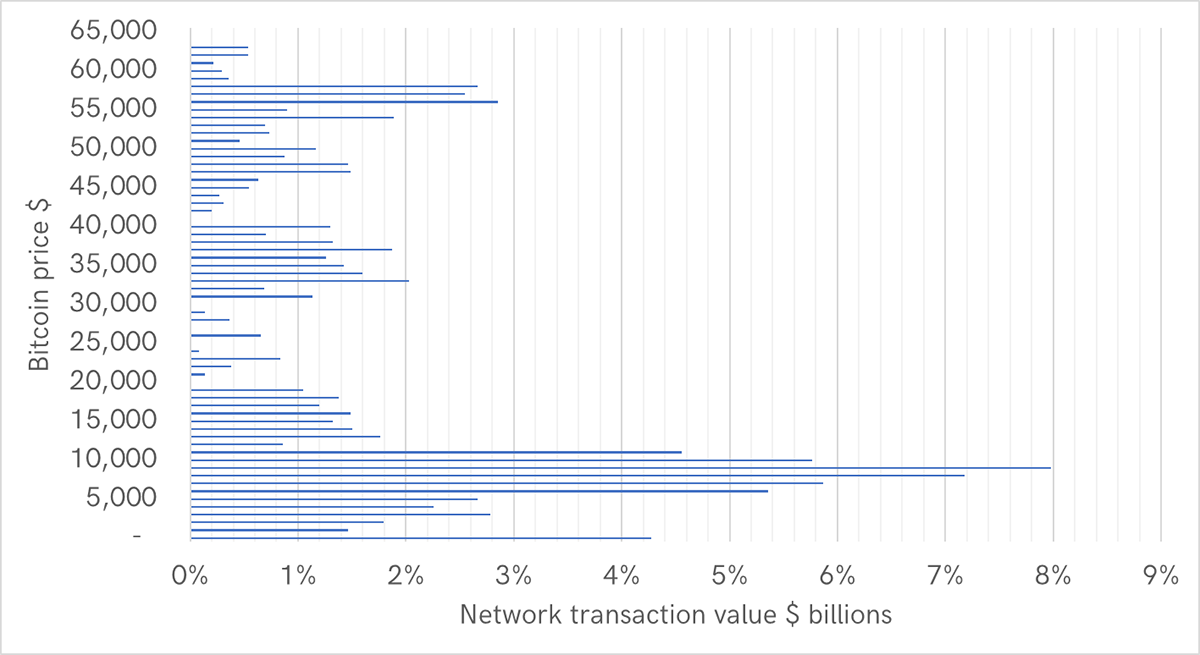
Source: ByteTree. Total on-chain value transferred by percentage at price levels since 2010.
It turns out that 40% of traffic has occurred with the price between $5k and $11k, and 52% with the price below $11k. It sinks in when you zoom out.
Bitcoin weekly with $5k to $11k shaded
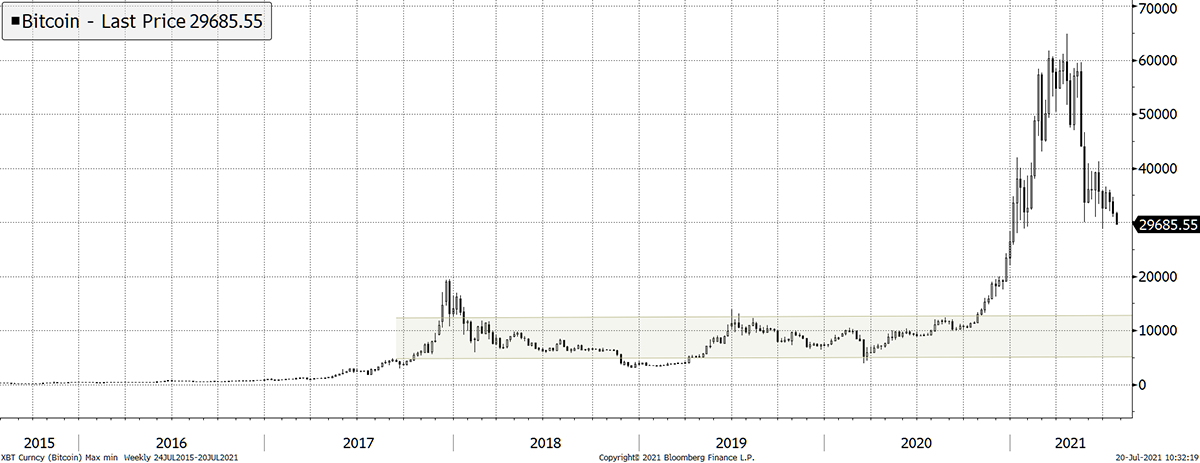
Source: Bloomberg. Bitcoin weekly with $5k to $11k shaded since 2015.
Professional technical analysts use a concept called value-at-price (other names too), often displayed as a histogram. The idea is that the heavily traded areas offer support and resistance, in contrast to the lightly traded areas, which represent “fresh air”. Price is supposed to move slowly through the heavy areas, and quickly through the light ones.
Recall how the Bitcoin price rose quickly between $20k and $30k, and again when it surged from $40k to $50k. It did the same in reverse. We have already seen the $50k to $40k drop happen in a matter of days; $30k to $40k has been busier since early January, and has recently provided support.
The point is to remind you that the support between $30k and $20k is thin, but there is much more between $11k and $20k. A break could happen quickly.
ByteTree ATOMIC
Technical
Last night Bitcoin broke below $30k on an intraday basis, mimicking the panic move in late June. If it holds, that will be the first close below $30k since New Year’s Day.
Bitcoin trend
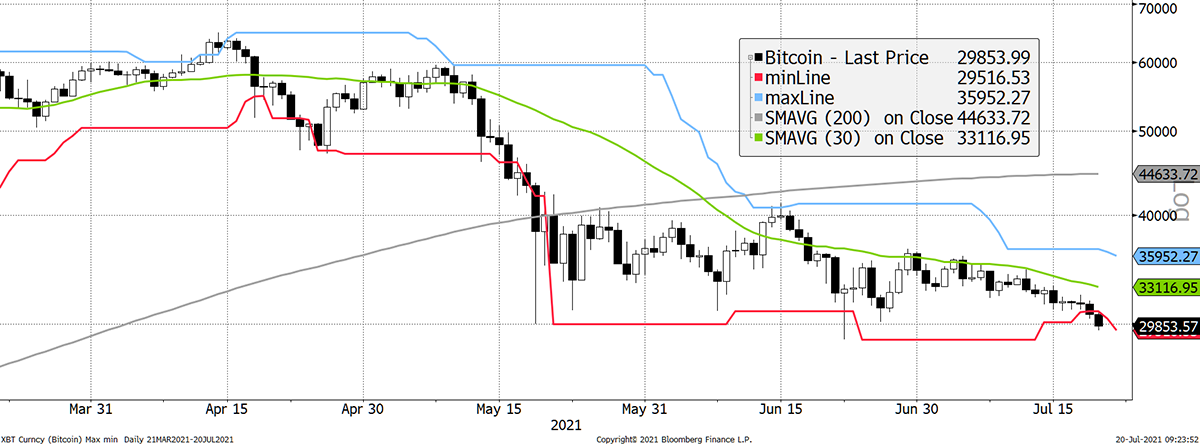
Source: Bloomberg. Bitcoin with 20-day max and min lines and a 200-day moving average 2021 year to date.
The tight range from last week is widening again with the downside giving way. Bulls should be looking to breakouts above $35k before a trend change seems likely.
Notice how the 200-day moving average is turning flat. I stand by my forecast for it to be falling by mid-August. Other than the key levels described, I don’t see any useful levels or trend lines at this time.
On-chain
I gave the valuation and network case last week in detail.
There have been two on-chain events. First, we had a large transaction cluster on Saturday morning. $5bn of BTC was shifted in a series of batched transactions. We believe this traffic was non-economic, and therefore price neutral. More here.
It is irritating because it flatters fair value slightly and will not wash out until Saturday. In any event, better to understand these things than not.
Macro
This delta variant is a real pain. Like many of you, I have been itching to buy some flights and escape following a year of lockdown. If the world goes back into hibernation, a risk-on environment is hopeful. And we need one because Bitcoin thrives during risk-on conditions.
I presume that this means Bitcoin will respond positively to the next lull in infections; Delta, Lamda and so on. I’m no medic, but once these things are widespread, they can only go into retreat. The point is that what’s bad for Bitcoin now could trigger a bull run at a later date.
Anyway, it’s gold’s turn.
Bitcoin thrives when both the bond yield and inflation expectations are rising. It’s hardly 2008, when they were collapsing, but they are both falling. The real rates (yield less inflation) are shown at the bottom and are falling, which should drive gold higher.
Rates point to slowdown
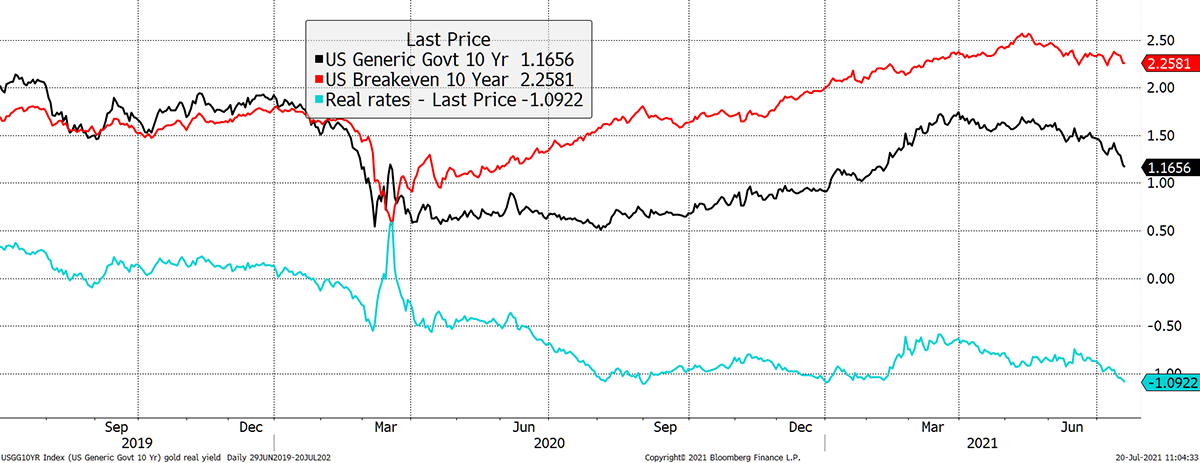
Source: Bloomberg. As described past two years.
Gold was flying until last August when Bitcoin started to warm up for an October breakout. Just as Bitcoin took off, gold turned down. It stands to reason that the baton gets handed back to gold while Bitcoin takes a rest. Bitcoiners would be better off understanding this.
Morris gold fair value at an all-time high
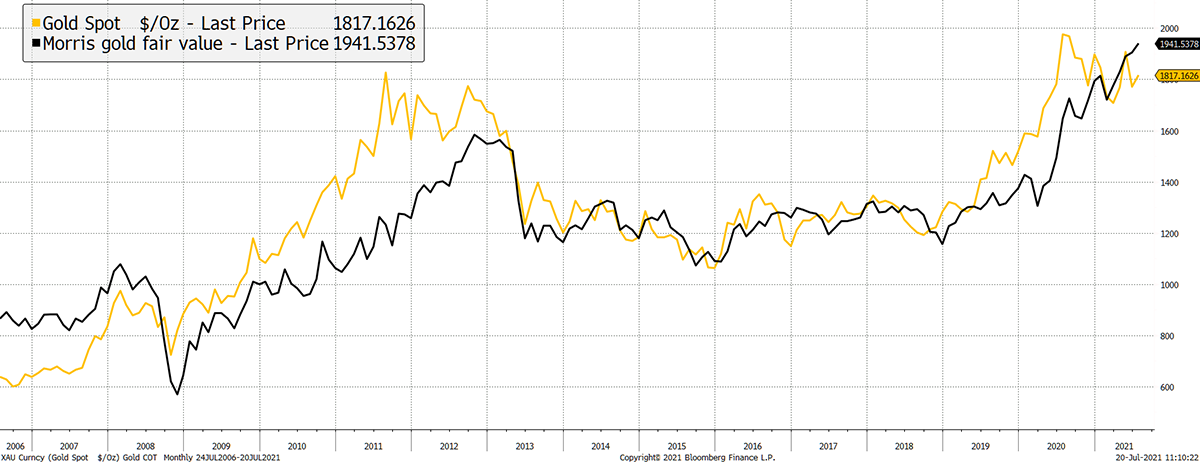
Source: Bloomberg. As described - more can be found here.
Never in history has the case for gold been so strong. My model is telling us that an ounce is worth $1,941 while it trades at $1,817. I can only assume gold will resume its bull run, and as it starts to cool off, that’ll be time to buy Bitcoin.
Investment flows
We have now seen 7,000 BTC sold by funds and ETFs over the past month. That settled down until the past week where 1,000 BTC have been sold.
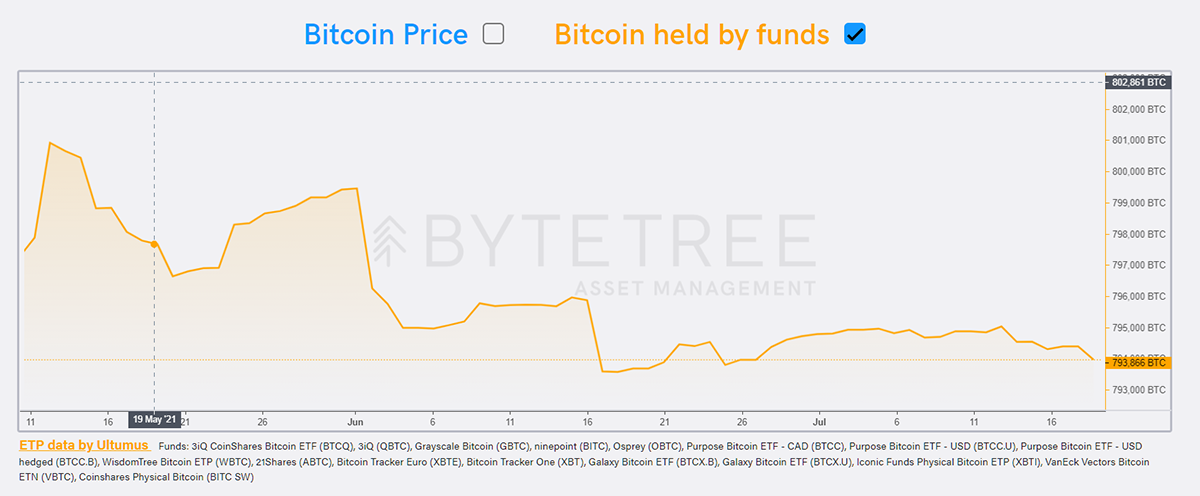
Source: ByteTree Asset Management. Bitcoin held by funds.
The market can’t take much selling pressure as it is already too weak. The miners know this and are rebuilding inventory. When they sold an additional 20,000 BTC in May, the price felt it and subsequently halved. June was stronger as the selling pressure was absorbed. I doubt it would be today.
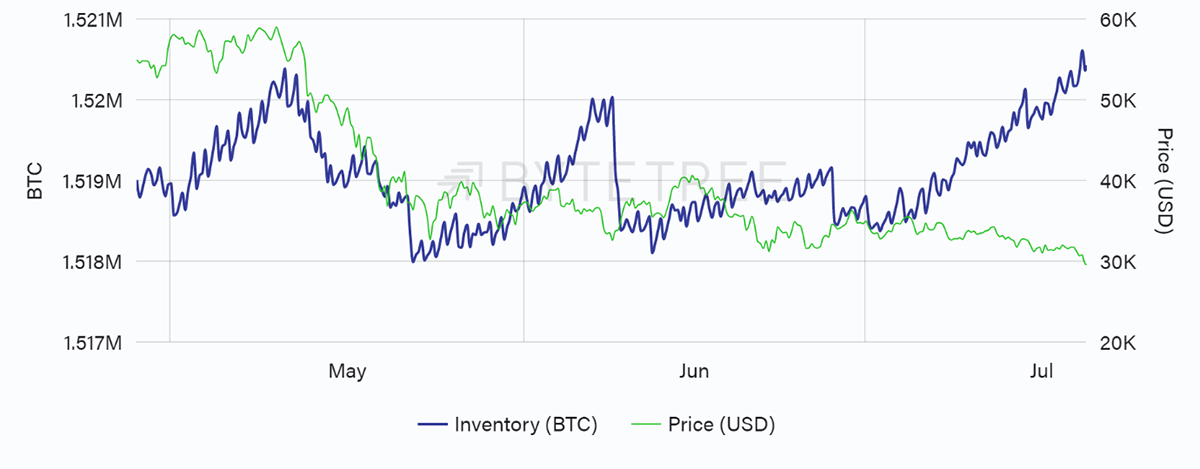
Source: ByteTree. Bitcoin miner inventory (BTC) and the price of bitcoin (USD), over the past 12 weeks.
Perhaps a rogue miner breaks ranks and dumps like they did in late 2018. These guys need their own version of OPEC. Organisation for Bitcoin extorting companies (OBEC), perhaps.
Closed-ended funds
The Osprey Bitcoin Trust (OBTC) saw its premium shrink from 24% to 1% in recent weeks. The fund has $106m in assets, so it is small compared to the others, but it reminds us of the impact of downward pressure from modest fund selling. It also reminds us how dangerous premiums are.
Crypto
Altcoins have slowed this week, which is another defensive signal. Below I highlight Ethereum and Bitcoin over the past three years. It will be interesting to see is BTC proves to be more defensive once again.
BTC and ETH
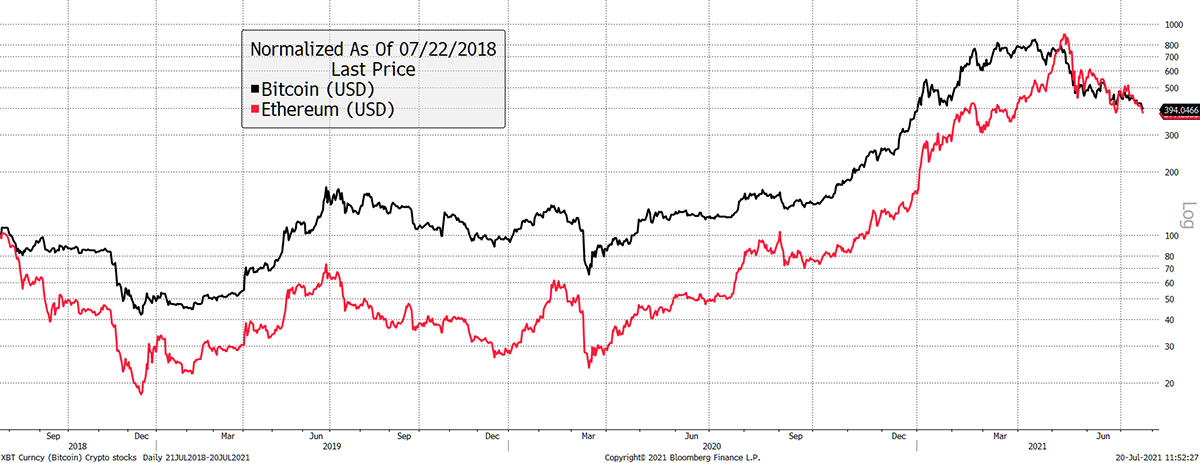
Source: Bloomberg. Bitcoin and Ethereum rebased past three years.
Summary
I have received some feedback that ATOMIC is too long. Noted.
I am probably overdoing it as premium is new. It will settle down, and I will endeavour to make much more noise as bullish signals start to emerge.

Comments ()