

ATOMIC 6
I want to look at ByteTree’s valuation work on Bitcoin. The methodology came to be in 2014 and has seen some improvements since. In essence, Bitcoin’s job is to transfer value, and the more it transfers, the more valuable it becomes, and vice versa.
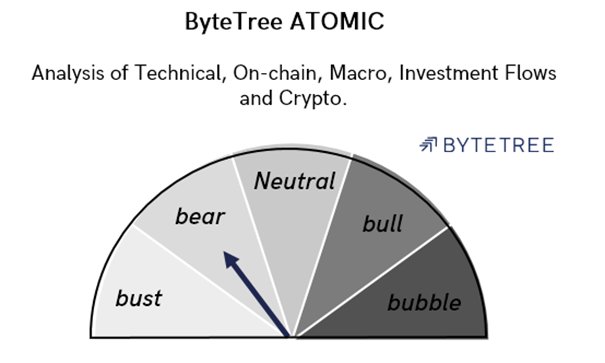
Highlights
| Technicals | Price range is a tightening range |
| On-chain | Network activity must improve, or price will collapse |
| Macro | Tech stocks remain a supportive force |
| Investment Flows | Neutral |
| Crypto | Crypto stocks are dreaming |
In recent weeks, the network has seen a huge decline and our Fair Value with it. These numbers are published on the “network” tab on the ByteTree Terminal.
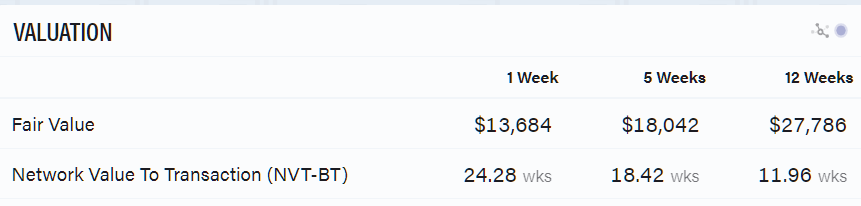
The NVT-BTis telling you the number of weeks of network transaction value (dollar amount transacted over the blockchain) to equal market cap (or specifically adjusted network value). The post-2011 average is around 7.2 weeks, but last week it was 24.28 weeks. Over the past five weeks, it has averaged 18.42 and 11.96 over the past 12 weeks.
The adjustment I have made over the years is to recognise that things change. The 7.2-week historic average is not an anchor but a moving target. Post-2018, this has started to rise, principally because the number of BTC on the move has fallen as many coins are HODLed or perhaps even lost.
As a result, ByteTree now uses a 2-year median NVT as a reference point, which allows for long-term change. That currently sits at 12.6 weeks, which is materially higher than the historic 7.2 weeks.
The number seen last week was alarming. Basically, the amount of blockchain activity is far too low to sustain current prices. This needs to change either with more network activity or a lower price. One of these will happen. Which one?
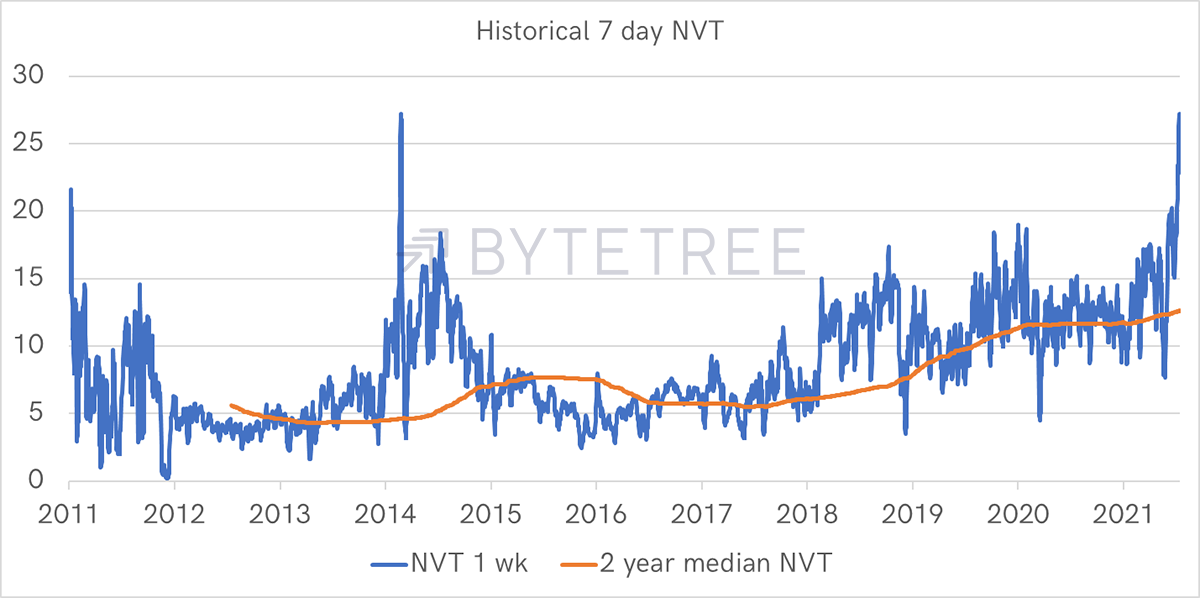
Source: ByteTree. 7-day NVT and the two-year median since 2011.
This NVT is the basis for a simple Fair Valuemeasure, which by the way, has an R squared of 0.912 over the past five years (strong link to price). We believe it is a reliable method, demonstrated by the fact that price revolves around it. Naturally, it can dislocate for prolonged periods, but it remains a strong fundamental measure of fair value.
In the valuation table above, there are the one week, five-week and 12-week measures. These are simply smoothings (moving averages) over the stated periods. The 12-week measure will be more stable than the one week, but it will lag.
Fair Value is calculated by referring to the two-year median NVT and the current level of network activity to suggest an implied fair Bitcoin price. It is a bit like saying XYZ company deserves to be 10x earnings. Given earnings are $3 per share, the fair value is $30 per share.
The 2014 bear market
Back in 2014, the network value collapsed while the price remained elevated. The NVT spiked in the above chart, which can be seen in more detail below. I have used 12-week Fair Value lines for clarity.
Price and fair value in 2014
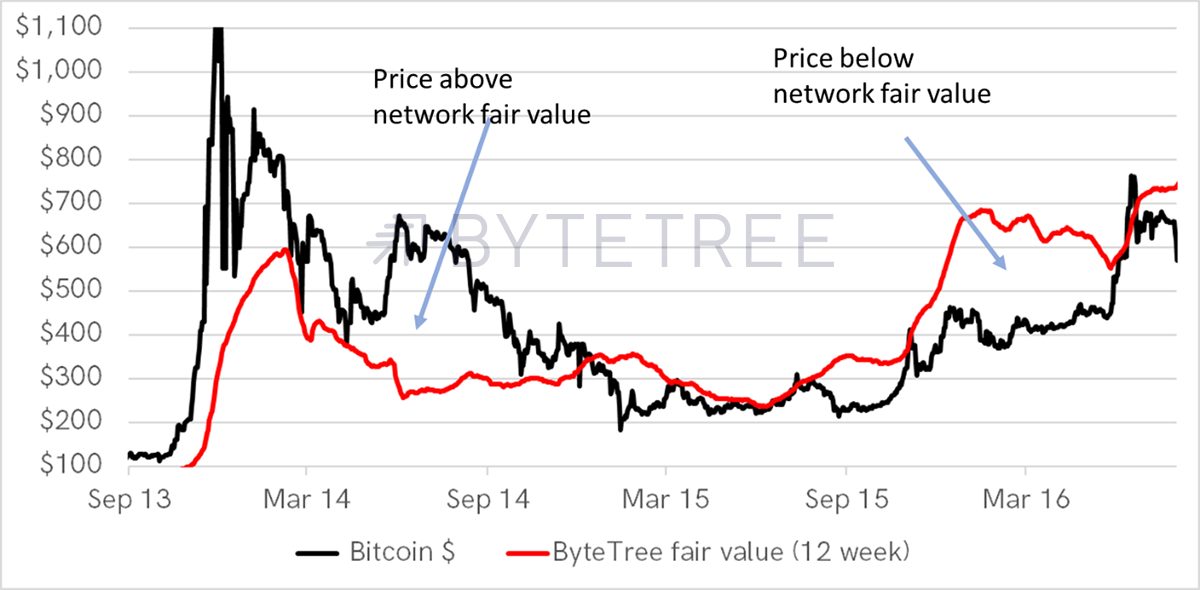
Source: ByteTree. 7-day Fair Value and price 2013 to 2016.
2014 saw a divergence where the network collapsed, yet price held up. Price then crashed in the second half of the year. In late 2014, price was too low and subsequently recovered. Then the network grew quickly in 2015, and the price surged.
The 2018 bear market
In late 2017, the price peaked ahead of Fair Value, but it didn’t last. Early 2018 shows the lagging nature of a 12-week smoothing, but it soon resolves itself. Yet again, price held up for several months and didn’t crack until November.
Price and Fair Value in 2018
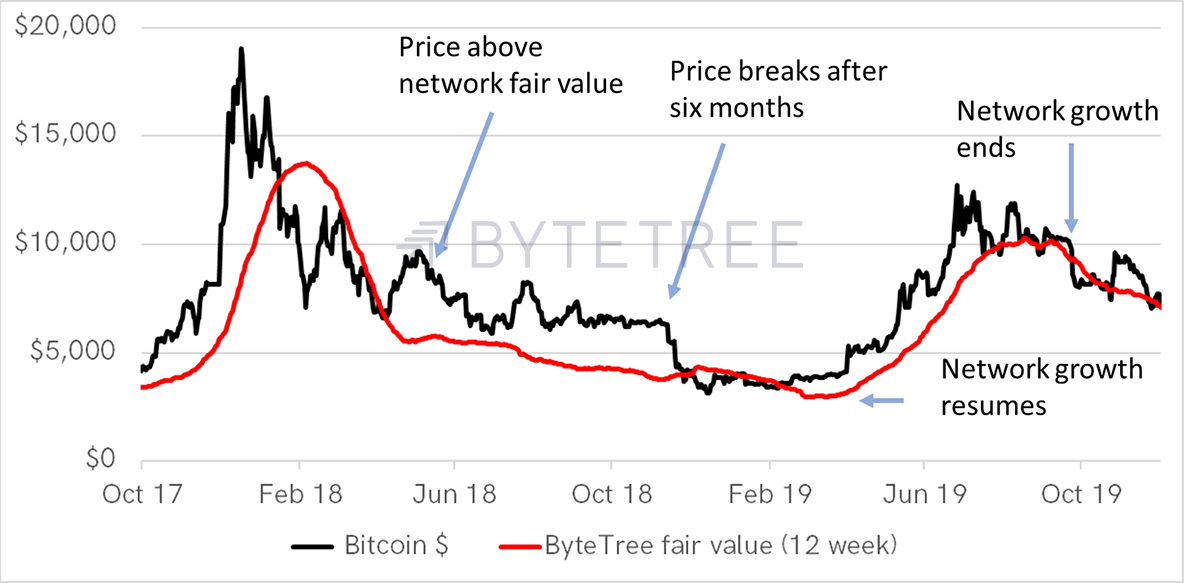
Source: ByteTree. 12-week fair value and price 2017 to 2019.
The key point is that sometimes the Fair Value resembles a price moving average, but not always. It can be a powerful leading indicator, although it tends to be at its worst during hype cycles where much of the volume growth is driven by speculative tourists, who never seem to hang around for long.
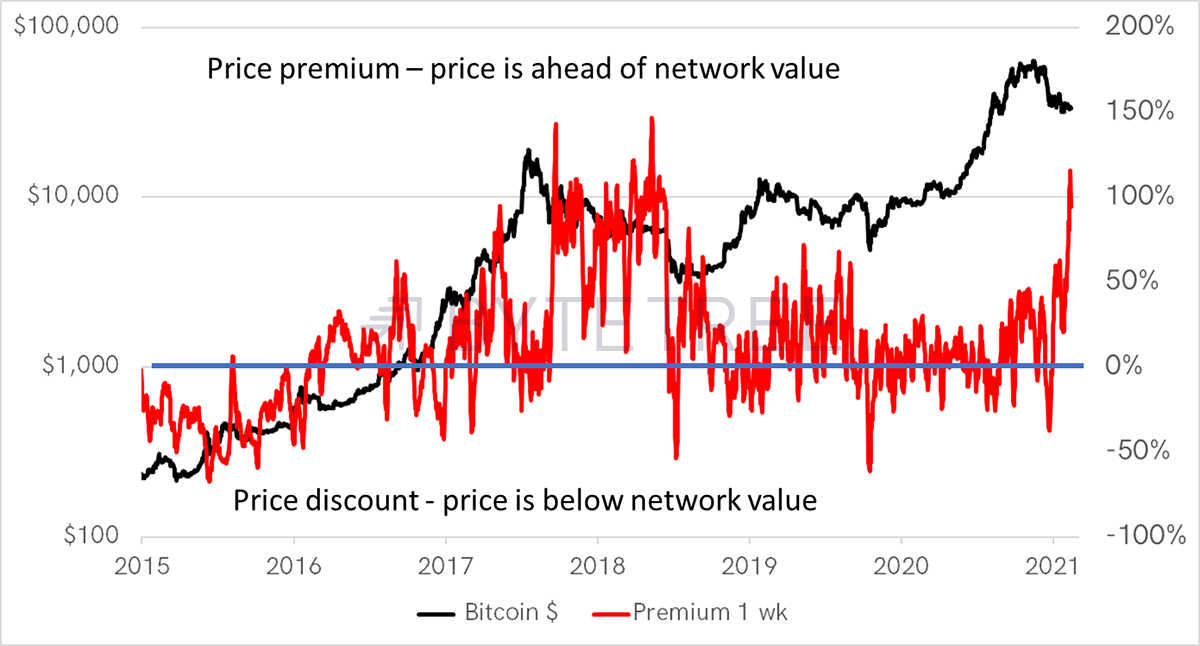
The one-week measure is the timeliest but the noisiest. Here I show how price deviates from Fair Value using a premium/discount. Currently, the price is roughly 100% above Fair Value. We have not seen these levels since the 2018 bear market.
Price and fair value in 2018
Source: ByteTree. 12-week fair value and price 2017 to 2019.
Network activity has collapsed, mainly due to falling velocity. Fewer coins are changing hands, while price remains firm in comparison. This is a similar exercise to the NVT, except I express the result on an annualised basis. Hence 200% velocity means the average Bitcoin moves twice per year (600% means six times).
Network velocity is uncomfortably low
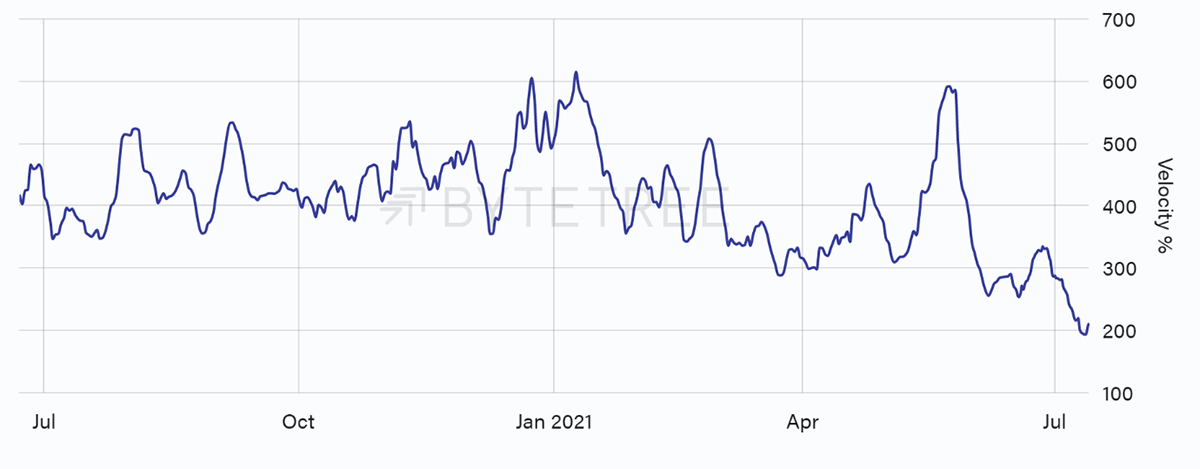
Source: ByteTree. Bitcoin Network velocity over the past 52 weeks.
Some Bitcoins never move because they are HODLed or lost. In any event, it is an extremely low reading. What we are seeing has only previously been witnessed during bear markets.
Many Bitcoiners see the case for a high price as a giant squeeze. In other words, if everyone buys it, the limited supply means the price will go to the moon. But as we saw in the late 1970s with silver, and lumber prices more recently, these squeezes never last. Sure, you can get Bitcoin to a million dollars this way, but it won’t hold for long.
The only way to create lasting value is to build a vibrant network, and that’s what I’m betting on.
ByteTree ATOMIC
Technical
The price has fallen into a tight range, with a 20-day high at $36.6k and a low at $30.1k. With falling blue and red lines, the trend remains negative. The 200-day moving average is also flattening, and if price stays below it, it will turn negative in mid to late August.
Bitcoin trend
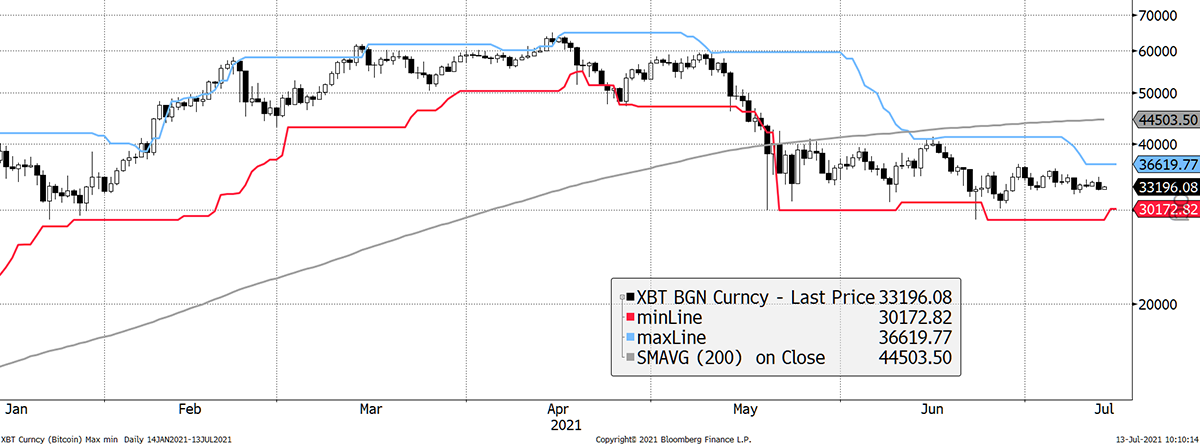
Source: Bloomberg. Bitcoin with 20-day max and min lines and a 200-day moving average 2021 year to date.
The tight range has seen volatility fall over the past 30 days from 106% in May to 63% today. It might not feel that way, but this measures price moves over the past month, which knocks out May’s sharp decline.
Bitcoin 30-day volatility
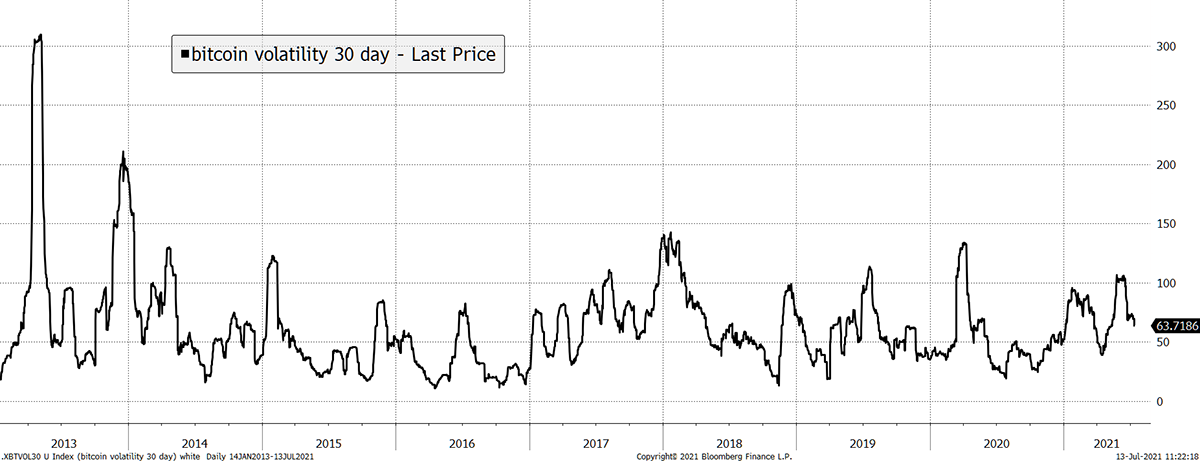
Source: Bloomberg. Bitcoin 30-day price volatility since 2013.
Notice how 2014 and 2018 saw declining volatility after the price peaks. This cycle has much in common with them.
On-chain
I’ve said much about the network so far, but I would add that the miners’ inventories are rising. That normally implies they are holding back their sales to support price. If they sold their bitcoins, then the price would struggle.
Inventories rising
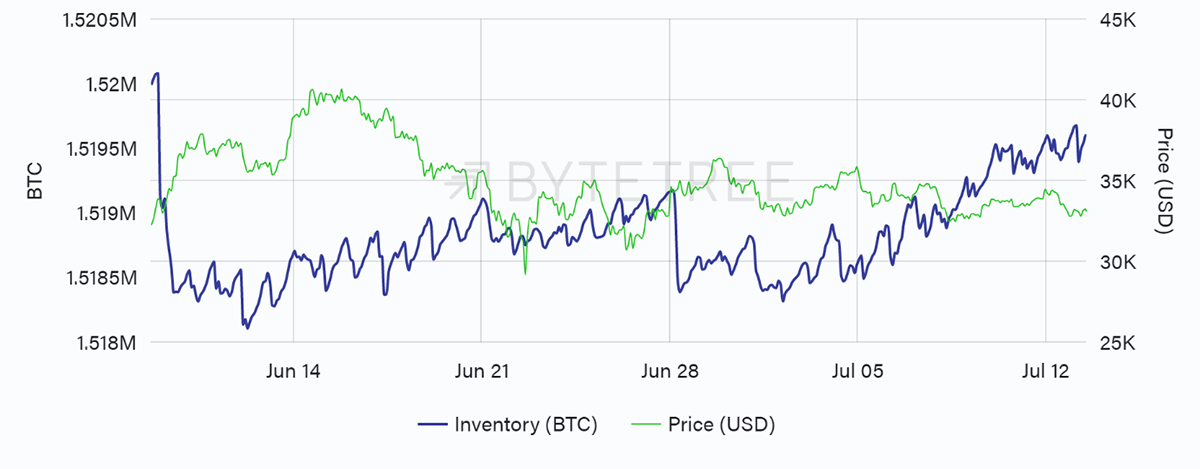
Source: ByteTree. Miner inventories vs the price of Bitcoin over the past five weeks.
When the miners resume sales and price holds firm, that will be an indication of market strength.
Macro
One supportive factor comes from Bitcoin’s allies in the stockmarket - social media stocks. These started to slide in February but have turned mildly positive. A new high would be more telling, but I suspect Bitcoin demand will be supported by strength in tech. Most likely, a major correction in Bitcoin would coincide with weakness in the tech sector.
Social media stocks
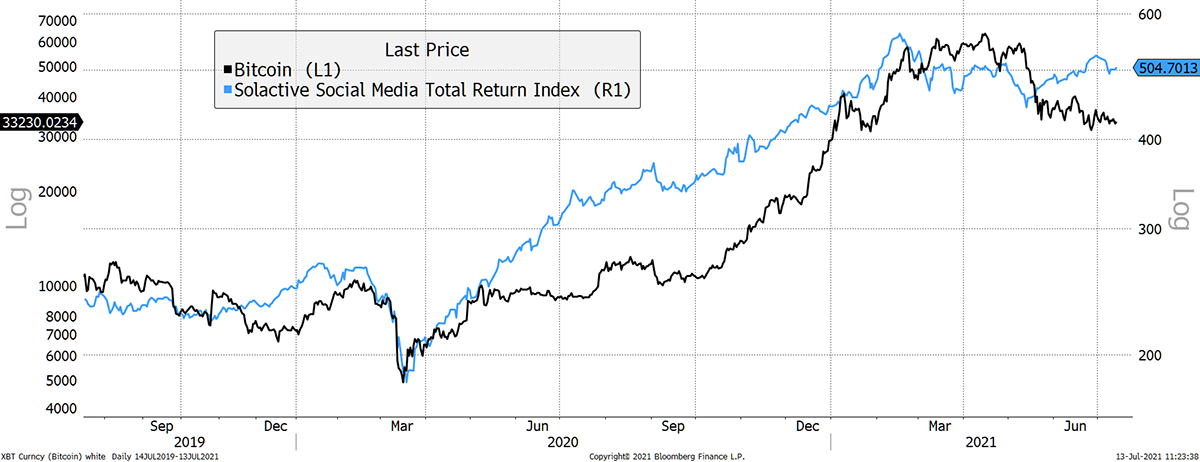
Source: Bloomberg. Bitcoin and Solactive Social Media Stock Index past two years.
In other macro matters, the Dollar Index remains buoyant, and therefore mild but so far not explosive. Oil is also holding its ground, and inflation expectations are not collapsing. This is key as Bitcoin is pitched as a hard asset, which does well in an inflationary environment. Inflation will fuel demand, but when does the narrative return?
Inflation expectations stable
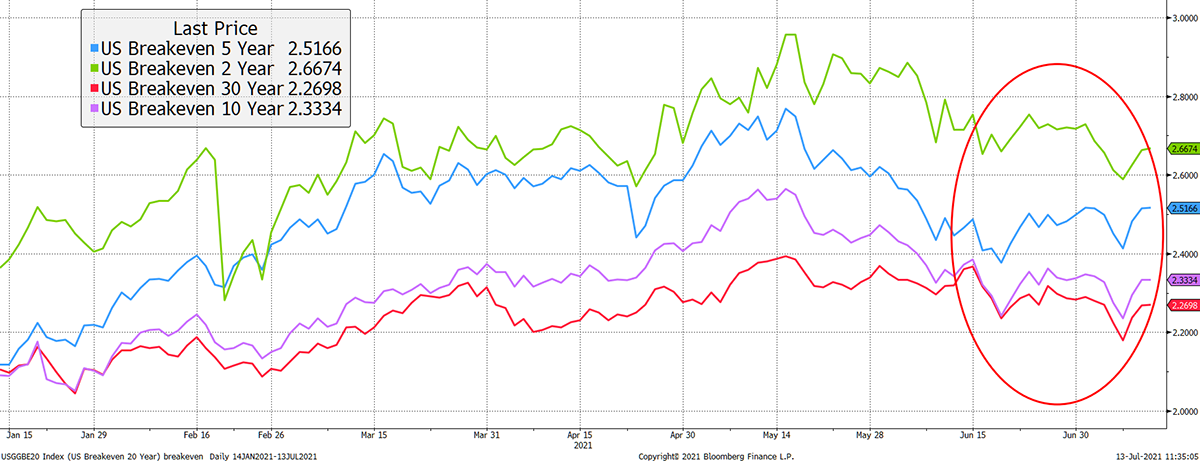
Source: Bloomberg. USA breakeven rates (inflation) expectations past six months.
If it comes next year, there is time for a Bitcoin price shock as the network will not have cause to recover, and price will catch down with Fair Value. But if inflation returns, that may ease the dollar and fuel the Bitcoin Network. Never underestimate the power of changes in macroeconomic conditions.
But yes, that’s hopeful. Currently, macro conditions are slightly against Bitcoin, but not materially so.
Investment Flows
There is no change in the ETF flows since last week. Heavy selling would be bad, and strong or steady buying would be good. We have neither, just stability in the ETF holdings. I would think this makes this factor dormant until something changes.
The Institutional Dominance Ratio (IDR)has picked up in recent days, but it needs to do more to demonstrate increased demand.
IDR picks up from low levels
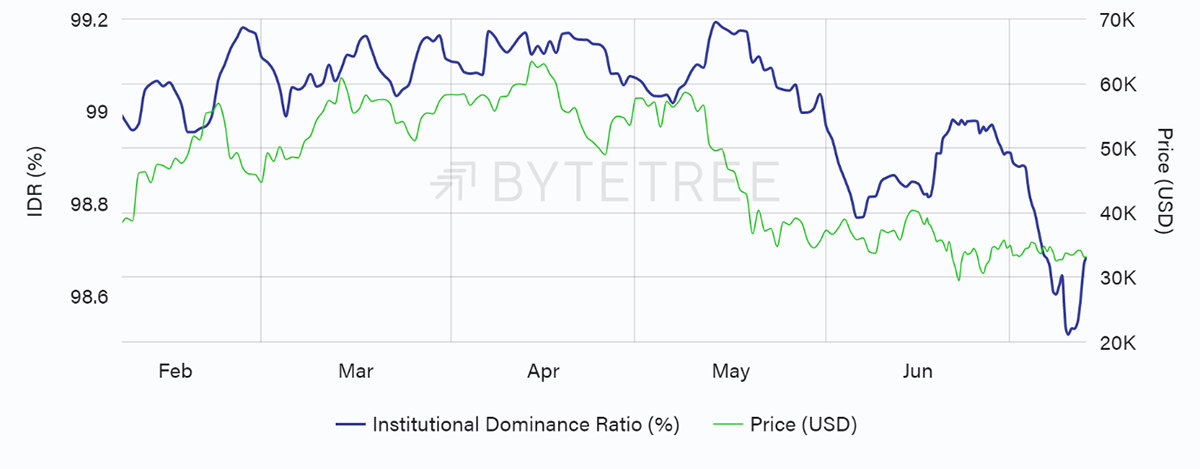
Source: ByteTree. Institutional Dominance Ratio vs the price of Bitcoin over the past 12 weeks.
Crypto
I believe the way to approach crypto is to accept that it is a cyclical asset class and make that work in your favour. You don’t need to try too hard to get everything 100% right; just get the hell out of the way when it all goes wrong.
Shorting crypto, and being right, is much harder than trading the long side and sitting on the sidelines when the risks are high. But that doesn’t mean the short side should be ignored.
Just look how the largest crypto stocks are up between 20% and 50% since Bitcoin made its all-time high in mid-April, while Bitcoin has fallen 48%. That’s one hell of a gap you could drive a truck through. But bear in mind that these are tech stocks, and their collapse would be exacerbated by a tech selloff, which isn’t happening yet.
Crypto stocks remain firm compared to Bitcoin
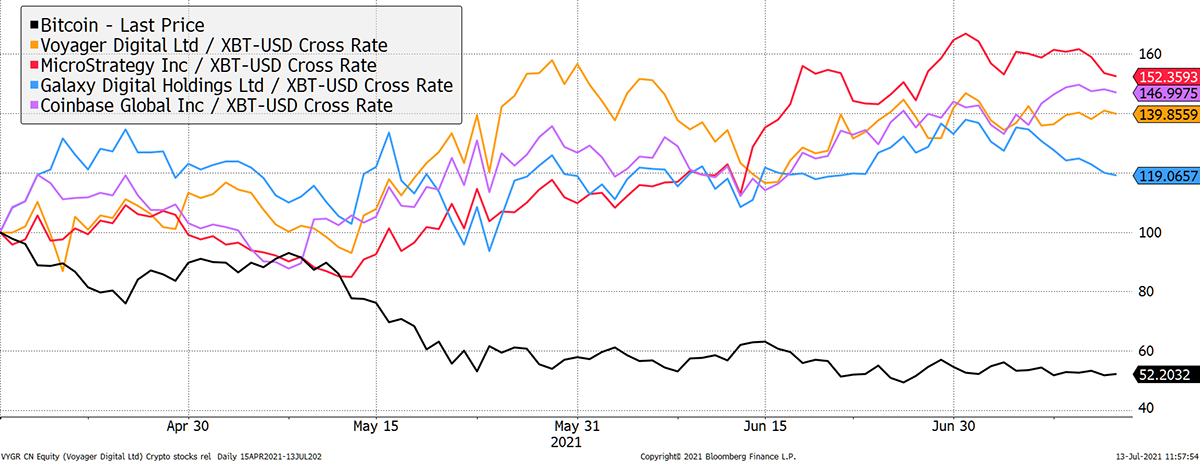
Source: Bloomberg. Crypto stocks and Bitcoin as described since 15 April 2021.
If you haven’t shorted stocks before, the best time to start is never. If you have, and you understand risk management, your jaw will be on the floor. I don’t short things very often, but when I do, I keep positions relatively small as rallies can be very painful.
Disclosure: I am short MicroStrategy (MSTR)
Summary
All in all, risks remain high, but I continue to salivate at the thought of the next buying opportunity.

