
Token Takeaway: COMP;
Since our Token Takeaway series started, we have been focused on covering the highest quality of tokens that pop up through our market screening. A couple of weeks ago, we covered Axie, which has since experienced parabolic growth and rewarded investors with a three-bagger. COMP is this week’s token, and believe me, it's of equal promise. In fact, if we consider the sector it aims to disrupt, perhaps it will outperform AXS.
Last week, I guided readers through a qualitative analysis of the Compound.Finance native token, COMP and its surrounding financial ecosystem. We discussed how it helped drive the decentralised finance (DeFi) sector from $millions in AUM to tens of $billions. I would recommend checking it out here.
Time for a disclosure. I own COMP tokens and am involved in the Compound.Finance money markets. Isn’t every DeFi enthusiast? It was my first yield farming protocol and started as my learning block for DeFi. I would recommend it for anyone looking to gain a deeper understanding of DeFi.
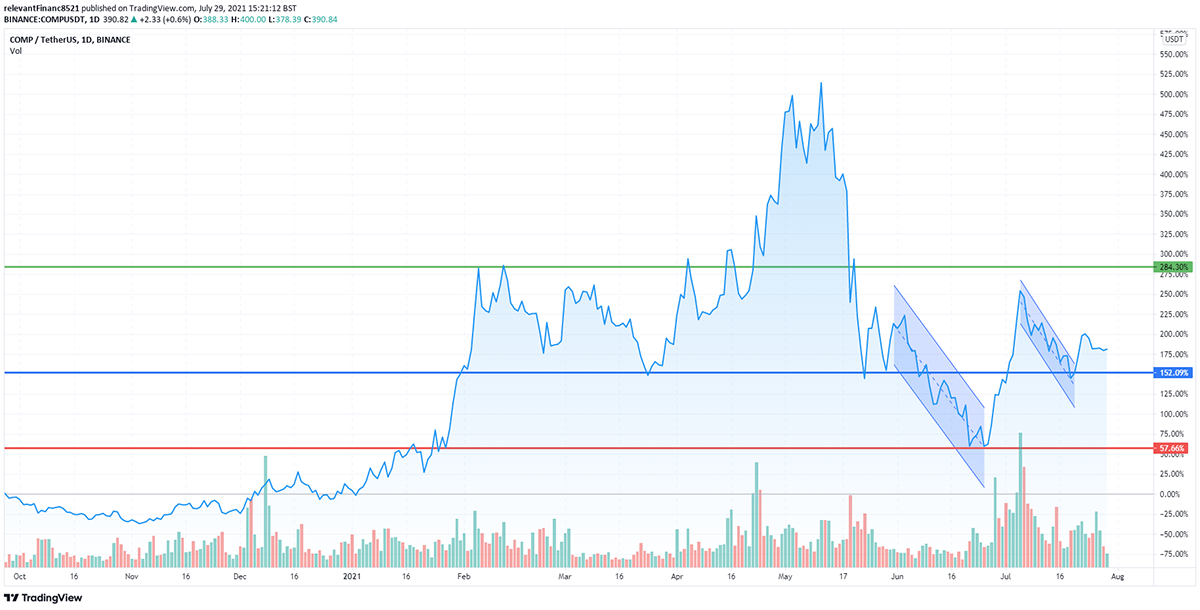
COMP performed well at the beginning of 2021. Although, since its peak in May, we have seen the mid-range support level broken (blue line) and then retraced to this month, indicating a shaky market. However, events like those can create clear trading opportunities. Late June provided investors with an opportunity while a major support line (red line) was tested.
Currently, COMP is hovering over the mid-range line meaning a short-term outlook is hard to predict. A break from this trend could see the top range line tested. Alternatively, a weak market could push COMP down to the red.
Competitor Analysis
In this section, we will look at the lending and borrowing competitors. Readers should bear in mind that this lending and borrowing sector is the most competitive and that it is unlike any Token Takeaway I’ve done in the past. For example, AXS is the clear winner in the NFT space, while here, COMP and AAVE are the more dominant forces and make up 60% of the lending sector’s TVL.
I’ve chosen Maker and Aave as the main comparisons since they, with COMP, collectively hold $27.32b in TVL, while the total TVL for the entire lending sector is $30b (according to DeFiPulse - they certainly are the competitors. Although Token Takeaway is fixed on the leaders in the space, I recognise there are other tokens such as Alpha, Liquity and C.R.E.A.M Finance. Nevertheless, they are not the leaders and tend to experience protocol-level exploits that investors must avoid at all costs.
- Aave Protocol is an open-source and noncustodial protocol where users can earn interest on deposited digital assets and borrow assets with variable or fixed rates. They are also the pioneers of the flash loan, a block-long loan in which a user borrows assets and pays them back within a block.
- Maker is a peer-to-contract lending platform that provides users with loans in their stablecoin DAI if they lock up Ether in an over-collateralised debt position called a CDP. These CDPs are locked in the Maker’s smart contract and help keep the stability of DAI’s peg to $1.
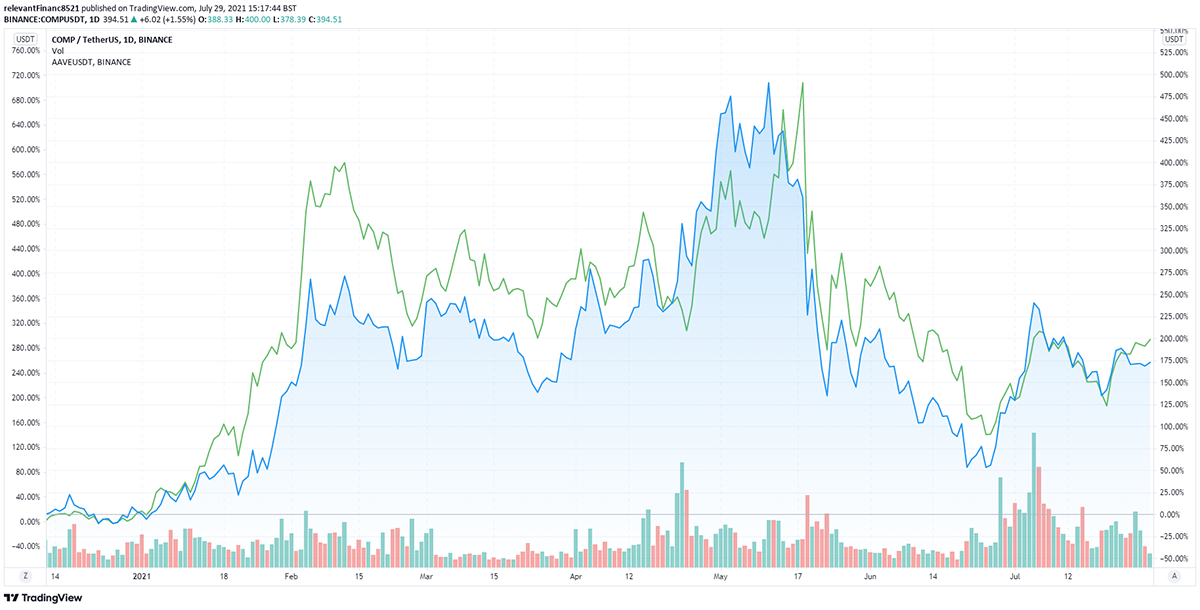
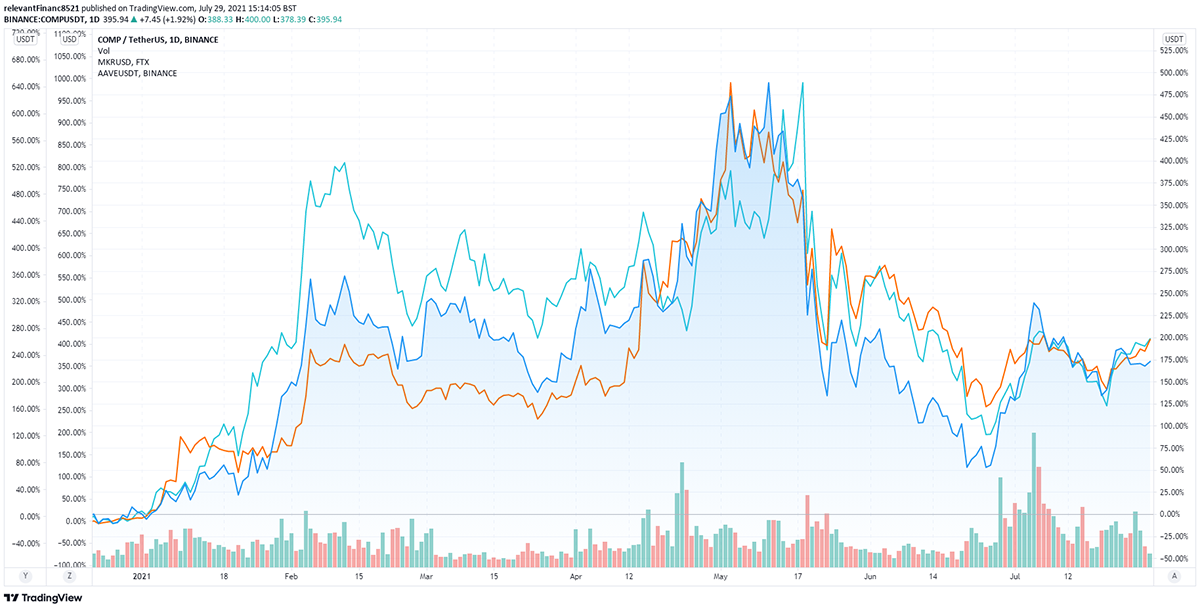
At the start of the new year, Aave seemed to quickly get out of the starting blocks by providing investors with a slight outperformance. Since then, the range has contracted and currently, both sit at an equal playing field. A smart investor might look to acquire a weighted portfolio of both to gain exposure to the leaders in the lending and borrowing sector.
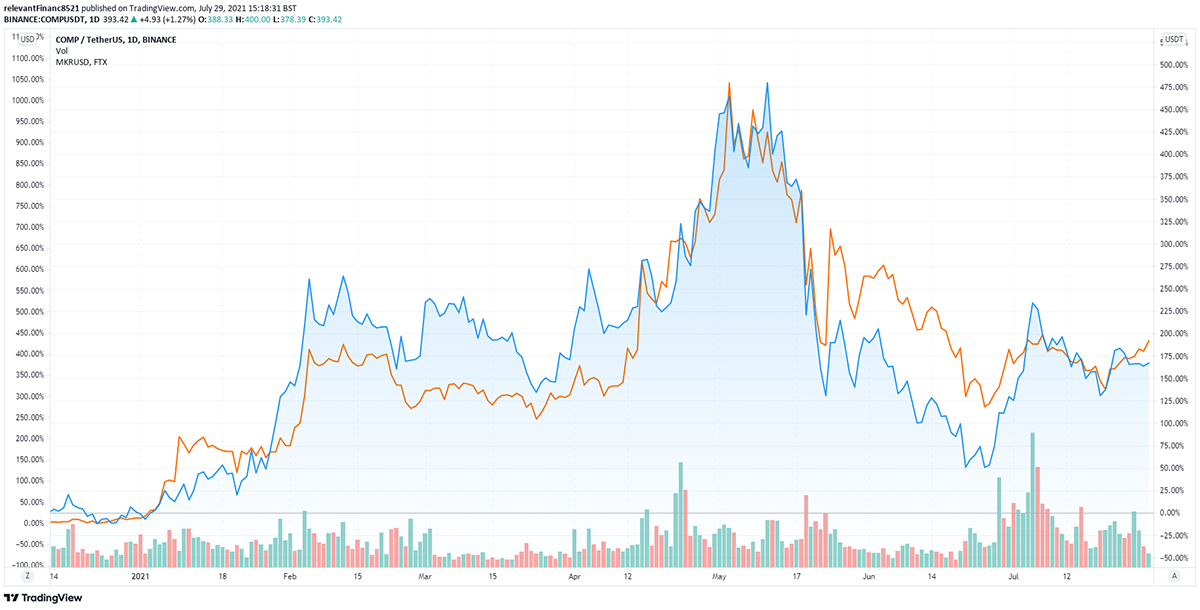
Maker started this year by underperforming both COMP and Aave, but like the latter, it outperformed between June and July. Investors should note that each leader has tightened its range, which could indicate an impending price movement. Which way? Very hard to say.
General Statistics on COMP
| General | Figures |
| Blockchain | Ethereum and Gateway |
| Token Analysis | |
| Total Supply | 10,000,000 COMP |
| Max Supply | 10,000,000 COMP |
| Circulating Supply | 5,400,844 COMP |
| Supply Held by Top 100 Holders | 94.09% |
| Total Holders | 174,612 |
| Transfers | 1,498,512 |
| Money Market Analysis | |
| Total Value Locked (TVL) | $8,300,476,455 |
| Total Compound Deposits (Current) | $13,947,737,360 |
| Total Outstanding Loans (Current) | $6,663,523,130 |
| Number of Outstanding Loans | 401,849 |
| Current Loan to Value (LTV) | 48% |
| Daily Net Borrows (27th July) | $52,849,803 |
| Market Share of Loans | 35% |
| Daily Unique Borrowers (27th July) | 166 |
| Interest Rates + Token Incentive (APY) - Stablecoins vs Borrow Rates (APY) and Token Incentives | |
| USDC | 1.97% + 1.3% Vs. 3.55% - 2.1% |
| USDT | 3.01% + 1.5% Vs. 2.65% - 1.8% |
| DAI | 2.52% + 1.8% Vs. 2.99% - 1.4% |
| Interest Rates + Token Incentive (APY) - Digital Assets Vs. Borrow Rates (APY) and Token Incentives | |
| Wrapped Bitcoin | 0.51% + 0.8% Vs. 0.5% - 0.8% |
| Ethereum | 0.23% + 0.3% Vs. 0.2% - 0.3% |
| COMP | 0.80% + 2.2% Vs. 0.8% - 2.2% |
| Uniswap | 0.36% + 0.5% Vs. 0.2% - 0.6% |
| Compound.Finance Treasury APR | 4% |
Source: Compound.Finance, Etherscan, DeFiPulse. General stats table.
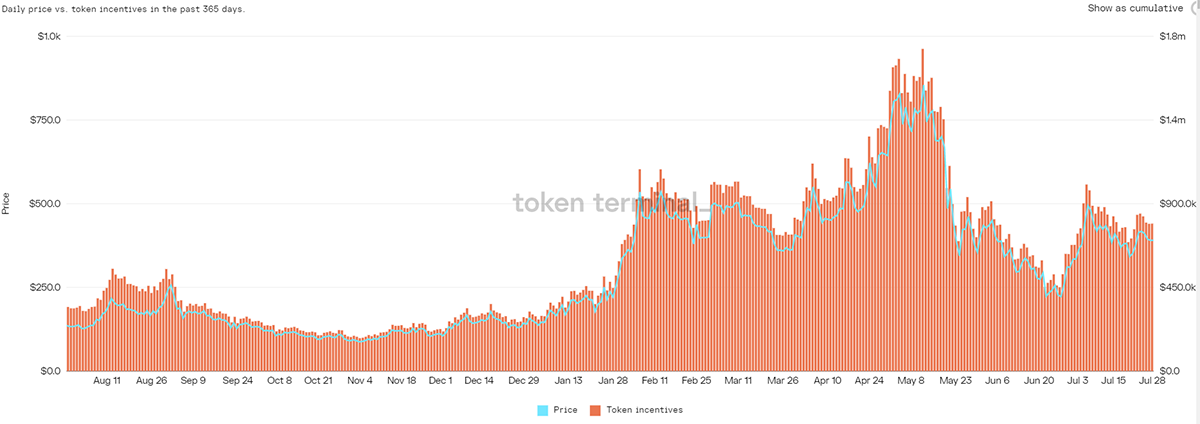
Readers more interested in the value generated by Compound money markets should refer to the “Interest Rates” section in the General Statistics table. Although the chart above seems to show how important incentives are, readers should not be fooled. Since a set amount of COMP rewards are released daily, the relative price and value of COMP distribution are one-on-one. For the less-versed, token incentives are applied to compound money markets and provide lenders with added interest and borrowers with decreased cost. Readers should use the chart above as a metric for how much Compound money market users are rewarded for their participation.
Investors should realise that these incentives are not a permanent feature and should be wary in the future. With many protocols, incentives drive short-term growth, and as soon as they stop, so does the growth of the protocol. This is also the case with competitor protocols offering better incentives; investors should bear in mind that protocol loyalty is hard to create in the DeFi space.
Governance
| Number of Proposals | 54 |
| Number of Successful Proposals | 47 |
| Number of Failed or Cancelled Proposals | 7 |
| Cumulative Voting Weight of Top 5 Addresses | 44.5% |
| Delegated COMP | 2,570,104 COMP |
| Top COMP Delegates | 3,223 |
| Total Voting Addresses | 1704 |
COMP’s is a governance token, so a more utility-based analysis should look at the level of engagement in the protocol’s community. Since COMP tokenholders can delegate their voting rights, it is encouraging to see that 40-45% of the current circulating supply is already delegated. This shows great engagement.
| Token | COMP | Aave | MKR |
| Token Ranking | 50 | 30 | 46 |
| Market Cap | $2,076,968,073 | $3,952,811,420 | $2,510,000,000 |
| 24hr Exchange Volume | $235,840,933 | $299,325,034 | $83,805,758 |
| Total Value Locked | $8,300,476,455 | $11.08bn | $6,957,189,095 |
| Annualised Borrowing Volume | $5,570,000,000 | $7,640,000,000 | $2,270,000,000 |
Competitor Price Stats
| Price | $384.81 | $306.08 | $2790.39 |
| 30d | +52.5% | +35.6% | +25.94 |
| 180d | +54.6% | +7.4% | +99.98% |
| ATH | $910.54 | $661.69 | $6,292.36 |
Competitor Revenue: Aave
| Total Rev. 7d | $4,890,000 | $5,460,000 | $713,830 |
| Total Rev. 30d | $16,380,000 | $22,800,000 | $4,640,000 |
| Annualised Revenue | $192,810,000 | $268,480,000 | $2,270,000,000 |
| P/S Ratio | 20.33x | 18.39x | 51.55x |
| P/E Ratio | 163.76x | 166.06x | 51.56x |
Source: Coingecko, TokenTerminal. Competitor Analysis.
Compound’s TVL is the second largest of any lending and borrowing protocol built on Ethereum. Readers should focus on this and look for continued growth. This is a good indication of a leader, which is all that Token Takeaway wants to identify. A typical sign of a leader is protocol revenue, and while Compound generates vastly less revenue than Axie Infinity, it is on a trajectory to generate $200m by year-end.
Aave currently trumps COMP on several indicators, but this should not worry investors too much. Over the past 180 days, COMP has significantly outperformed Aave as an investment. How come? This is because a table ignores the events that surround these tokens. For example, a clear catalyst for COMP’s outperformance is the release of the Compound Treasury. The Compound Treasury is institutional facing money market which offers 4% on USDC. A more detailed explanation can be found in my previous COMP article.
Exchange Coverage
| Centralised Exchanges | All major exchanges such as Coinbase, Binance, Huobi, FTX, Kraken, Bitstamp |
| Decentralised Exchanges | All major exchanges such as UniSwap, SushiSwap, 1inch and QuickSwap |
COMP Conviction Score
- Crypto market: Nice rebound for a shaky base (BTC at 30k). Investors should be wary of whether short-term value can be generated here.
- Hype vs Reality: Reality
- Trade or Trend: Possible trade since February 2021; support levels are being tested. A clear long-term buy to be had at the end of June since the price is testing original resistance levels.
- Market Outperformance: On a 30-day view, yes. A year view paints a bleaker picture: Bitcoin outperformance +70%, Maker outperformance +200%, and Aave outperformance +700%.
- Competitive Advantage: Highly competitive market, Compound has the first-mover market but will need to fend off Aave and Maker to have continued success. The Compound Treasury could be the catalyst for COMP advantage.
Token Takeaway Score: 3.5/5


