
Week 29 2021
The Network demand model remains OFF this week, with price closing yesterday at $31,824. The price has been broken support at $32k over the last few days, while volatility falls further to the 70% range.
Those that have been following the model for the last month will know that the Network Demand model remains in cash after selling bitcoin when the model moved to a 2/6 on 2nd June at $36,706.
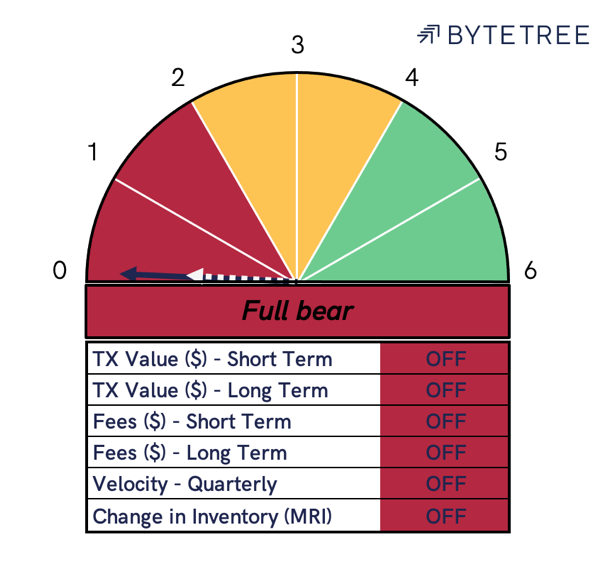
With not a great deal of change in the core metrics this week, there is not much to report. However, I will show you a couple of charts from the model to demonstrate the trend.
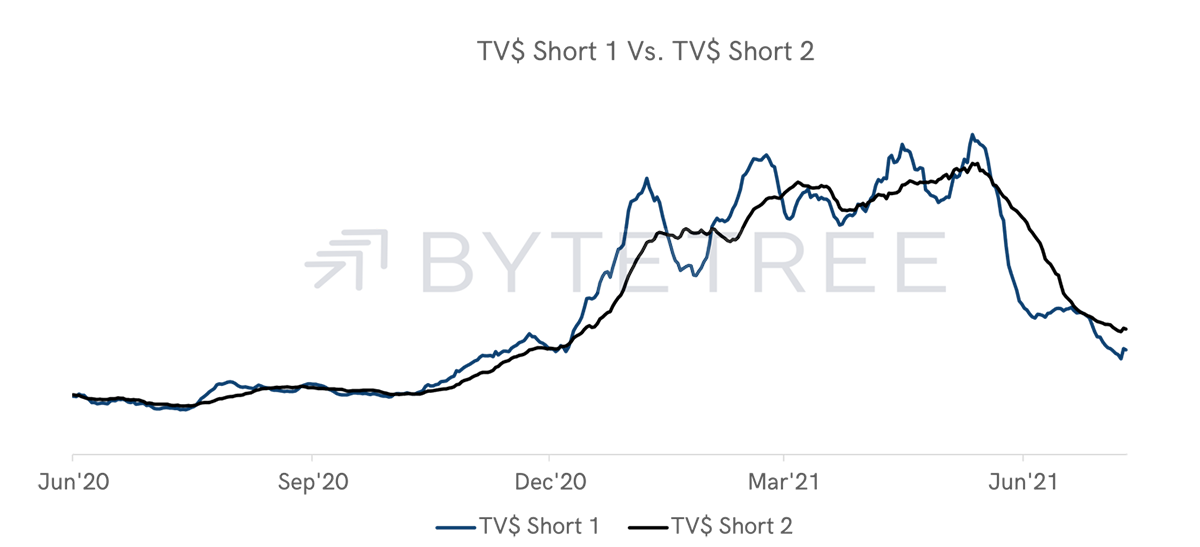
Short term transaction value turned up after a series of high value transactions on Friday evening, summing to around $5Bn. While this was a significant flurry of activity, this does not form part of a longer trend and the indicator remains OFF.
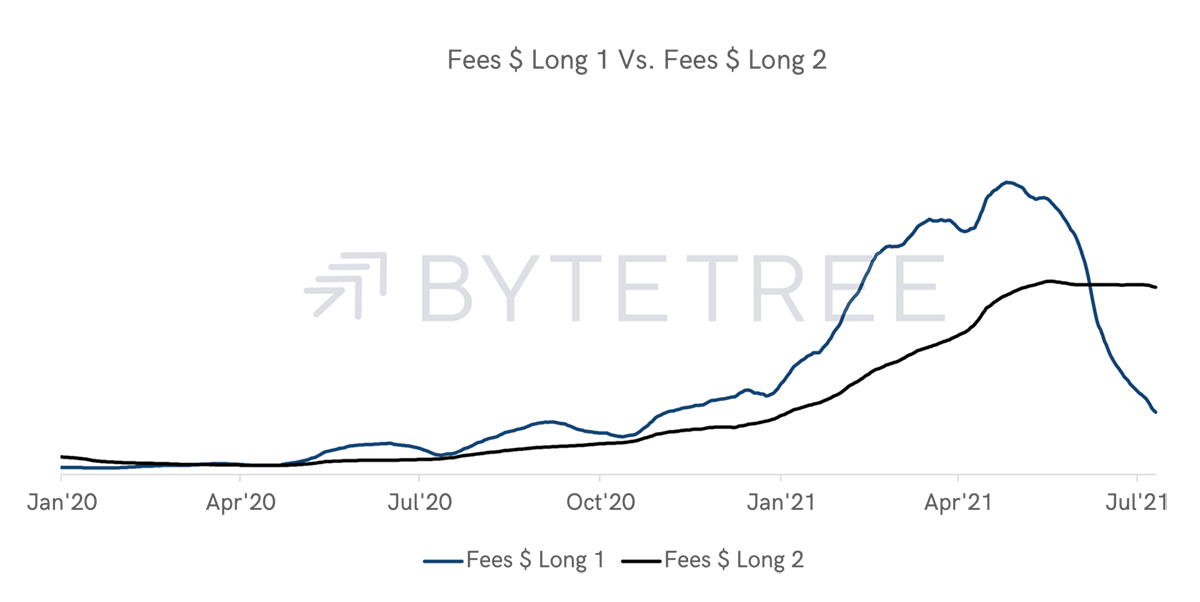
Long-term fees continue to diverge, far from their “ON” position in mid-June.
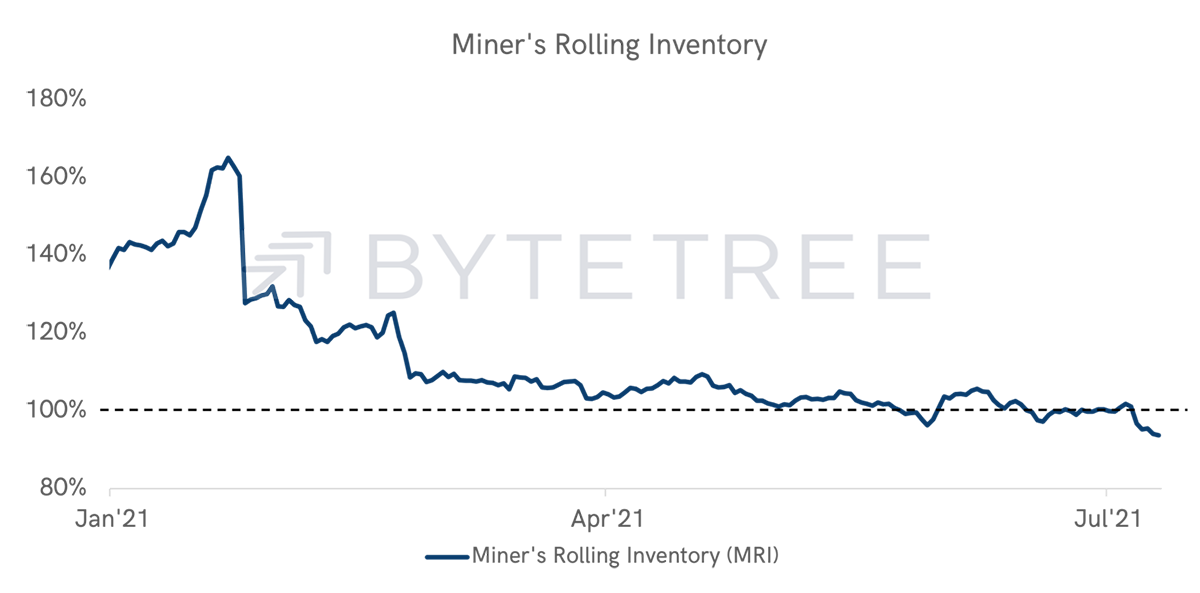
Miners have continued to hold their inventory as the price weakens. MRI is now at its lowest level so far this year and remains OFF.
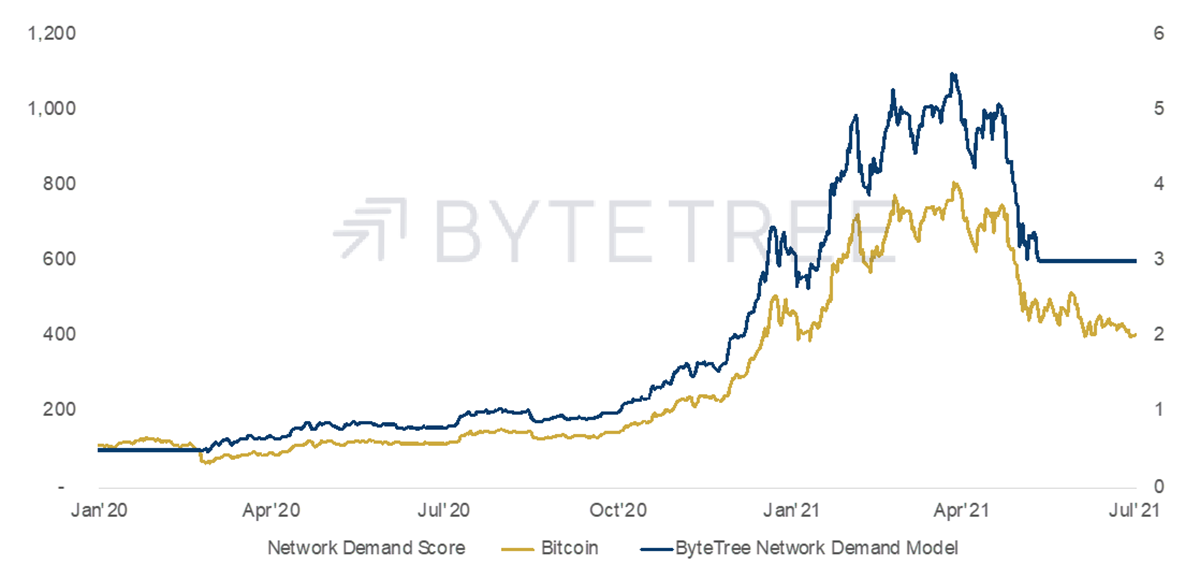
The chart above demonstrates how the network demand model has behaved since the start of Jan’20. The model is long bitcoin when the score is 4 or above and holds a cash position when on 3 or lower. The bars in the background indicate the score, with the bitcoin price in gold and the model’s position in blue. While this is a low turnover strategy, it has generated a CAGR of 327% since inception versus bitcoin’s CAGR of 200%.


