

Analysis of Technical, On-chain, Macro, Investment Flows and Crypto
At ByteTree, we have developed a process for investing in Bitcoin; a journey that dates back to 2013. Our deep understanding of Bitcoin, and the wider crypto space, enables us to participate in this exciting opportunity while significantly reducing risk.
Our aim was simple; to identify timely opportunities while avoiding losses. We do that by using the ATOMIC investment process that combines five investment disciplines to get the best risk-adjusted outcome.
ByteTree ATOMIC covers five different analytical disciplines:
Technical, the study of price data.
On-chain, the study of the blockchain data.
Macro, the impact from external factors.
Investment flows, the power of demand.
Crypto, the space beyond Bitcoin.
These approaches are different, yet anyone one of them can be the most influential force driving the Bitcoin price at a particular moment in time. During booms and bubbles, investment flows and technicals can add the most value, whereas macro and on-chain data would take the lead during the busts. Yet during both booms and busts, Bitcoin’s relationship with the crypto space will change significantly, whether it leads or lags.
Yet, most of the time, Bitcoin is neither in a period of boom nor bust, but in a period of consolidation. The key question is whether the resulting price range will break higher or lower. The disciplines behind ByteTree ATOMIC come together to help you make more informed decisions.
I shall go through the ATOMIC disciplines in turn:
Technical
Technical analysis is popular, especially in crypto, because the internet has made it easily accessible, requiring little knowledge to get started. Price charts, along with numerous technical indicators, have never been so accessible.
Crypto is a highly volatile asset class, which means prices can move in an excitable manner both upwards and downwards. This means there are a high number of false signals that encourages trading at the wrong time.
Short-term charts offer little value. A criticism is that simple technical strategies lead to over-trading, which reduces returns. In contrast, long-term charts are packed with useful information. It is obvious when you think about it because technical analysis is the study of price. Long-term charts are packed with lots of price information in contrast to short-term charts which are not.
At ByteTree, we embrace technical analysis to understand longer-term trends and the important levels which are derived. These sit within a risk framework and help us gauge the likelihood of loss. For example, we understand when a price has moved too high, too soon, that may encourage us to take profits. In contrast, a price fall, if not backed up by evidence from ATOMIC factors, need not be acted upon.
The other application of technical analysis is relative strength. We study the leading crypto universe and look for trends relative to Bitcoin. For example, if a token has been lagging its peers, and starts to show some strength, then that may present an opportunity.
ByteTree data studies hundreds of trading pairs each day, enabling us to identify market-beating trends as they arise. These signals can turn into highly profitable opportunities. ByteTree Premium subscribers will have access to our best ideas.
On-Chain
ByteTree was created to study data generated from blockchains. A blockchain maintains a record of all prior transactions, which is a treasure trove of information. Understanding whether the Bitcoin network is growing or contracting is key when making investment decisions.
ByteTree created the Network Demand Model to address this. By crunching over 100,000 combinations and permutations of different data series using quantitative analysis, we learned a great deal about the economics of blockchains.
Some analysis was simple. It is common sense that a busier blockchain would be more valuable than a quiet one because it has a vibrant network. Other indicators were less obvious. For example, we learnt that, outside of extreme readings, the number of transactions is not particularly useful. Nor are the number of Bitcoin addresses, the trading volumes or the Bitcoin supply.
In fact, many data points I once assumed would be useful turned out to be just noise. And others, which I hadn’t considered, turned out to be very powerful.
A good example is ByteTree’s Miner’s Rolling Inventory MRI. By counting the coins mined versus the coins sold, you gain an understanding of the strength of the market bid. I had always assumed that heavy miner selling would put downward pressure on price. On occasion, it can, but most of the time, it works in reverse.
The miners only sell into a strong market and hold back when it is weak. Therefore, heavy selling from the miners is telling you the market is strong. Being savvy operators, they don’t want the price to fall, and so they know when to stand back.
Fees are also important. Rising fees are normally associated with a growing network, which is bullish for price. Yet, fee spikes can choke off blockchain activity and discourage network activity. In that case, you can have too much of a good thing. Rising fees are bullish, yet fee spikes can mark price peaks.
These spikes can occur due to excessive network demand, such as we saw at the 2017 market peak, or because of a mining outage on the other side of the world. Power cuts can shut down large scale mining operations. This slows down the blockchain and creates transaction bottlenecks. These fee spikes will pass, but the risk to price increases when they occur.
Putting these and other factors together has enabled us to understand the health of the network. ByteTree combines these different on-chain factors to establish the level of market health. The idea is to be invested when the blockchain is healthy and sit out when it isn’t.
The principal objective is to avoid bear markets, which have been brutal. The last major ones occurred in 2014, 2018, 2019 and March 2020. All of these were preceded by weakening on-chain activity. The results of ByteTree’s Network Demand Strategy are shown below.
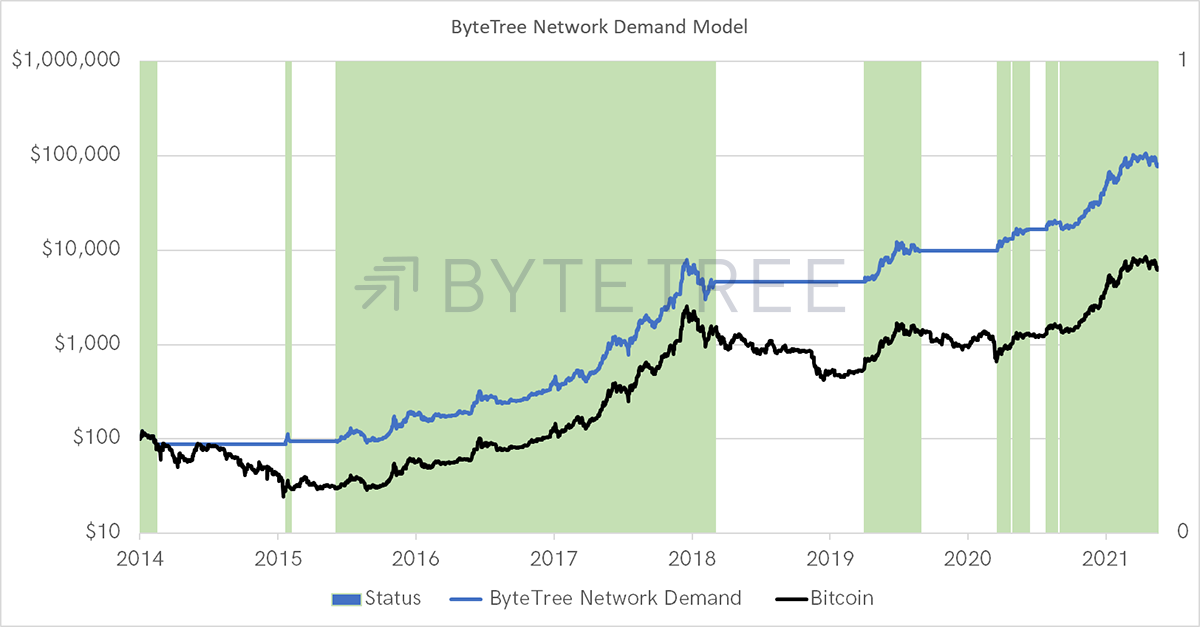
Source: ByteTree. Network Demand Model and Bitcoin rebased to $100 as at 31/12/2013 simulated performance.
In seven years, this model has been invested in Bitcoin 61% of the time, with the remaining 39% sitting in cash. The result has seen significant outperformance above Bitcoin simply because it avoided bear markets and stood ready to reengage with the market once the risk has passed.
I bet lots of unlucky people bought Bitcoin at or near the top of the market (17 December 2017 at $19,000). I know that because bubbles have a nasty habit of sucking in the majority.
But imagine the heartache associated with the cyclicality endured. Over the next three years, their $19,000 went to:
| BTC Price ($) | Date | Change (%) |
|---|---|---|
| $3,156 | by November 2018 | -83% |
| $12,773 | in June 2019 | +305% |
| $4,904 | by March 2020 | -62% |
| $63,419 | by April 2021 | +1193% |
| $37,000 | 7 June 2021 | -42% |
There is no way that ByteTree, nor anyone else, could catch these highs and lows to perfection. But you only need to catch a portion to do much better. Imagine a half-decent strategy that reduced both the falls and the gains such that:
-83% becomes -50%
305% becomes 220%
-62% becomes -40%
1193% becomes 700%
and finally,
-42% becomes -42%
These are not particularly ambitious achievements, and ByteTree aims to do much better. The remarkable outcome of trimming losses, and in this example trimming gains too, sees those unlucky investors who bought at the $19,000 December 2017 peak, ending up looking quite clever. Today they’d have $100,000, which is a very good result. For every $100 invested, they’d now have $526.
The ByteTree Network Demand Model turned that same $100 into $745, with all signals communicated at the time. It’s a reminder that the combination of strong signals with patience can lead to a fabulous outcome, purely by following on-chain data.
Macro
Bitcoin is not an island. In addition to the on-chain data, its performance has been influenced by external macroeconomic factors. In a recent study, ByteTree demonstrated how over 95% of Bitcoin’s price appreciation had coincided with flat or rising inflation expectations and bond yields. That is, Bitcoin does best when the financial markets around it are buoyant.
In March 2020, Bitcoin had fallen 62% in just 29 days. The network had indeed been slowing, but the bigger problem was external. The Covid-19crisis brought markets to their knees, and Bitcoin fell alongside everything else.
No sooner had the Federal Reserve bailed out the financial system, Bitcoin rebounded. ByteTree models turned positive on 19 March 2020 at a price of $6,254, and Bitcoin didn’t look back. The price was more than ten times higher within a year.
Bitcoin is influenced by many external financial factors beyond bonds and inflation. It has close links to internet stocks, the US dollar, market volatility and even policy decisions.
Understanding these macro factors helps to anticipate whether Bitcoin faces headwinds or tailwinds. Most importantly, we’ll be looking for the storms. Like those witnessed in 1929, 1974 or 2008, future financial market shocks would be detrimental to Bitcoin. Understanding macro is important because it is unlikely to flourish when a storm is underway.
Investment Flows
It took time for Bitcoin to get onto the institutional investor’s radar, but 2020 saw them come in droves. The first publicly available Bitcoin fund was launched in 2013, and others followed. It wasn’t until 2020 that they became an important source of demand.
Every day the miners sell Bitcoins. Due to halvings, this quantity falls every four years, and so new bitcoins always become rarer. Miners are expected to sell over 300,000 BTC per year until 2024. At $10,000 per BTC, that is $3 billion dollars per year, and at $50k, it amounts to $15 billion. These bitcoins have to be bought.
These are vast sums of money and understanding the demand for Bitcoin is key. In late 2020, for the first time in Bitcoin’s history, institutional investors bought more Bitcoin than were being mined. That saw the market squeezed, and the price duly soared.
You can see that below. The excess demand for Bitcoin turned positive in November. The shortage caused the price to rise, and it wasn’t until March that we saw institutional demand ease. When it did, the price fell back.
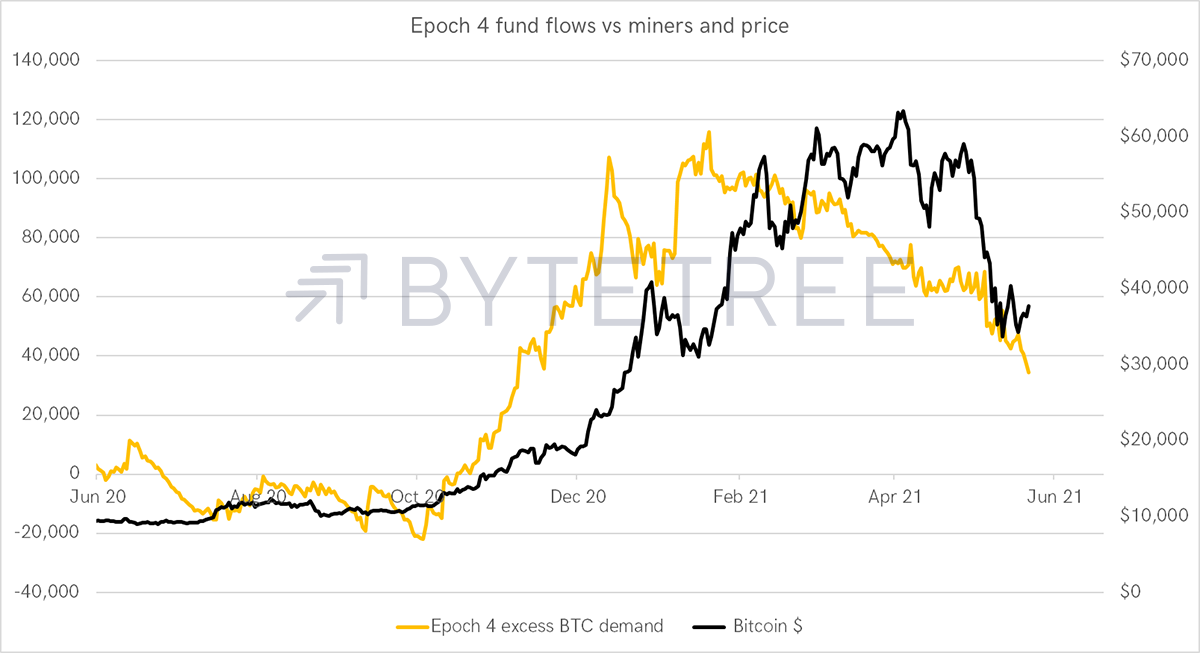
Source: ByteTree. Bitcoin price and the number of BTC held by funds less the quantity held by miners 12/5/2020 to 6/6//2021.
In November, the funds bought back so much that they still maintain larger holdings than what the miners have sold. However, with the miners selling each day, unless fund demand increases, the downward pressure on the price of Bitcoin will remain.
However, there’s a natural adjustment. As the price falls, invertors’ money goes further as they can acquire more BTC for less money invested. That swings the balance of power back to the investors and away from the miners. The market will find a new balance, and things will settle down.
By following flows, and more importantly net flows, ByteTree data will be instrumental in navigating the next bull market. It is the early bird that makes the most money.
Crypto
There are two crypto worlds. One is a speculative madhouse, while the other is building an alternative financial system. They go hand in hand because speculation fuels the process of experimentation and creative destruction, which in turn changes the world.
The best ideas thrive and see fortunes made, while the worst soon fade away. This process is entirely healthy and happens quickly.
Every year there are new protocols, new faces and new fads. Crypto never disappoints as an army of talented coders supports it. To understand this, we are assisted by the data, but crucially, we add a new layer of qualitative work.
There are no shortcuts in understanding what is happening at the frontline. ByteTree analysts are kicking the tires, trying to understand where things are going. That information is communicated to our clients so that they, too, can enjoy a front seat at the crypto table.
Altcoins are typically versions of Bitcoin that aim to improve upon or focus their remit on more niche opportunities. Often differentiated by slight technical tweaks such as higher transaction throughput, these coins facilitate innovation within the digital asset ecosystem.
Since 2015, Ethereum has led the altcoin charge. Its platform hosts many different tokens, some of which are highly valued in the crypto space.
This popularity has created sectors within Ethereum such as decentralised finance (DeFi). This area has become the most disruptive to the traditional world of finance. It has grown from $1bn to over $80bn in its first year alone; this is not just hype. A multi-chain paradigm is inevitable due to the demand that decentralised finance and non-fungible tokens (NFTs) will create in the future.
Whilst the bridge between the digital and traditional is in its early stages, protocols like Tinlake and Centrifuge are attempting to create a promising cocktail that merges the power of the digital economy with the unmet needs of the real-world. This is the future that will catapult the entire digital economy to the forefront of utility and innovation.
In simple terms, many of the digital applications that we use today will be improved by embracing crypto. There are endless possibilities. How can these be valued? What are the benefits, and what are the risks?
At ByteTree, we see our role to stay on top of these waves of innovation and communicate the investment opportunities that arise.
ByteTree ATOMIC
ByteTree Premium subscribers have access to the ATOMIC process. Not only does this cover Bitcoin in detail, but it will keep you informed about the risks and opportunities in crypto markets.
Current on-chain data is weak, and the risk is building that the price of Bitcoin snaps sharply lower. Most think the correction has already happened, but maybe it’s just getting started. That’s where the data points.
After all, the timing is right. Looking at the past two halvings, the price peaked 264 and 444 days later. With the last halving on 18 May 2020, that was 385 days ago. The recent all-time high at $64,000 occurred 333 days after halving. If not now, when?
| Date | Peak Date | Days | |
|---|---|---|---|
| Halving 1 | 28/11/2012 | 29/11/2013 | 264 |
| Halving 2 | 9/7/2016 | 17/12/2017 | 442 |
| Halving 3 | 18/5/2020 | 14/4/2021 | 333 |
As always, markets have a mind of their own and do not always dutifully follow your best analysis. Bitcoin could recover as the network may pick up. But it is currently weak, and it’s hopeful to expect a recovery without at least a prolonged period of calm.
The key is to follow the data as laid down by ATOMIC. The technicals, on-chain, macro, investment flows and other crypto indicators all will give you an edge. Nothing comes as a shock while you stay on top.

