

ATOMIC 4
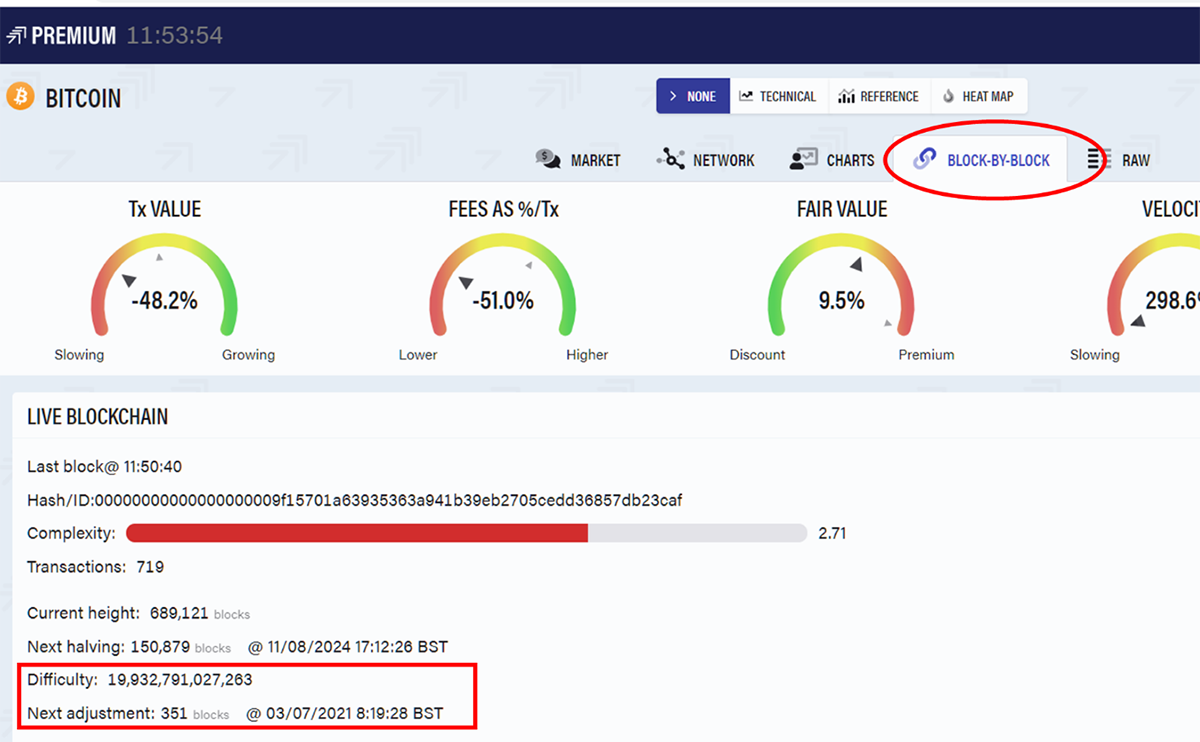
This Saturday, at 08:19 BST (forecast), Bitcoin’s difficulty will adjust downwards by the largest amount since 2009. You can follow it on the ByteTree Terminal in “Block-By-Block” as highlighted.
Highlights
| Technicals | Challenging the short-term downtrend |
| On-Chain | Largest downward difficulty shift forecast for Saturday |
| Macro | Beware the dollar rally |
| Investment Flows | Stabilising |
| Crypto | Crypto stocks banking on a recovery |
Bitcoin’s blockchain is designed to produce new blocks every 600 seconds. If too many miners are in competition, that time falls, and the blockchain speeds up. Every 2016 blocks, there is an automatic adjustment on the chain and the amount of computational power required increases, so it always trends back towards 600 seconds.
While that adjustment is normally upward, if the blockchain slows down because it lacks computational power, then the adjustment is downward.
Average block time
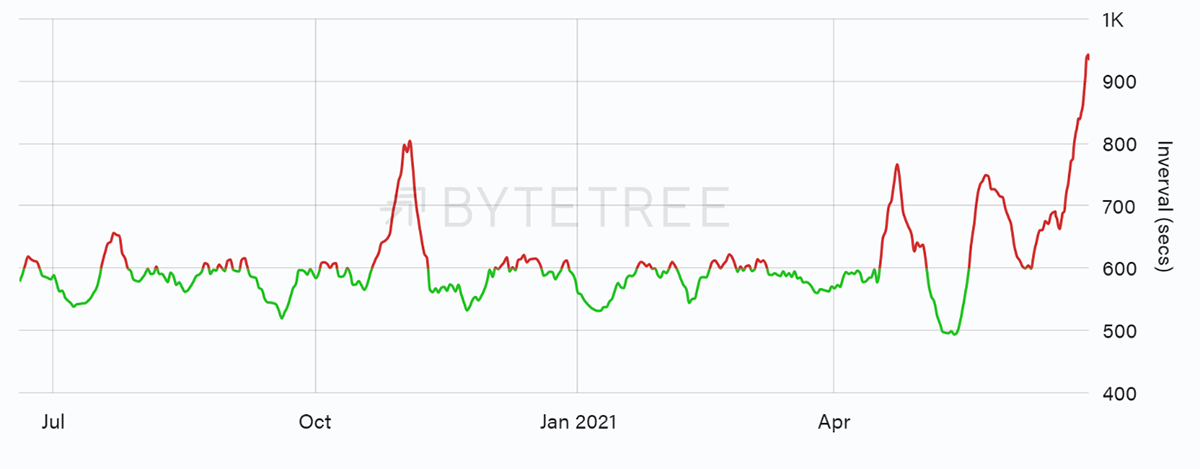
Source: ByteTree. Bitcoin block interval over the past 12 months.
In green, the blockchain has been running too quickly, and in red, too slowly, but it always heads back towards 600 seconds by design. The last week has seen an average block time of 945 seconds – a new record.
Looking at the daily data over the past decade, it saw the highest recorded spike on Sunday. This is unprecedented territory.
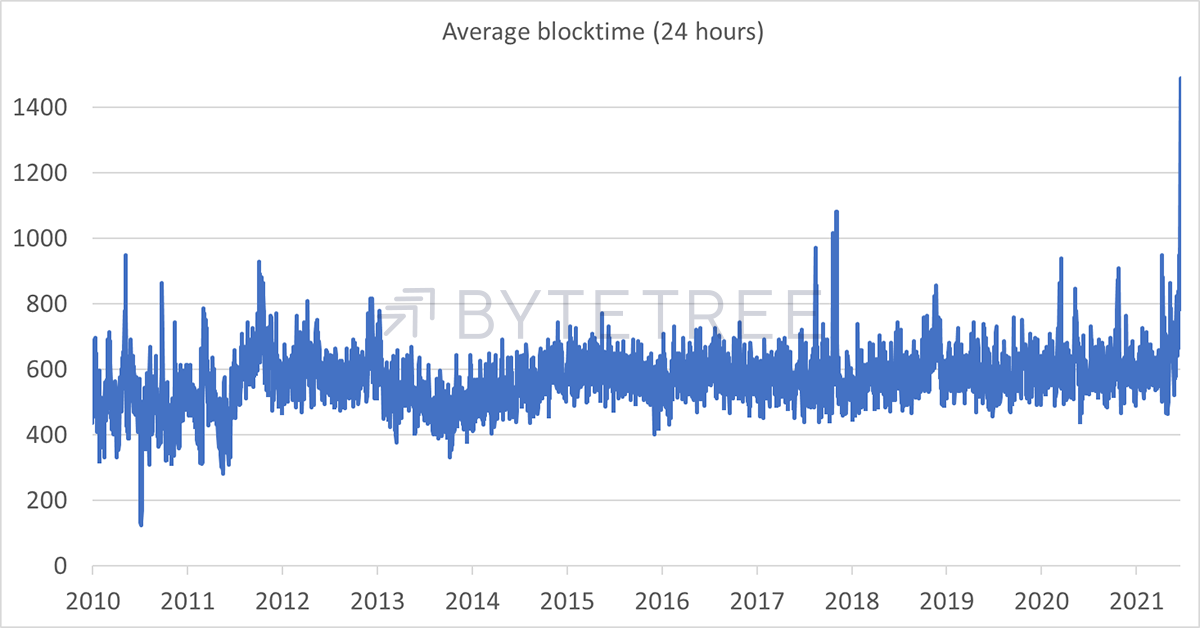
Source: ByteTree. Average daily block interval since 2010.
Bitcoin will need to see the difficulty fall dramatically on Saturday to compensate for the slow blockchain. This has come about as a result of the mining ban in China. It just goes to show how concentrated this hashing power has become.
By observing the average block time between difficulty adjustments, normally every 14 days, we can estimate the next adjustment. This latest adjustment is expected to take 21 days and drop by roughly 50% from the May high - another record.
Normally, the adjustments are slight because only a few miners come and go every fortnight, but removing China’s hashing power has had a significant impact in a short space of time.
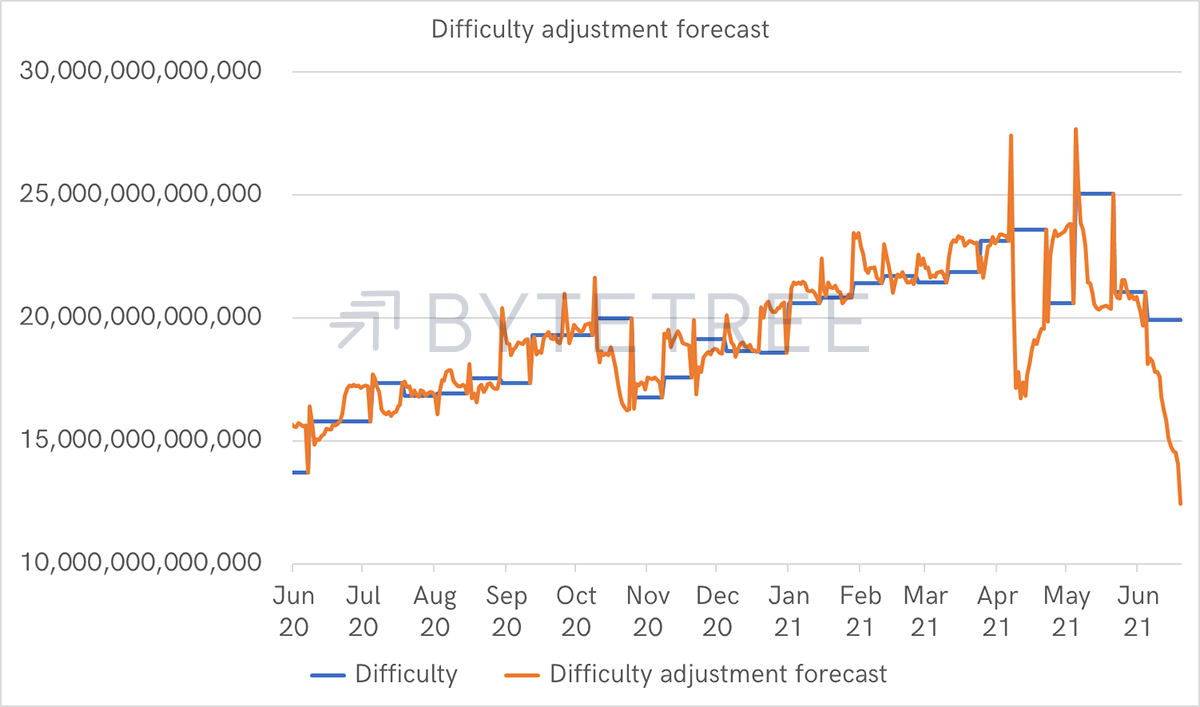
Source: ByteTree. Difficulty adjustment forecast over the past year.
The good news is that this doesn’t matter in the long run. The difficulty will adjust downwards, the chain will speed up again, and within a few months, it will settle back towards 600 seconds per block.
However, when things like this come along, I am keen to understand whether there is a price impact. A fast blockchain coincides with high demand and is therefore healthy. When it slows, regardless that it will eventually normalise, something is up.
In this test, I looked at owning Bitcoin only if a downward difficulty adjustment of 8% or more was avoided. It’s a simple idea that keeps you invested over 95% of the time.
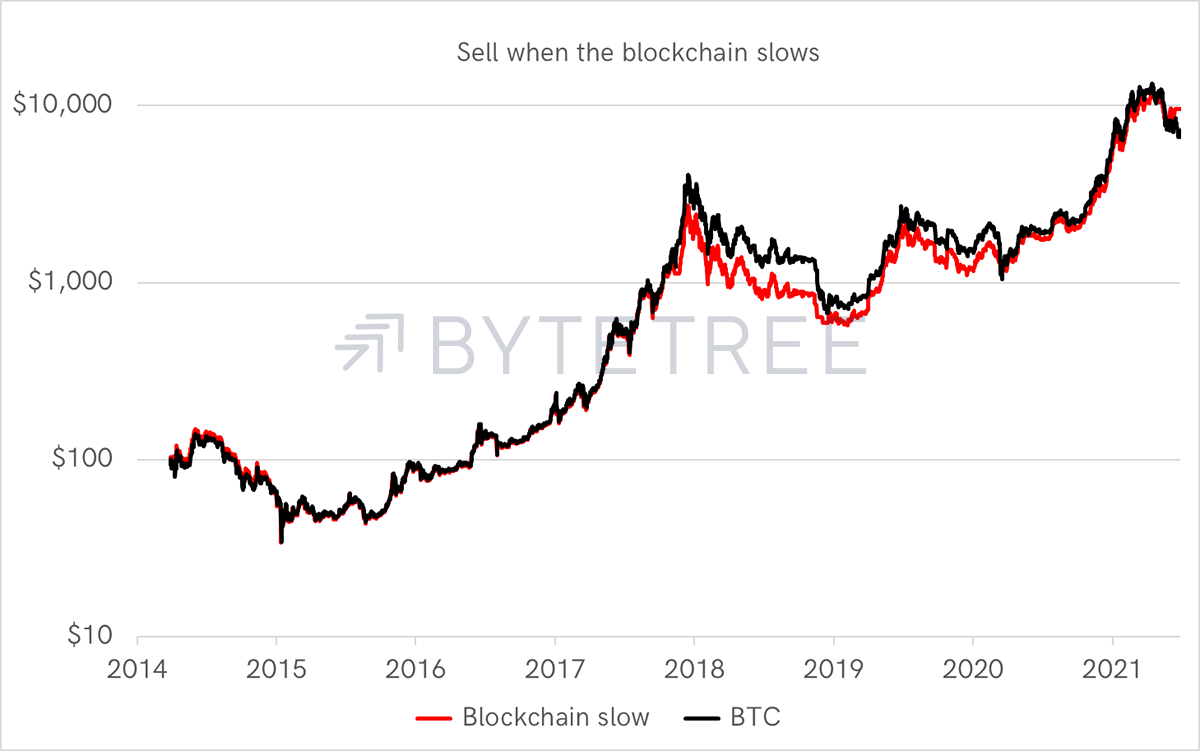
Source: ByteTree. Long BTC unless a downward difficulty adjustment of 8% is forecast, since 2014.
There were three notable events when the model suggested selling:
- November 2017 - lose
- March 2020 - win
- Recent activity – win
It seems funny in hindsight, but late 2017, at the height of the last frenzy, saw a slowdown in hashing power. Hordes of miners ditched Bitcoin and went off to mine Bitcoin Cash (BCH) after the hard fork. I mean BCH!
They expected great riches. Unfortunately for them, $100 invested in BTC is today worth $472, whereas in BCH, it is $73 (since August 2018).
In addition, November 2017 saw Bitcoin rise by 27%, so this strategy failed miserably at that time.
But on the other two occasions that saw a significant downward difficulty adjustment, it has been successful. March 2020 saw the Covid-19 shock, which was worth avoiding, and in recent weeks, the price has been weak.
Zooming in since July 2019
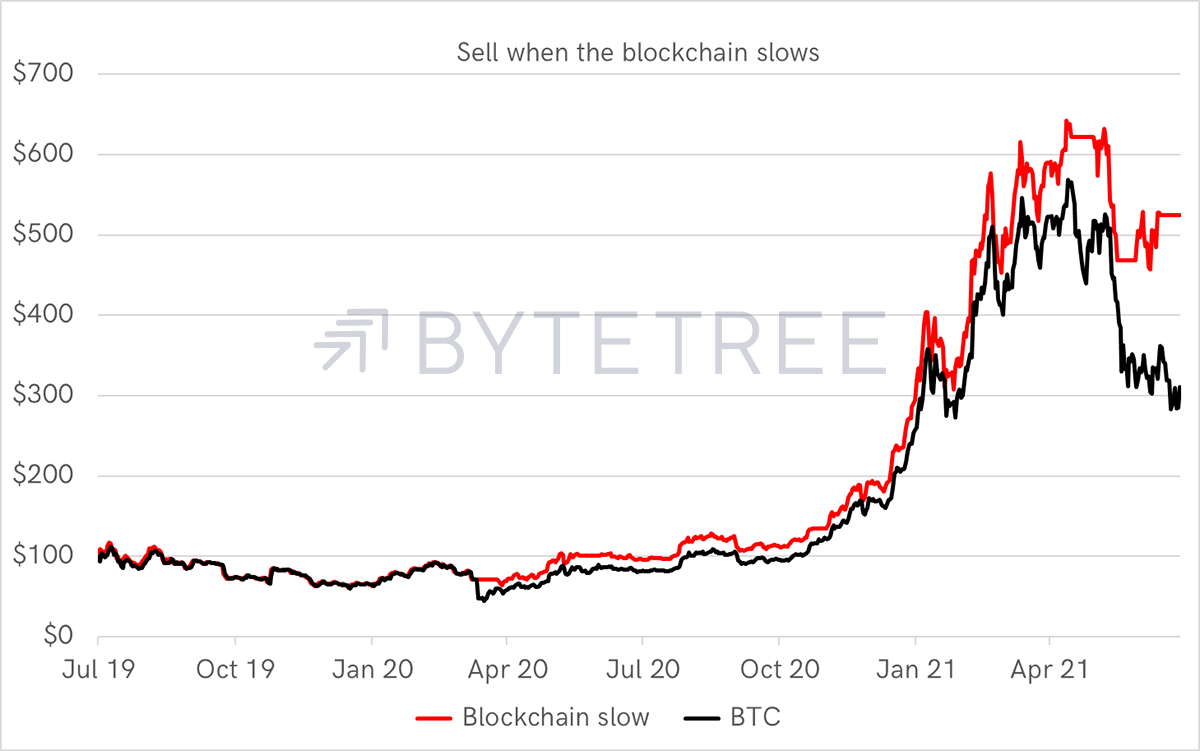
Source: ByteTree. Long BTC unless a downward difficulty adjustment of 8% is forecast, since mid-2019.
With one failure, and two successes, it’s hardly a robust strategy, but definitely something to be aware of. As a rule of thumb, if the average block time over a rolling week exceeds 650 seconds, it is worth an appraisal.
I would think a slow chain signal, combined with weakness in other areas, should encourage de-risking; otherwise, ignore.
This time ignore because it’ll all be back to normal on Saturday – or at least close. Thereafter, we ought to see transaction fees fall, as there will be more blockchain capacity. With luck, that will lead to transactions picking up.
In the bigger picture, those mining rigs are heading to places where they are welcome: El Salvador, the USA or Norway. I imagine the majority of them will seek cheap, renewable energy. A halving of difficulty is more or less a halving of energy consumption. When they come back online, Bitcoin will be greener than ever before, and mining will be more transparent too.
ByteTree ATOMIC
Technical
The 20-day high is still above $41k, with the low just below $29k. I expect that range to narrow. I have added a trendline with three touches, which is being challenged today. It ought to break through soon as the trend is -97% per annum which, as you can imagine, gets expensive if it holds for long. If so, another attempt at $40k is inevitable.
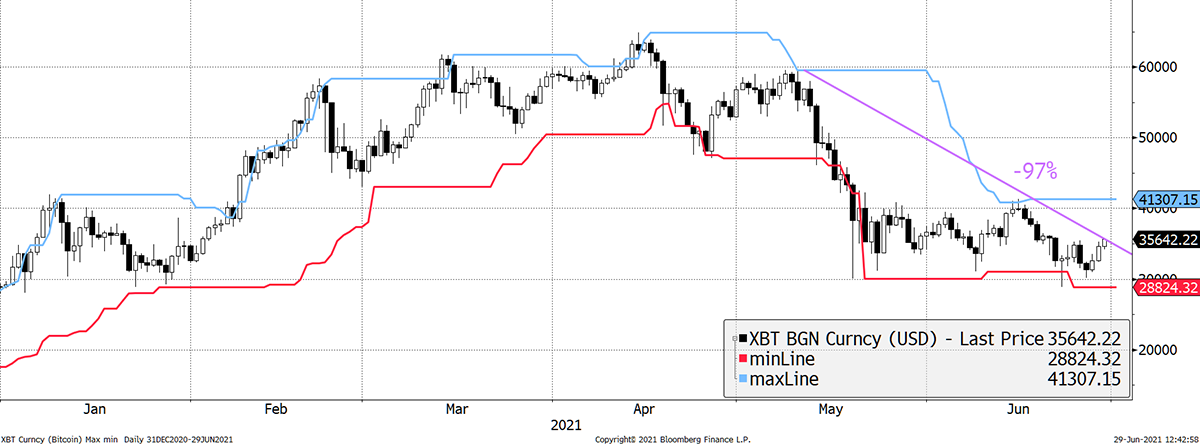
Source: Bloomberg. Bitcoin with max-min in the past six months.
The technical case against is the medium-term downtrend. Lower highs and lows need to reverse. A break of the blue 20-day max should lead to a short squeeze.
On-chain
The big story on the chain this week is the difficulty adjustment I covered in the main piece, but I’ll touch on three charts of interest.
Firstly, the ByteTree Fair Value indicator sits at $20k and has turned down slightly.
Fair value at $20k
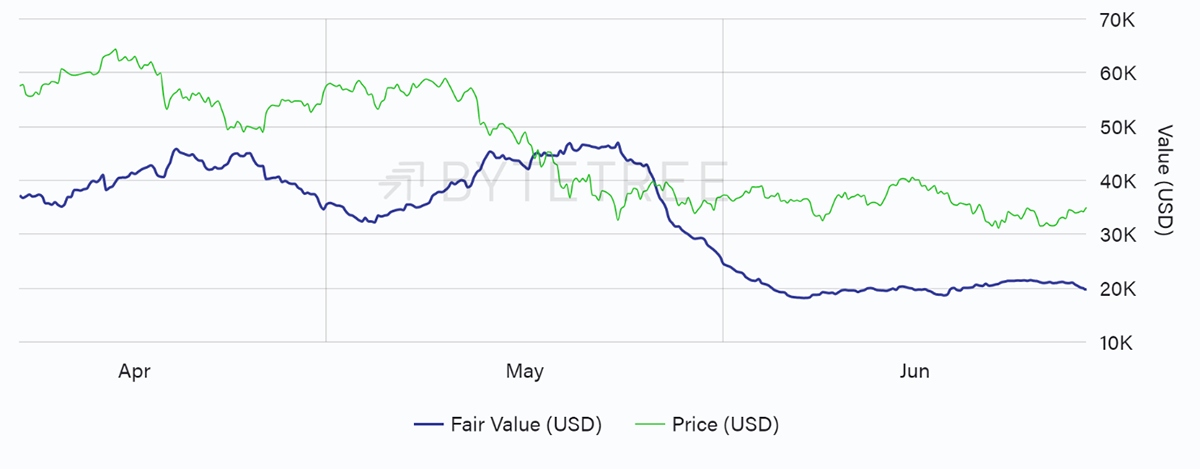
Source: ByteTree. ByteTree Fair Value vs the price of Bitcoin (USD) over the past 12 weeks.
That puts the premium at 75% above Fair Value. It’s not that price can’t move higher, but the likelihood of a materially profitable move in the short-term is greatly reduced. Of course, if the blue line turns up, driven by more transactional activity, then great.
75% premium to fair value
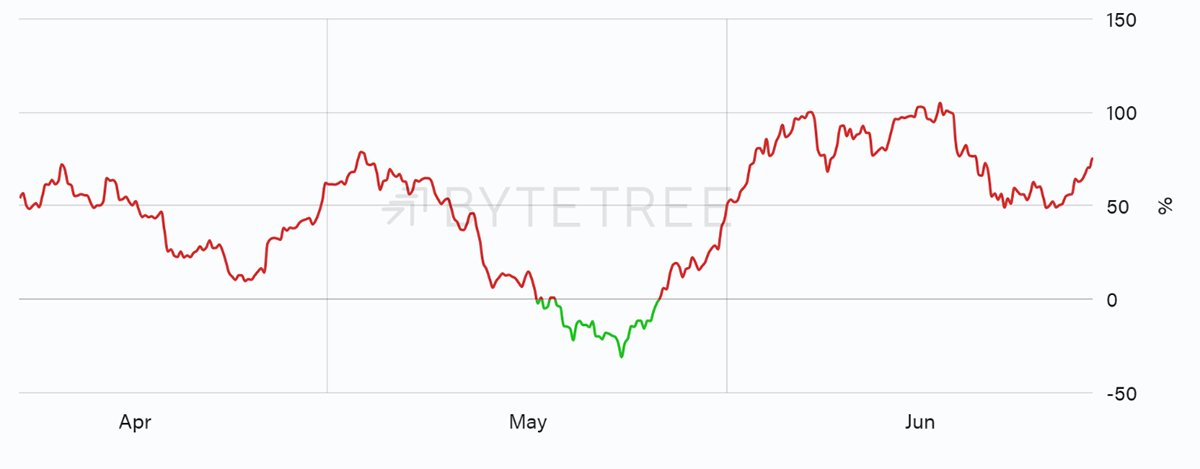
Source: ByteTree. Bitcoin at a premium (red) or discount (green) over the past 12 weeks.
Finally, the IDR has turned down, having retested 99%. It is becoming clearer that the institutional (large) network activity is below the levels seen when the price was stronger earlier this year. This also needs to pick up.
IDR fails to break 99%
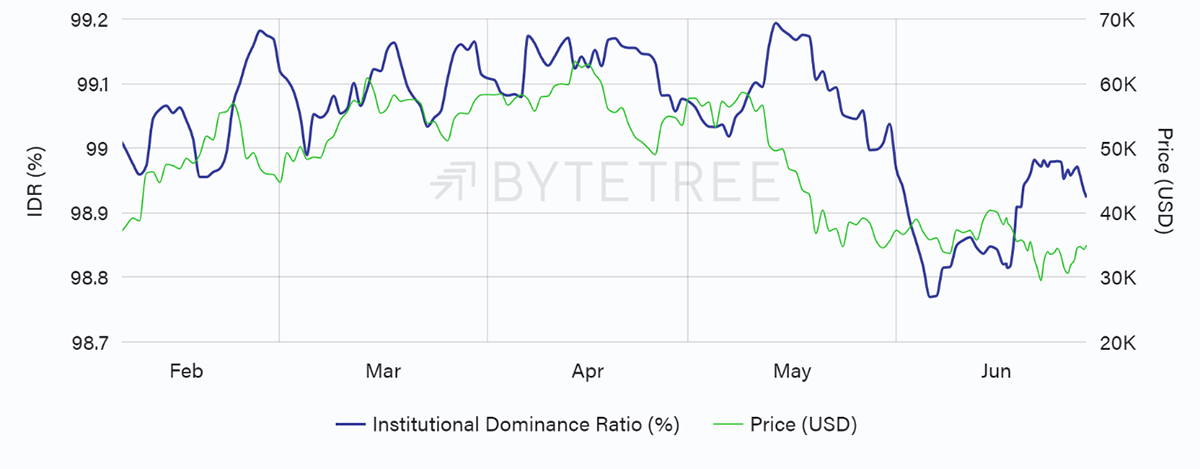
Source: ByteTree. Institutional Dominance Ratio (IDR) vs the price of Bitcoin, since February 2021.
If you want to learn more about IDR, I wrote this last week.
Macro
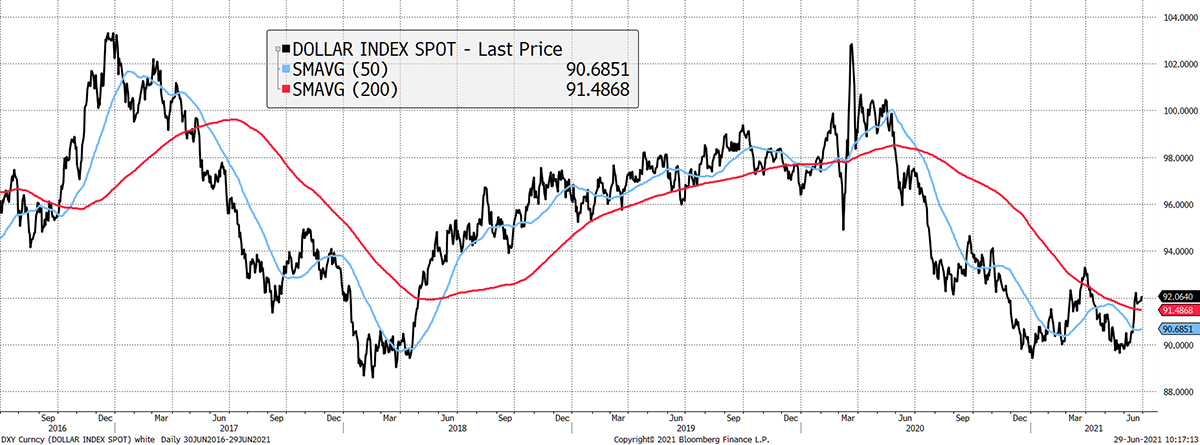
The dollar rally is still with us. Generally speaking, this puts pressure on the global economy, and investing is generally more profitable when it is going down.
Dollar rally
Source: Bloomberg. Bitcoin with max-min in the past six months.
And here’s why. It’s early days but using the example of GBP-USD, you can see how closely it has followed the difference in real interest rates between the two countries. Like all financial charts, it’s at times sketchy, but the point is made.
This year, the spread has started to favour the dollar, as the red line has started to fall. The US dollar offers a marginally higher real rate (rate less expected inflation in 10 years’ time) than the pound compared to 2020. What’s happening to GBP is similar to other currencies. Money is headed back to the USA, which tends to make global asset prices less buoyant.
GBP eases as the rate gap favours the dollar
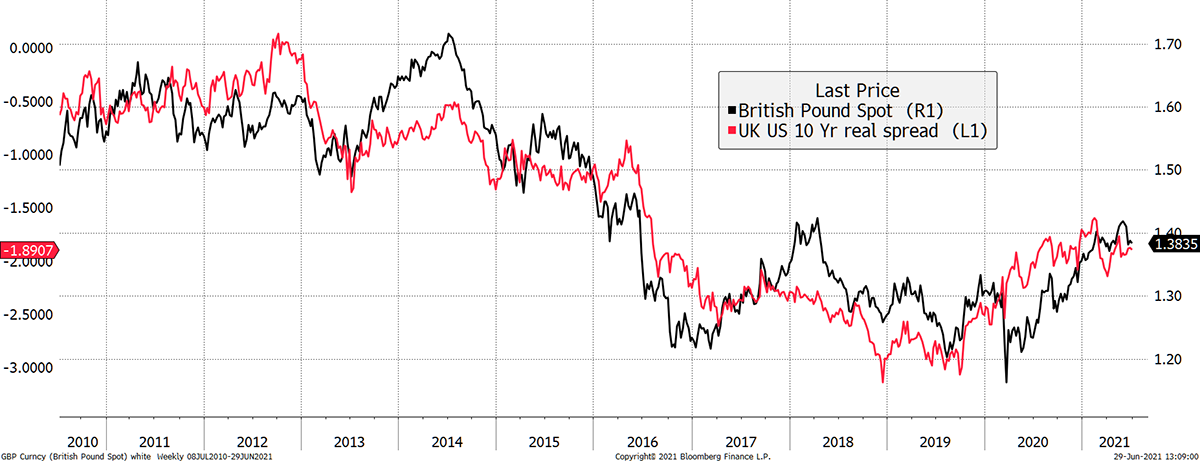
Source: Bloomberg. GBP-USD and 10-year real interest rate difference since 2010.
It’s early days, but something to watch.
Investment flows
The fund holdings seem to be relatively stable, which is good to see. But I would think a surge in price needs to be backed up by inflows. I’ll take stability, and the key point is that we are not seeing mass outflows.
Bitcoin fund flows are stable
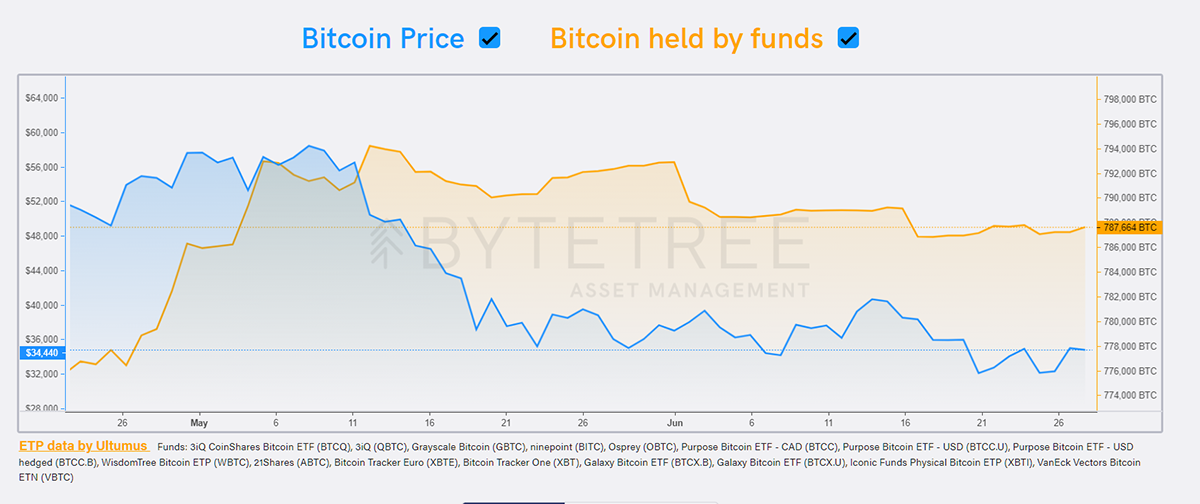
Source: ByteTree Asset Management. Bitcoin held by funds (yellow) vs the price of Bitcoin (blue), since the end of April.
Crypto
The crypto stocks are all ahead of Bitcoin this year. That implies equity investors are bullish.
Crypto stocks hold the faith
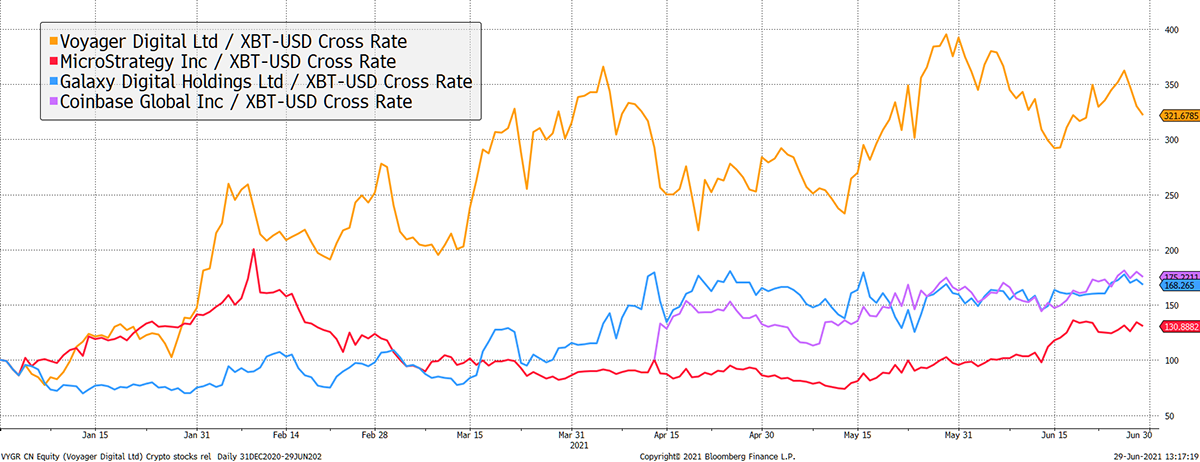
Source: Bloomberg. Leading crypto stocks relative to BTC in 2021.
To understand this, I turn to the gold market and remind myself of the relationship between gold and the gold miners.
The miners normally seem to outstay their welcome, as seen in 2015 and 2020. There is good reason for outperformance on the way up, but it neither confirms nor denies rallies. It just confirms sentiment.
Higher prices for the gold miners relative to gold is telling us that the market participants are bullish. If gold doesn’t rally, then expect a nasty setback. As it happens, the ByteTree gold valuation model is still bullish.
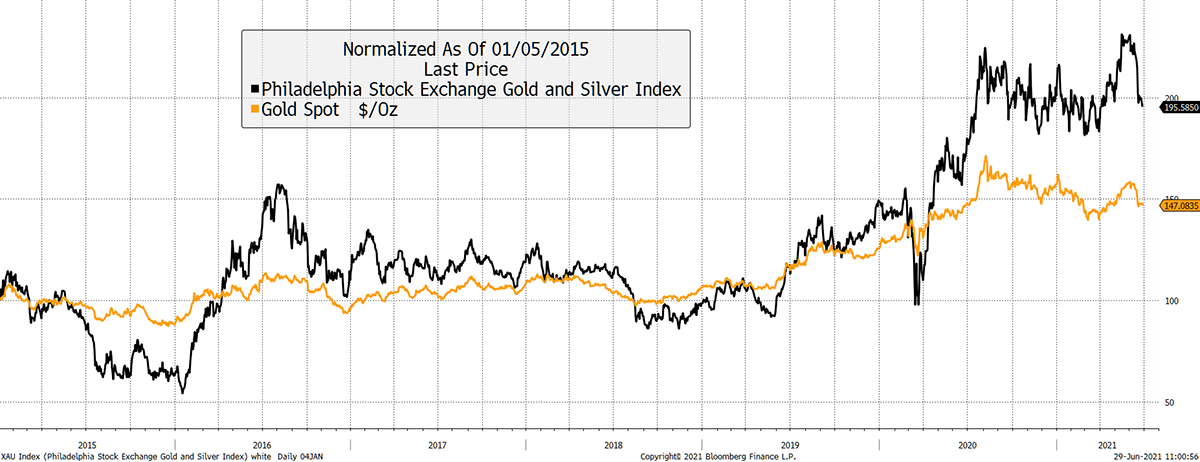
Source: Bloomberg. Gold and the gold miners rebased to $100 since 2015.
The same holds true for crypto stocks that depend on the price of Bitcoin, one way or another. The resilience of crypto stocks is telling us that the market sentiment remains bullish. Take that as you will.
Overall, I’m more upbeat than last week as a break into the $20k territory was avoided. The blockchain will start to sort itself out from Saturday and readjust. We’ll see fees drop, and most likely, price consolidation continue. But remember, this is Bitcoin. Anything is possible.

