

In this piece I will show you how to trade Litecoin using ByteTree’s Network Value Transaction Ratio (NVT-BT). The NVT-BT is a network valuation measure. Low readings indicate that coins are trading cheaply, and are a buy, whereas high readings denote higher risk and the time to take profits. I have successfully used this indicator to trade crypto since early 2015.
NVT-BT is calculated by taking the network value (sometimes called market cap) and dividing it by the transaction value; both in dollar terms. The numerator and the denominator contain price and some critics view this as heresy as this indicator is circular.
Note that this is also true for a wide range of economic statistics (debt to GDP etc.) and equity valuation measures such as price to earnings (PE).
In our opinion, NVT-BT is the price to sales ratio for crypto. It isn’t a PE as blockchains do not generate profits, but the value of transactions over the network are not dissimilar to sales.
Network value and transaction value are closely related
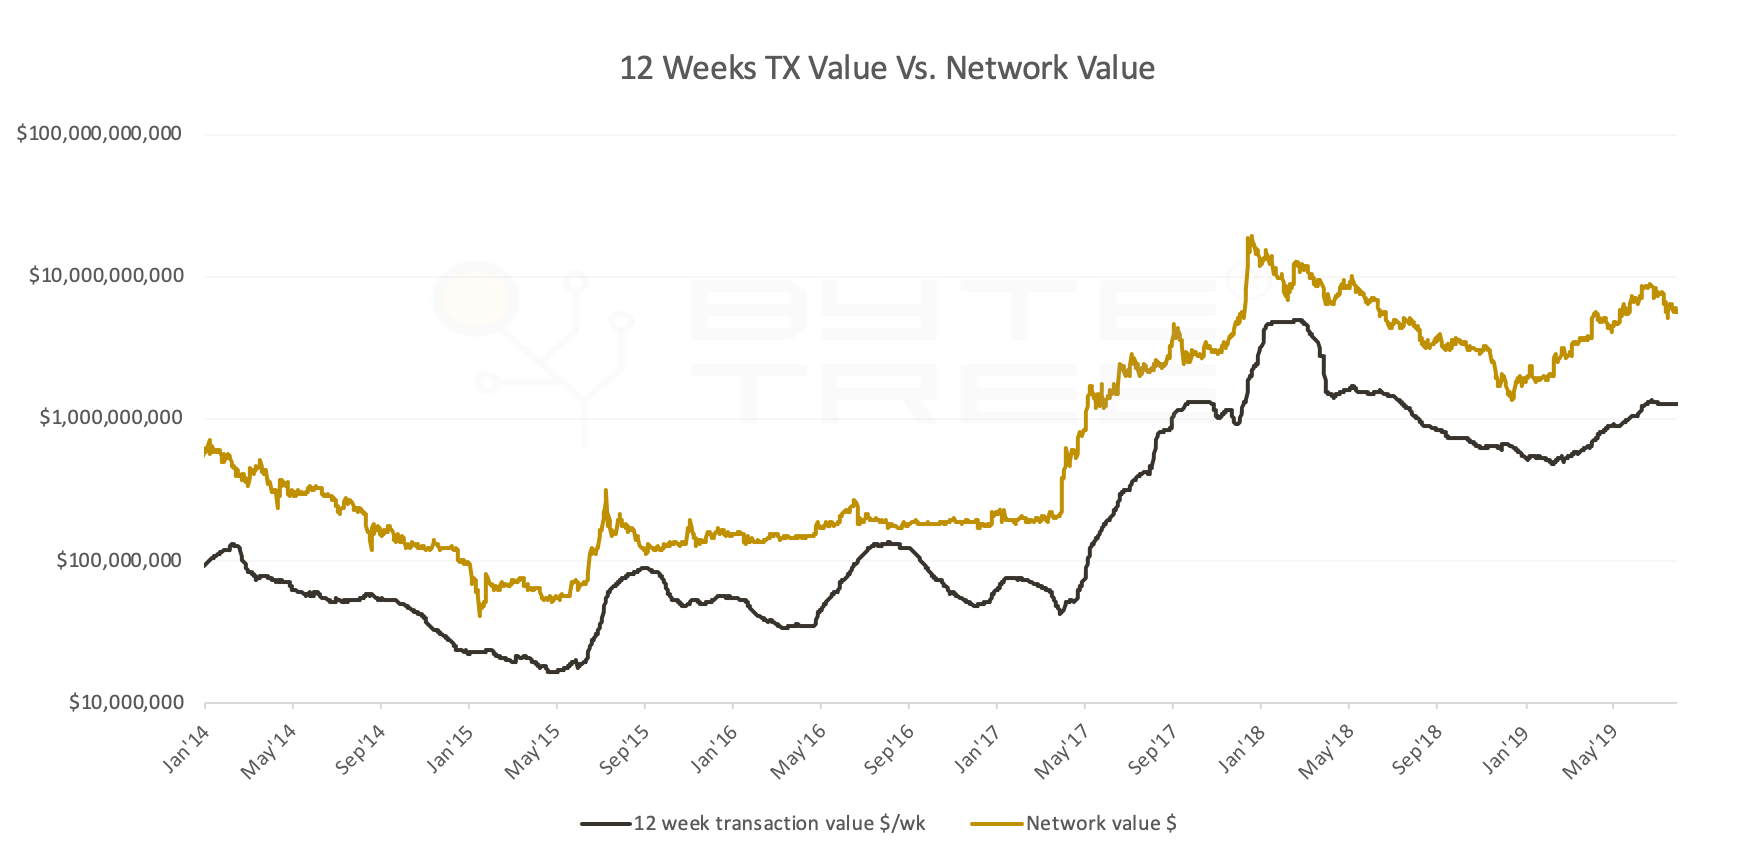
Over time, the network value is closely associated with the usage of the blockchain. In other words, the more people that transact, the more valuable the network becomes. But usage is cyclical; best to stay long when it is rising and sit out when it is falling.
There was growing interest in Litecoin in 2017. On 25th January’17, there was a price low of $3.69, which peaked on 18th December at $358.60; a 97x gain. The network value surged from $181m to $19.441bn; a 106x increase (or a lesser 97x for price as 4.9 million new coins were created). Yet Transaction value rose just 28x. That meant price rose much further than justified by fundamentals. NVT-BT started at 2.4x, which is dirt cheap, and ended the rally at 9.3x. Late buyers got a bad deal, in contrast to the early buyers who got a bargain.
| Date | Price | Transaction Value | Network Value | NVT-BT |
|---|---|---|---|---|
| 25/01/2017 | $4 | $74,317,217 | $181,816,997 | 2.4 |
| 18/12/2017 | $359 | $2,088,349,875 | $19,441,131,487 | 9.3 |
| Gain | 9,729% | 2,810% | 10,693% |
Source: ByteTree. Litecoin data since 1st Jan 2014.
With a valuation metric such as NVT-BT, rational decisions can be made as when to buy and sell. The NVT-BT can be seen in the grey line. It has averaged (median) 3.46 over time; a number that has proved to be relatively stable. When it is below average, and turns up, a buy signal is generated. And when it is high (say above 5), and turns down, a sell signal. The buys and sells are denoted by the arrows.
Buy low, sell high
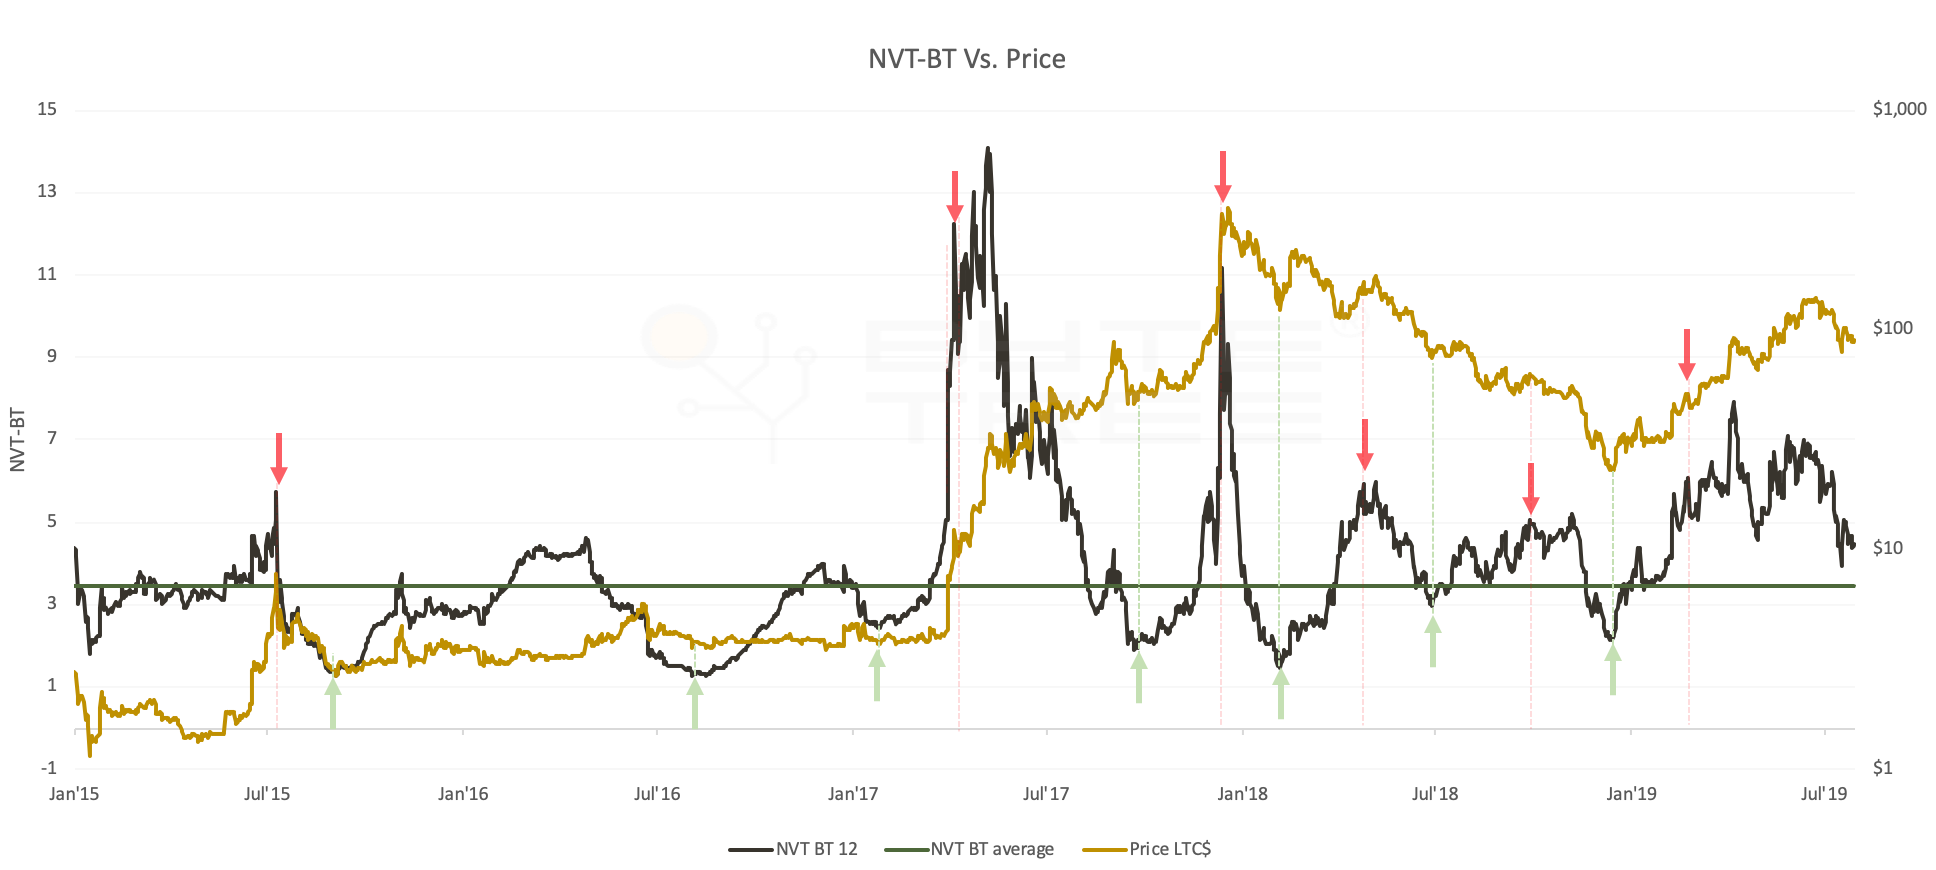
Although the signals can sometimes be ambiguous, as levels are never quite the same, this analysis provides a useful guide as to when it is safe to buy and when it is not. For example, this year has seen the NVT-BT increase, presumably in anticipation of halving. I wouldn’t necessarily be bullish here and would prefer to wait for the network to grow, or for the price to ease back. The current 12-week NVT-BT for Litecoin is 5.46, which is calculated live on Bytetree.com. It is updated every single block, giving you the most up to date readings possible; something not matched on any other site.
I would suggest that successful crypto investors should be aware of the relationship between price, transaction value and the NVT-BT. It’s a triangular relationship that is very powerful. The best time to be long is when both transaction value is rising along with the valuation. Under such circumstances, price can explode. In my next piece, I’ll combine NVT-BT and velocity see my last post to see how we can use the combination of price and non-price network value measures to make better trading decisions.


