

In this piece I will use a blend of price and non-price indicators to help you spot a Litecoin rally. Price is useful, but it isn’t a leading indicator. I will show you how ByteTree’s network velocity acts as a leading indicator for price.
If you haven’t already seen it, be sure to check out the introduction to this week’s series. We will be releasing an article on the Litecoin Network every day this week in the lead up the halving.
Velocity is a non-price indicator, which means it is calculated from on-chain metrics alone. To calculate velocity, you take the Transaction Value (measured in coins), divide it by the Total Coin Supply, and then annualise it. For example, sum the number of coins that moved over the past five weeks, divided them by supply and then multiply that by 52 (using average weekly data). The resulting number for Litecoin is an average around 1300%, from 2015 to today. Put another way, a typical Litecoin moves 13 times per year. Since many coins sit in cold storage, this means when a coin moves, it moves like lightening.
Litecoin’s Network Velocity
Velocity is a measure of network vibrancy. It isn’t looking at price, merely network activity. Yet it stands to reason that velocity is a mean reverting time series. That is, it won’t shoot to infinity, nor slump to zero (unless a coin is truly dead). With a historic average of 1300%, we get a sense that higher readings indicate hype, and lower readings, despair. This hype and despair should be understood in the shorter term and relative to the current market conditions.
On the chart below we can see that short-term spikes in velocity are historically accurate for anticipating price spikes. That is not to say that a certain velocity corresponds to a particular price, since there are a number of factors that determine price outside the scope of this article. The important bit to take away is that velocity indicates hype and despair relative to the current market conditions.
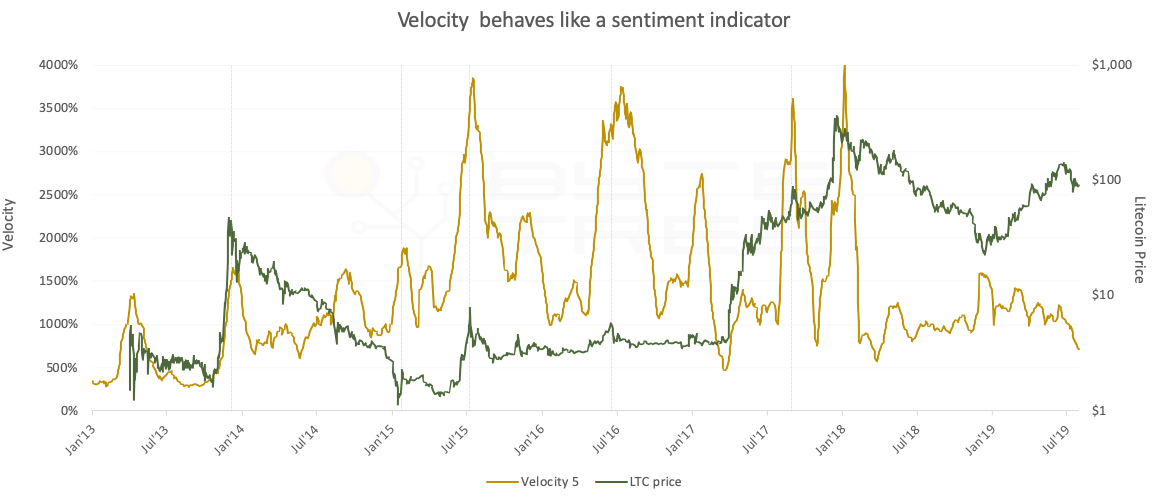
Looking over a longer time period, there was growing interest in Litecoin from early 2013 to mid-2015, despite the 2014 slump in price. Velocity reached 4000%; a number it tested three more times. Major velocity peaks consistently coincided with a medium-term price peak, with troughs following a similar pattern. Good examples of contrarian buy signals came in late 2013 and early 2017. On both occasions, velocity turned up from a significant low, and the price of Litecoin rocketed.
How does Litecoin compare to Bitcoin?
To put Litecoin’s velocity into context, Bitcoin’s post 2015 average velocity is 786%; nearly half the level of Litecoin. In its earlier years, Bitcoin’s velocity was significantly higher. This drop in average velocity is likely attributable to the maturity of the Bitcoin Network. Low value transactions are moving over to layer-2 solutions like the lightning network, as well as higher throughput main-chains such as Litecoin. Bitcoin supporters should not be concerned by this, since it indicates a change in use case rather than redundancy. Bitcoin continues to handle the lion’s share of total transaction value and has an average transaction value three times that of its closest rival.
In summary
You can watch ByteTree’s velocity numbers flash away as the blocks glide through our system. When they are high, consider that the rally is mature. And when they are low, it might be time to get excited.
With Litecoin’s block reward halving next week, and velocity approaching the doldrums, it may be time to get more excited. But there is no need to trust this indicator alone. In this series we’ll next look at ByteTree’s NVT ratio and see how valuation comes into play. After that, I’ll put velocity and NVT together. It’s going to be a great week.


