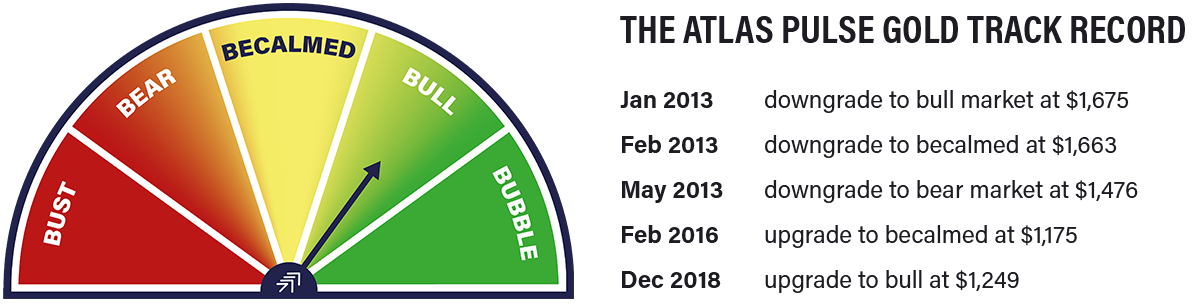
Atlas Pulse Gold Report Issue 104;
The notion that gold is a crowded trade is greatly exaggerated. After this enormous rally, it should come as no surprise that gold gives a little back. This will be over when gold is widely owned by investors, budgets are balanced, and there is an outbreak of geopolitical stability. We are a long way off from that. Gold is hot, but it’s not red hot, and I will look at some charts to illustrate that.
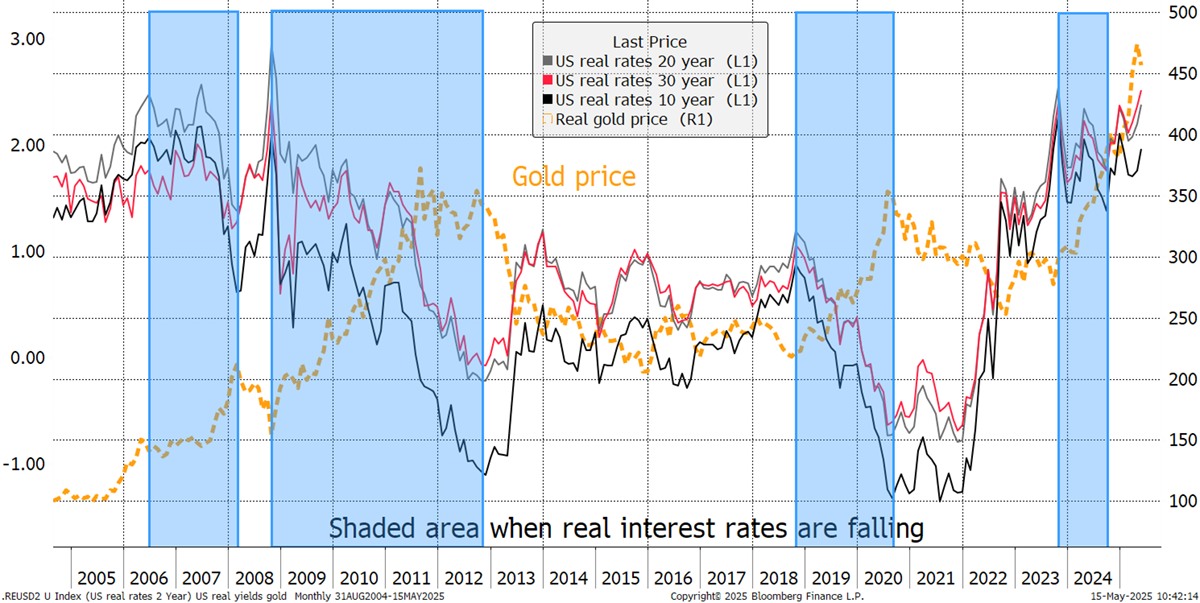
Until 2022, the gold price was all about US real interest rates, which is the US treasury yield less the expected rate of inflation. When real rates were falling (blue shaded), gold rallied. Recently, we have seen real rates rise alongside a strong gold price, and perhaps this is too much to handle. In the chart, I show the real gold price (gold after inflation).
Gold and US Real Interest Rates – Since 2004
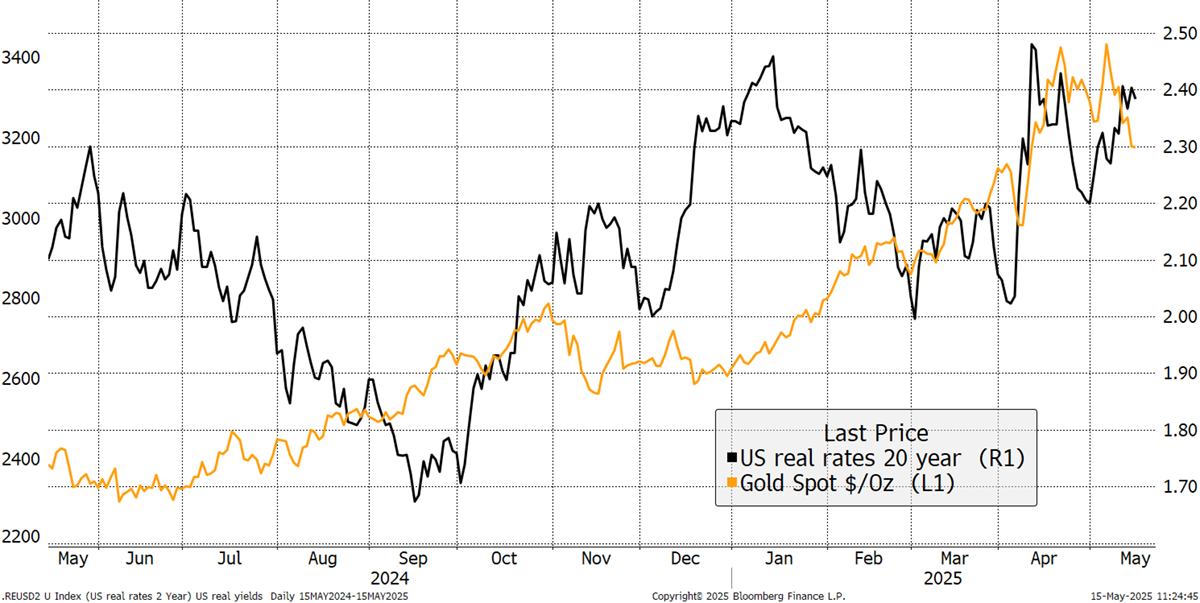
Looking at the gold price and 30-year real yield reveals how they have recently become correlated, which is bizarre. Normally, when things like this happen, we should look to other factors to explain events. In 2025, we had Liberation Day, the dollar slump, trade wars, and hot wars. Deficits haven’t gone away, and China has joined the gold rush. Let’s also not forget the increase in investment demand and steady buying from non-OECD central banks. These reasons are more than enough to understand why gold rose in the face of higher US real long-term interest rates.
Gold and US Real Interest Rates – Past Year
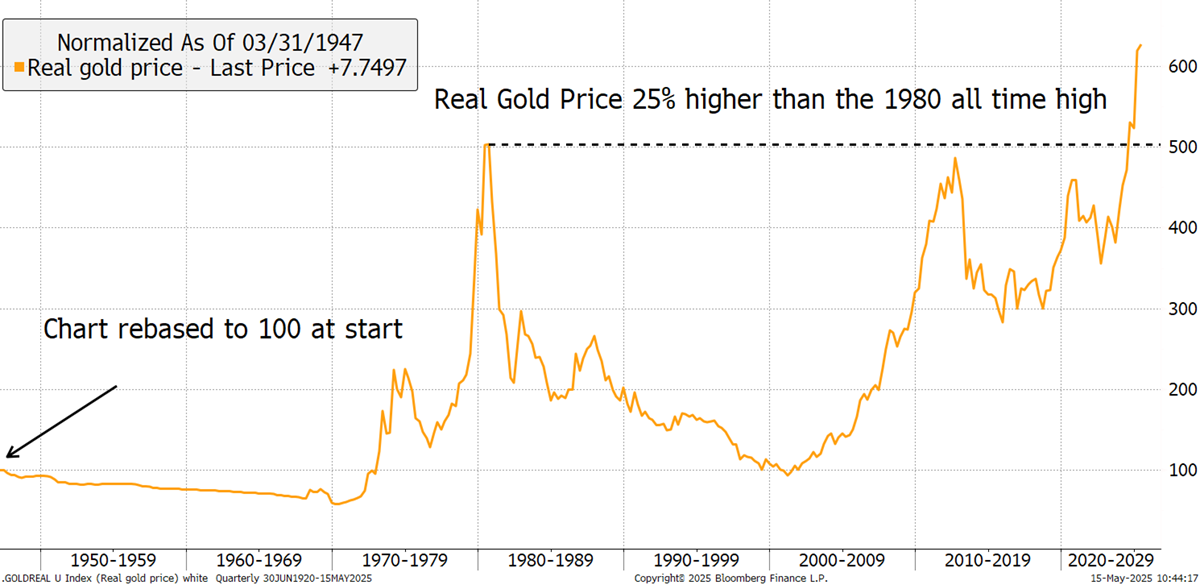
More recently, the dollar has bounced after a slump, and there seems to be a surge in trade deals, along with hints of peace. While these are good for mankind, they aren’t so welcome for the gold price. Yet, on a big-picture basis, the real price (adjusted for inflation) of gold is 25% higher than it was in 1980.
Real Gold Price – Since 1948
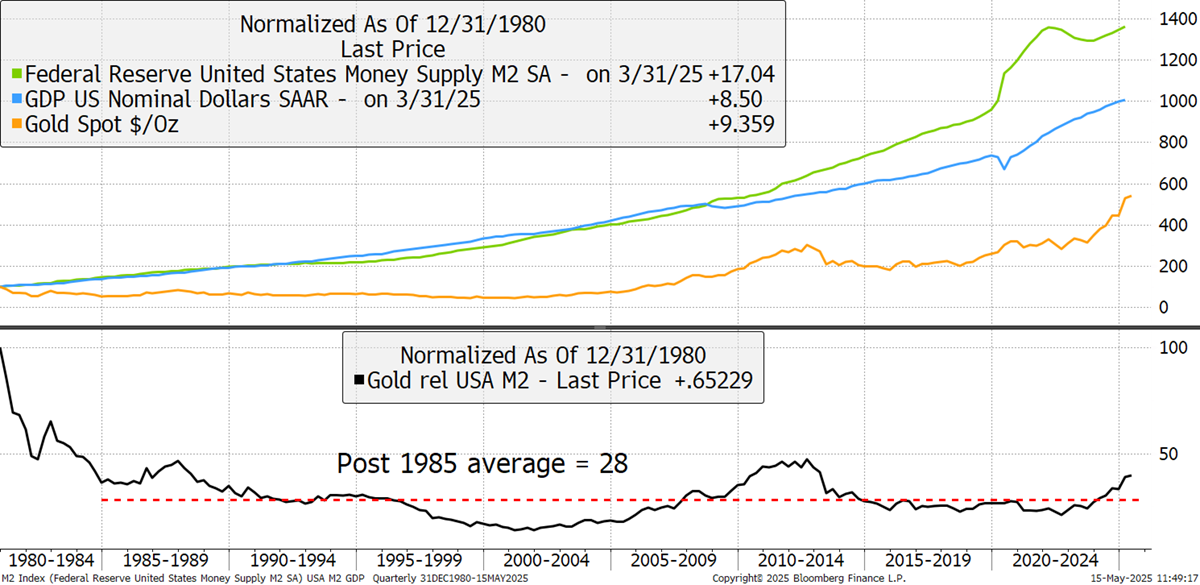
1980 was indeed a bubble, but real terms don’t catch all. It is a good gauge of the cost of living, but gold is not a consumable object. It is a monetary asset, and when compared to the money supply (M2) or, indeed, nominal GDP, the gold price is still 60% behind 1980 levels. The post-1985 average has been 28 (lower chart), so gold is ahead of that. But recall the 1985 to 2000 period was the era of the Golden Doldrums. It is only after 2008 that you can say gold has become formally relevant again, just as it was for thousands of years pre-1971, when gold came off the standard.
Gold Price and the US Money Supply and Nominal GDP
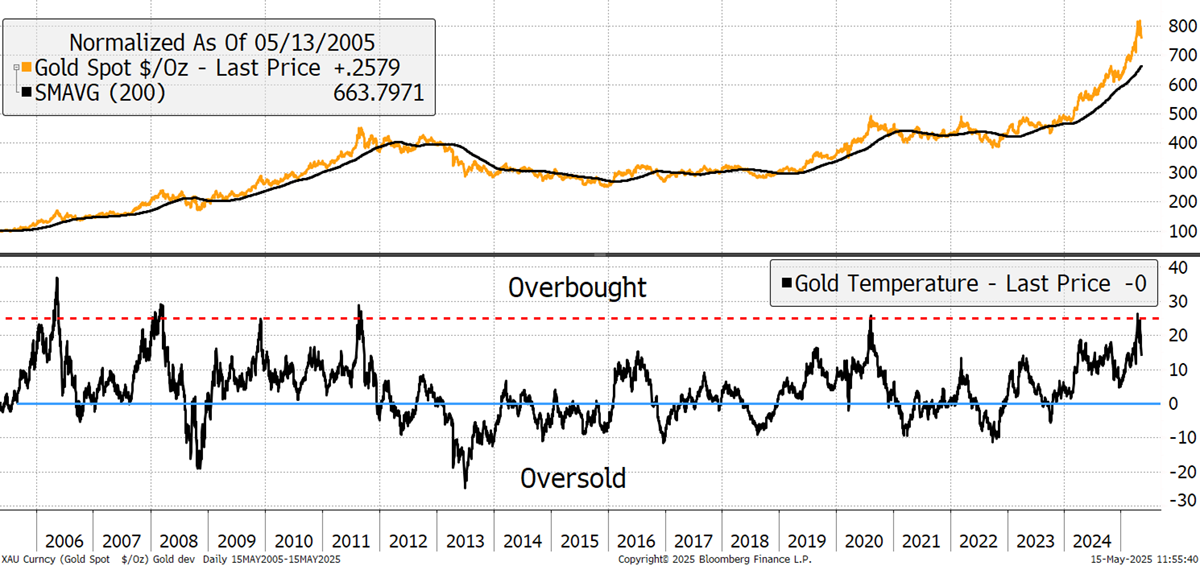
Gold is hot, but it’s not red hot, and I will look at some charts to illustrate that. I have recently been focusing on this chart, which shows the gold price and its deviation from its 200-day moving average. Recall, this chart is the gold price in US dollars, which flatters things due to its recent fall. In any event, a 25% reading above the 200-day moving average is certainly hot.
Gold Price in US Dollars – Deviation from Trend