

Monthly Rebalancing Report;
Following rebalancing on 31st August 2023, the new weights for the BOLD Index are 24.9% Bitcoin and 75.1% Gold.
The Vinter ByteTree BOLD1 Index (BOLD) invests in Bitcoin and Gold. BOLD combines the world’s two most liquid alternative assets on a risk-adjusted basis. Due to their natural low correlation, the diversification benefits of holding both assets have been unusually high. Bitcoin prefers risk-on market conditions, while Gold prefers risk-off.
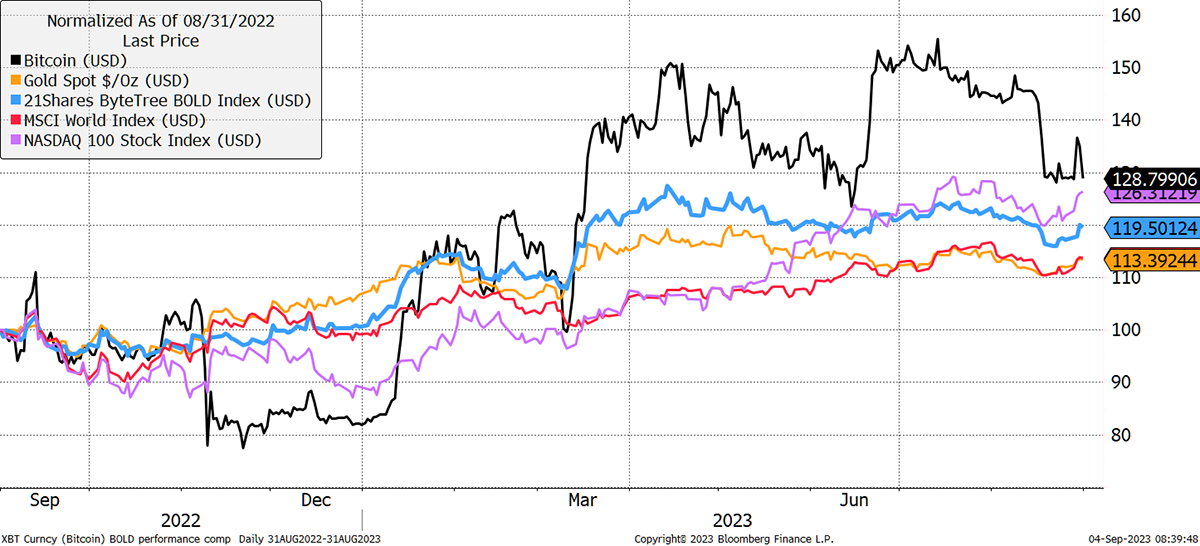
BOLD fell by 2.9% in August, taking the return for the year to 19.0% in USD terms. Over the month, Bitcoin fell by 10.9%, Gold fell by 1.3%, and global equities fell by 2.6%. A weak month overall.
BOLD, Bitcoin, Gold, Nasdaq, and World Equities over One Year
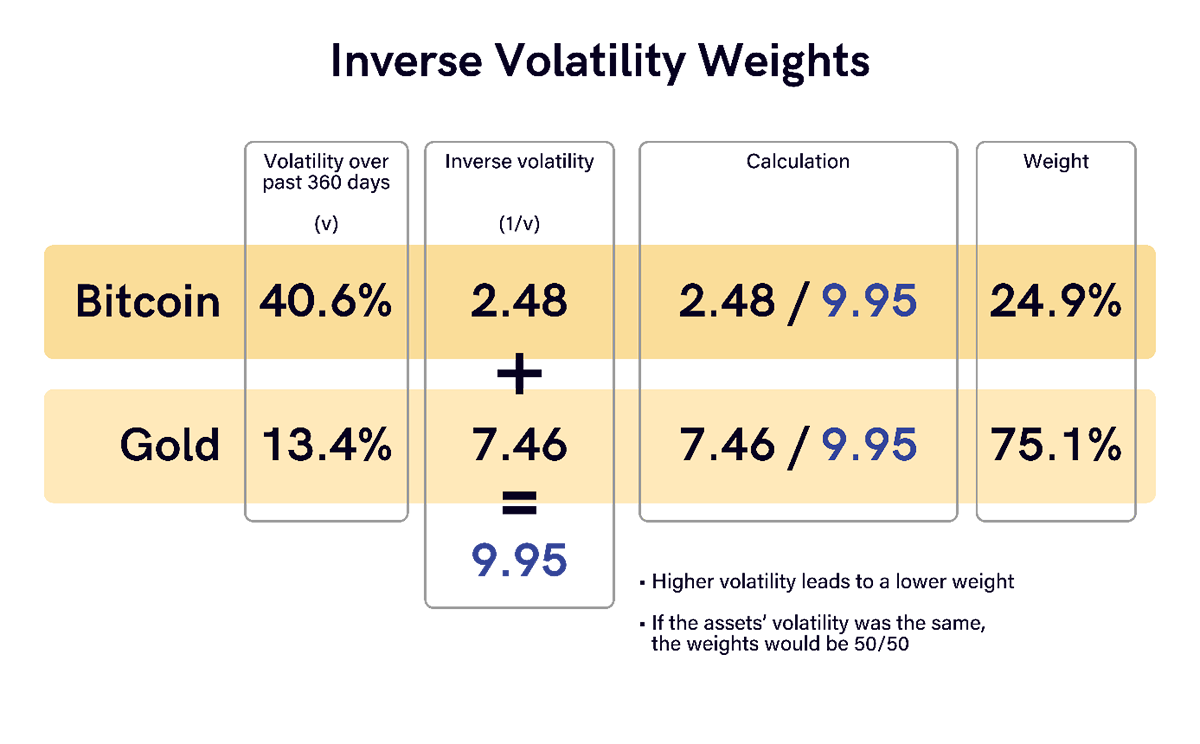
BOLD combines Bitcoin and Gold on a “risk-weighted” basis so that the more volatile asset has a lower exposure and vice versa. That means BOLD is dominated by Gold and will remain that way unless Bitcoin becomes less volatile than Gold, which is very unlikely within the next 10 or 20 years. This process makes BOLD more stable than holding Bitcoin and Gold independently.
The BOLD index uses volatility over the past 360 days for each asset. Bitcoin volatility fell to 40.4%, while Gold was 13.4%. This is the lowest recorded volatility for Bitcoin on record. Gold’s volatility has also remained low, which is normal.
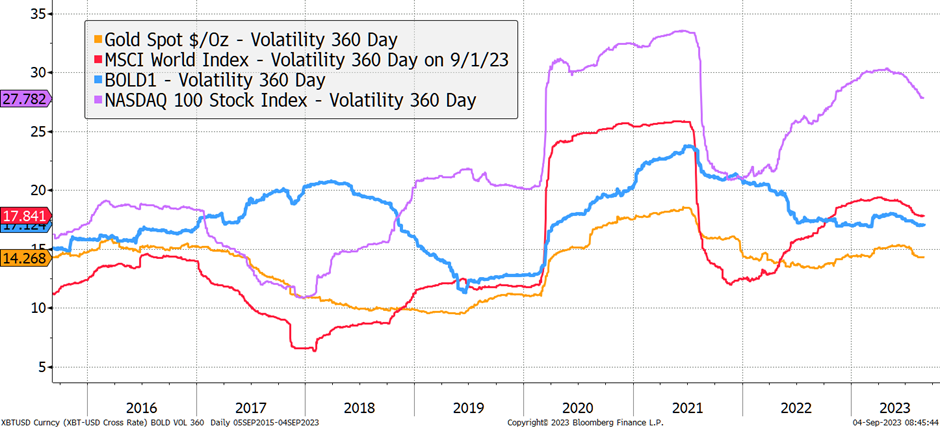
Bitcoin and Gold past 360-day Volatility
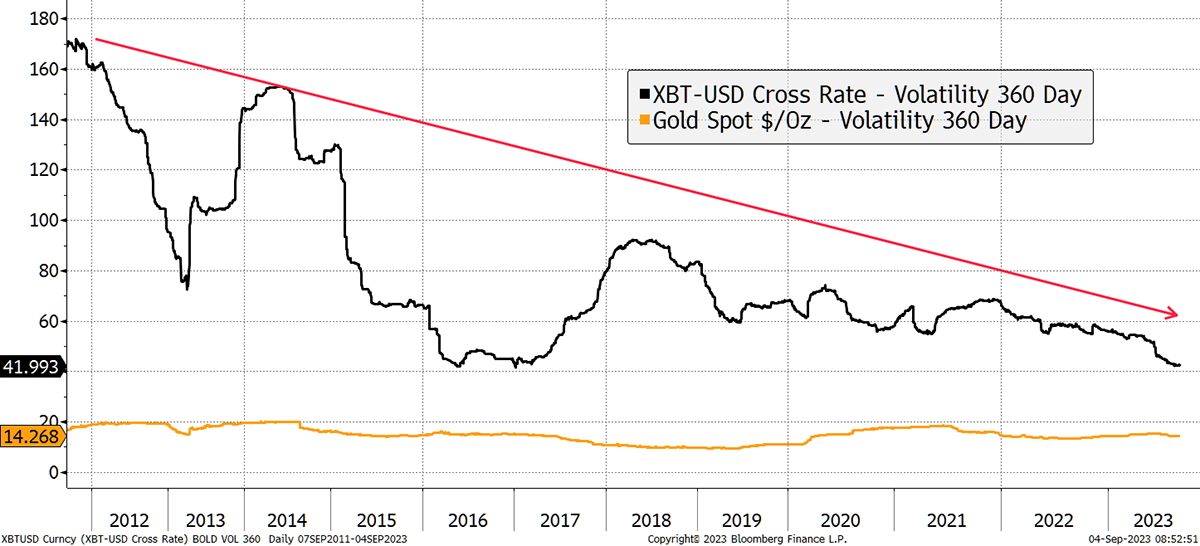
Volatility is a measure of how much prices move on a typical trading day. The brutal bear markets in Bitcoin in 2014 and 2018 saw very high volatility. In contrast, the 2022 bear market did not. This is further evidence that Bitcoin is becoming structurally less volatile and, therefore, more mature as an asset.
To put Bitcoin’s volatility into perspective, 40.4% is similar to companies such as Intel, Estee Lauder, General Motors, Adidas, Adobe and Boeing. It is lower than the volatility seen by Nvidia, Meta, Tesla and Amazon, four of the world’s seven most valuable companies. To describe Bitcoin as volatile is to dismiss how much it has evolved in recent years. But that is not to say that the crypto industry has matured, for most of that remains much more volatile than Bitcoin.
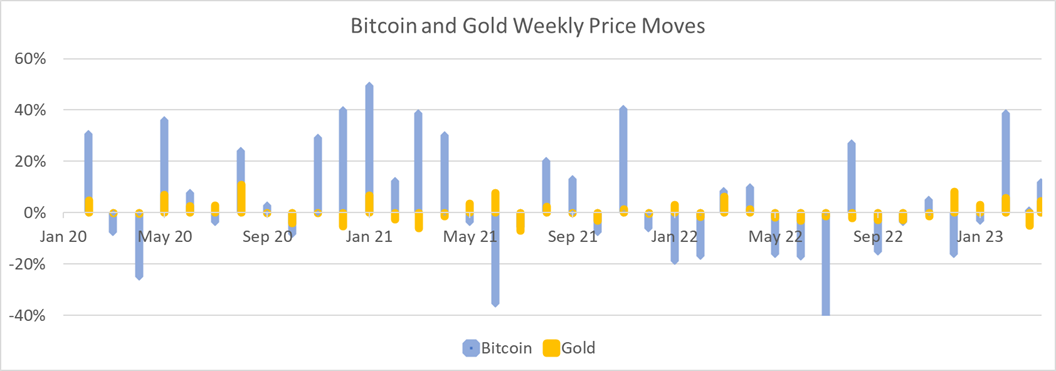
Risk-weighted asset allocation techniques are commonly used in finance to improve risk-adjusted returns. BOLD uses the “inverse volatility” methodology, which means the more volatile asset has a lower weight in the basket and vice versa.
This can be demonstrated with some monthly return data for both assets. Notice how Bitcoin (blue) has much larger moves than Gold (yellow) because it is more volatile. Note also how the two assets often move in opposite directions. That makes them good natural diversifiers.
If the price moves for Bitcoin are reduced by the historical average BOLD Index weights, 80% and 20%, the volatility for both assets becomes equalized, and the outcome is much calmer.
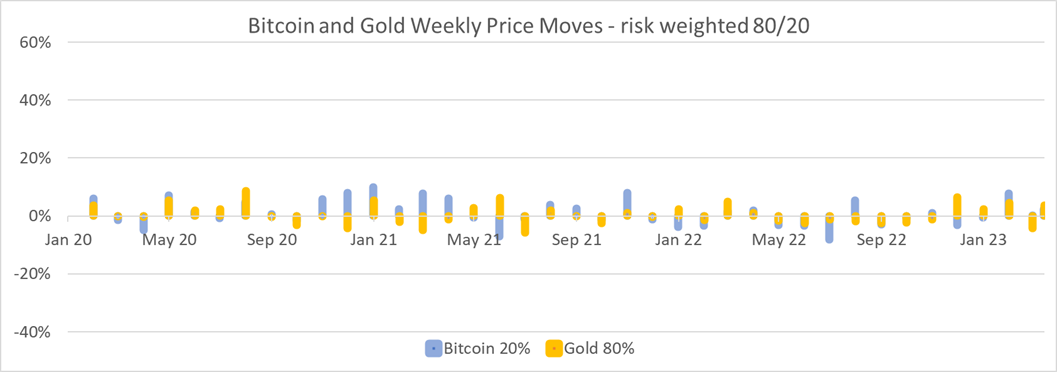
To calculate the exact weights in BOLD, we compare volatility using this process. The outcome is that the more volatile asset gets a lower weight. If the two assets had the same volatility, the outcome would be 50/50.
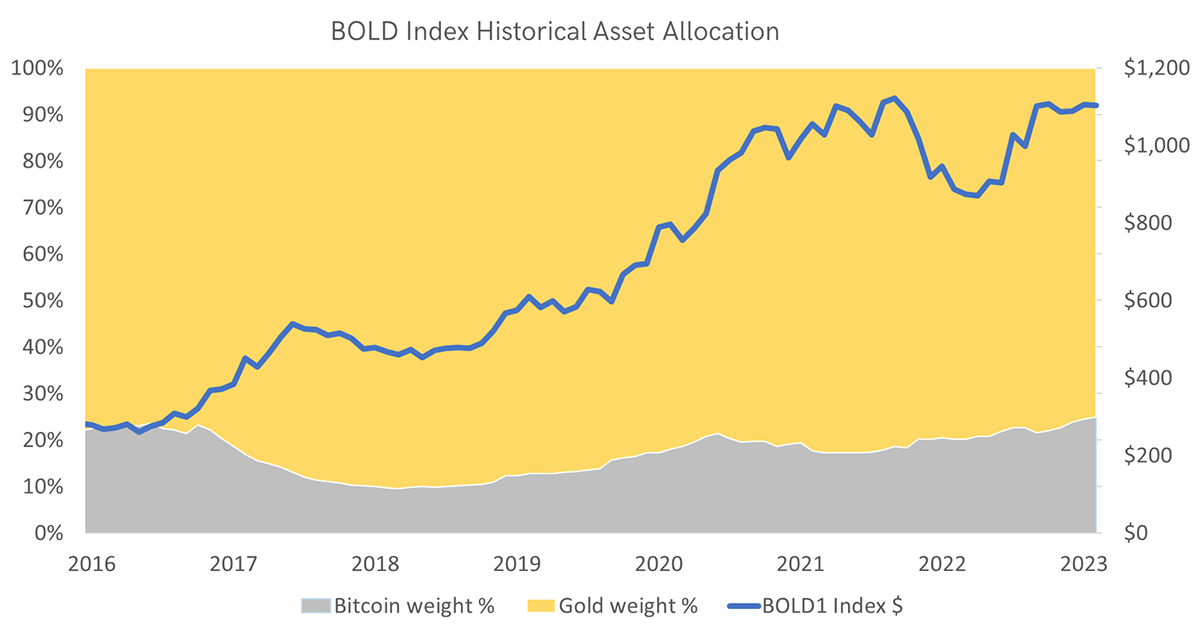
The last BOLD Index rebalancing was completed on 31st August, with the new weights at 24.9% for Bitcoin and 75.1% for Gold. Due to price changes in August, BOLD ended the month with 23.3% exposure to Bitcoin and 76.7% in Gold. As a result, Bitcoin has seen an increase of 1.6% while Gold decreased by the same amount. As always, the best-performing asset, this time Gold, has been reduced and added to the lagging asset, Bitcoin.
With 24.9% exposure to Bitcoin as of the beginning of September, this is the highest recorded Bitcoin weight in the BOLD Index.
That is potentially good news as Bitcoin appears to offer good value as it trades 11% below the fair value calculated by the network activity.
Bitcoin Fair Value from Network Activity
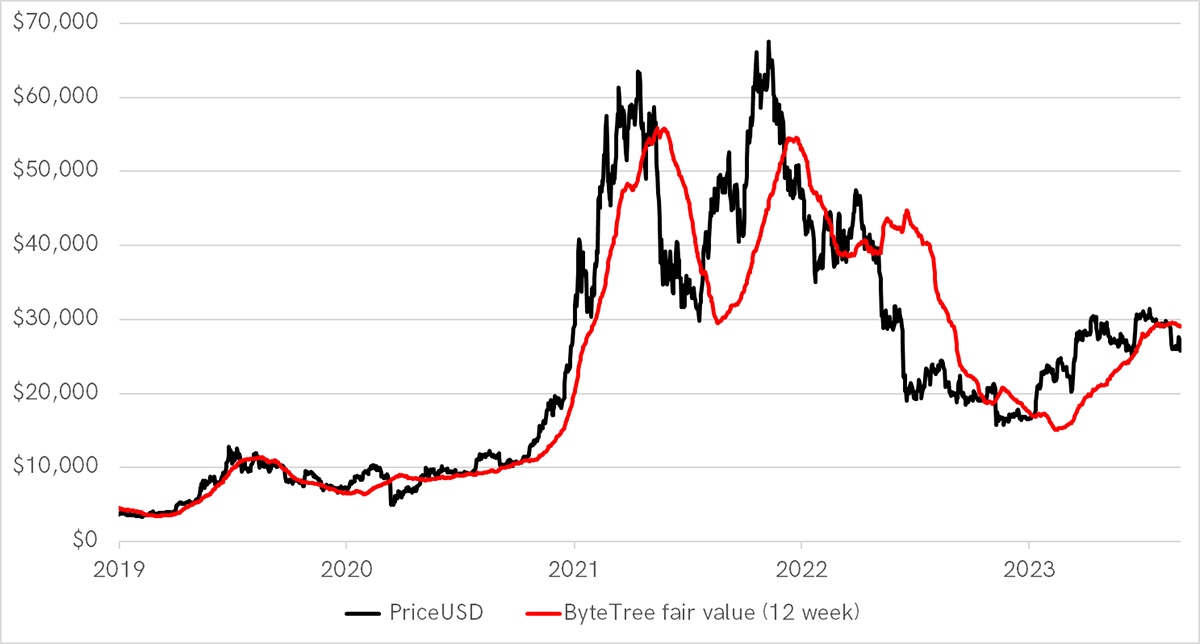
The Bitcoin network measures the level of dollar value that moves across the blockchain. In 2023, that has been rising again. With halving expected to occur in April 2024, the new supply of Bitcoin will fall from 1.8% per year to 0.9%. Historically, halving events have been bullish for the Bitcoin price.
Risk and Return
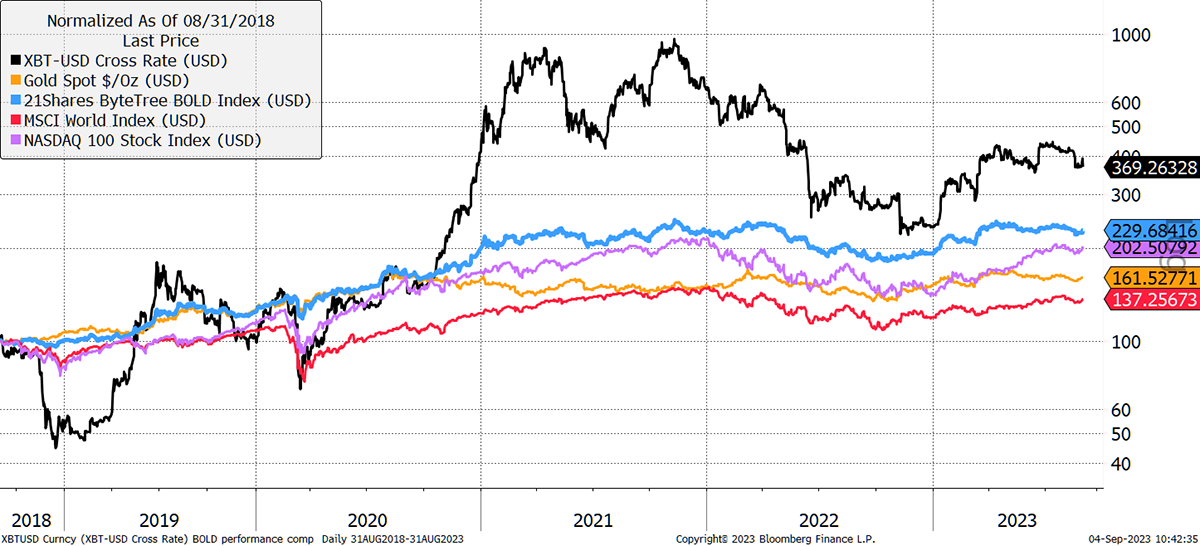
Over the past five years, Bitcoin has returned 269%, which is impressive. Gold has returned 61%, resulting in 130% for BOLD. Yet when Bitcoin fell in 2021 and 2022, BOLD remained relatively stable as Gold proved to be more resilient than general asset prices. Both Bitcoin and BOLD have outperformed Nasdaq and global equities over the period.
BOLD, Bitcoin, Gold, Nasdaq, and World Equities over Five Years
Moreover, as Bitcoin has matured, BOLD’s volatility has fallen to levels not dissimilar to Gold’s. BOLD’s volatility has also remained below the level recorded for the Nasdaq for most of the past five years. This may not last forever, but it has not been uncommon.
BOLD, Gold, Nasdaq, and World Equities 360-Day Volatility over Five Years
The asset return table shows the total returns for popular asset classes by year, with the best and worst highlighted in blue and red respectively. UK inflation-linked bonds have performed poorly, as shown by the excessive red. US TIPS have been similar. The Nasdaq has been relatively blue (buoyant), while European and Swiss equities have tended to be calm.
On the right are Bitcoin, Gold and BOLD. Notice how Bitcoin has always been the best or worst. And when it has been strong, Gold has tended to be weak and vice versa. Moreover, BOLD, like Swiss equities, has remained calm and has never been either the strongest or the weakest asset class.
Asset Class Return Table by Year
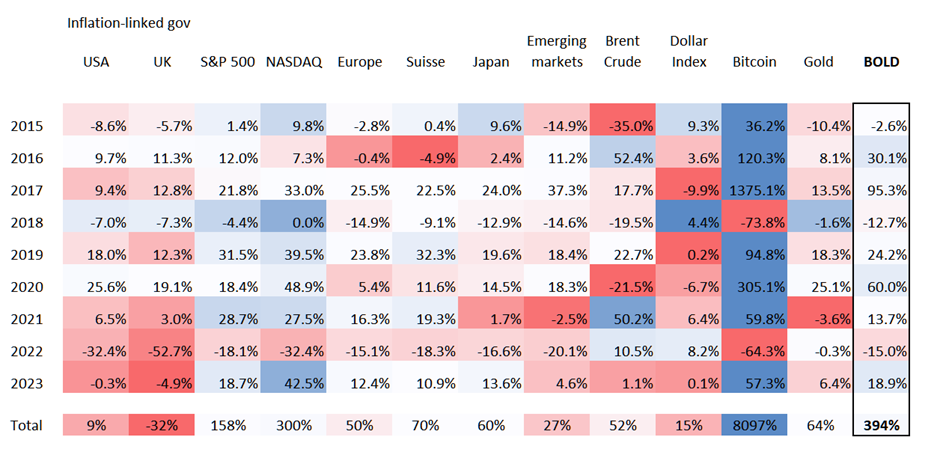
Yet BOLD has appreciated by 395%, which is less than Bitcoin but well ahead of the other asset classes. It is impressive how BOLD has beaten or matched the impressive Nasdaq since the start of 2019, 2020, 2021 and 2022. In 2023, the Nasdaq has nipped ahead.
BOLD gives investors exposure to the two most liquid alternative assets on a risk-weight basis. This is a highly efficient asset strategy that has mirrored the growth in the global money supply more closely than any other mainstream and liquid asset combination. Since 2015, the G20 money supply has grown at 6.0% per annum, in contrast to BOLD, which has grown at 21.3% p.a., or 3.6x faster.
BOLD1 has been an Effective Hedge Against Global Monetary Supply Growth
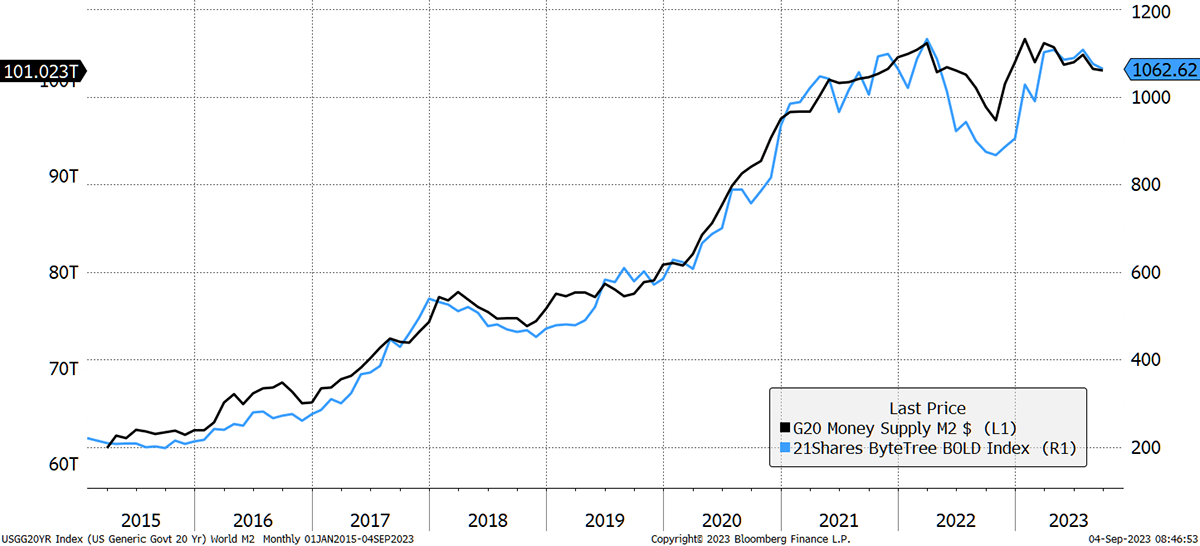
The global money supply is shrinking, which is risky for asset prices. Yet there is still new money supply from China, Japan and Brazil, with the contraction in the USA, Switzerland and Europe. The US dollar is gaining strength, which can also be problematic for risky assets such as Bitcoin and equities. Yet what we have learnt in recent years is that when things get tough, they print money, and that will buoy BOLD.
Contact
Further Information
Vinter
21Shares
ByteTree Asset Management
ByteTree Research