

ByteTrend is a trend-following tool for investors who want to embrace technical analysis like the pros. Here are a few billionaires you may have heard of who all made their money by following trends in financial markets:
| David Harding | Winton Capital |
| Paul Tudor Jones | Tudor Capital |
| Cliff Asness | AQR |
| John W. Henry | John W Henry & Co (now owns Liverpool FC and the Boston Red Sox) |
| Jim Simons | Renaissance Technologies |
They all launched businesses based on trend following, and they became hugely successful because their returns were superior to their competitors. Trend following works.
To the untrained eye, market prices appear to be chaotic, but they are not. Prices are either rising, falling, or consolidating. ByteTrend tells you which it is in both price and, more importantly, price relative to the stockmarket, which I’ll explain.
But before I do, ByteTree publishes the Adaptive Asset Allocation Report (AAA), which applies trend following techniques in ETFs. Each month, it identifies the four strongest trends to invest in, and the results have been spectacular.
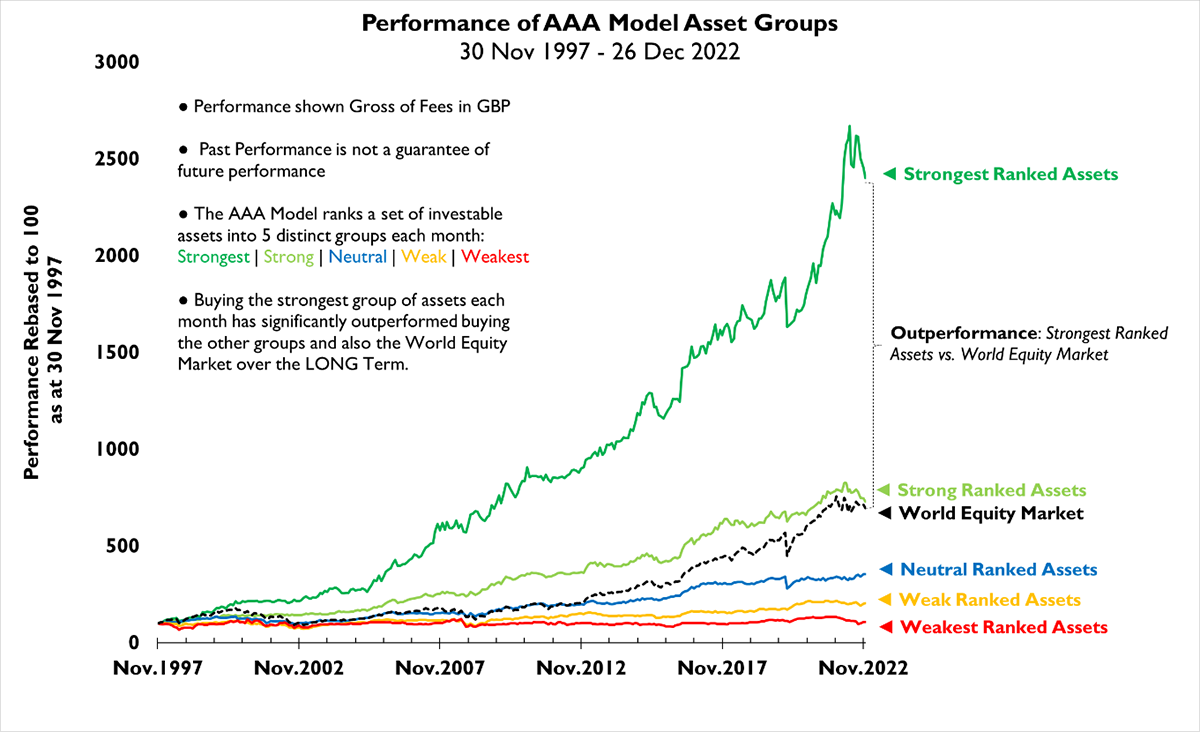
Going back to 1997, investing in the weakest trends has significantly lagged the world equity market. The strong trends have done a little better, but it is the strongest ranked trends that have left the market for dust, and this demonstrates why we seek out market trends.
Over the past 25 years, £100 invested in the stockmarket grew to £694, but if invested in the strongest trends, it did nearly four times better and compounded to £2,399.
The bottom line is that selecting the strongest ETFs using trend following techniques makes money. But don’t mistake that for thinking it is easy to do. It isn’t, and there’s work to do, which starts with measuring the trends.
Introducing ByteTrend
ByteTrend measures trends using a scoring system. The highest score of 5 means the price is in an uptrend, and the lowest score of 0, a downtrend. Scores between 1 and 4 indicate the price is consolidating or rangebound.
In this example, I use the iShares World Energy ETF (WNRG), which holds the world’s largest oil companies, such as Exxon, Chevron and Shell. The price in green is surrounded by moving averages and max min lines, which recorded the highest and lowest prices over the past 20 days.
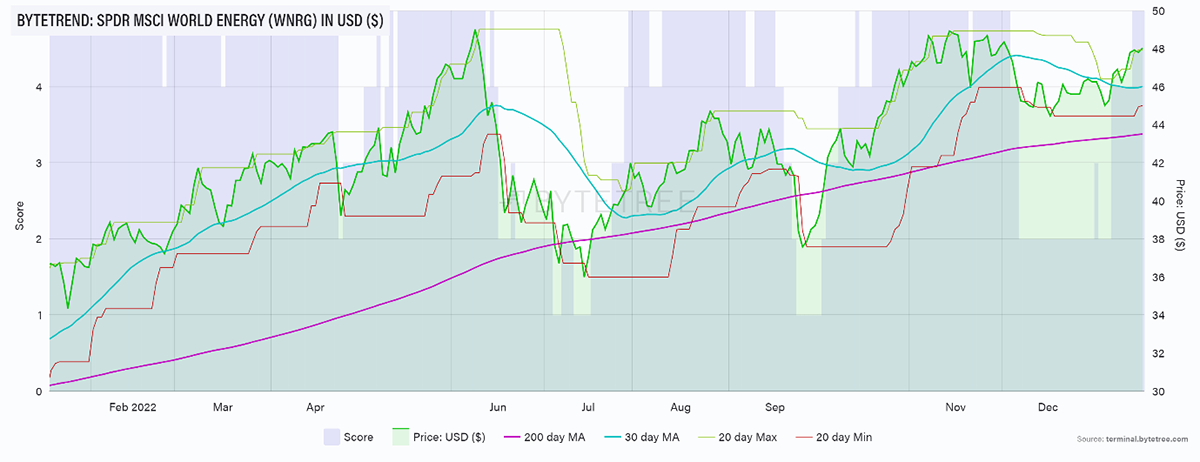
A ByteTrend score gets a point for each of the following criteria:
- Price is above the 200-day moving average
- Price is above the 30-day moving average
- 200-day moving average slope is rising
- 30-day moving average slope is rising
- The last touch of the 20-day max/min lines was max
WNRG meets all of these criteria and so scores 5 points and it is in an uptrend. Those 5 points are shown in the blue background.
Neutral Trend
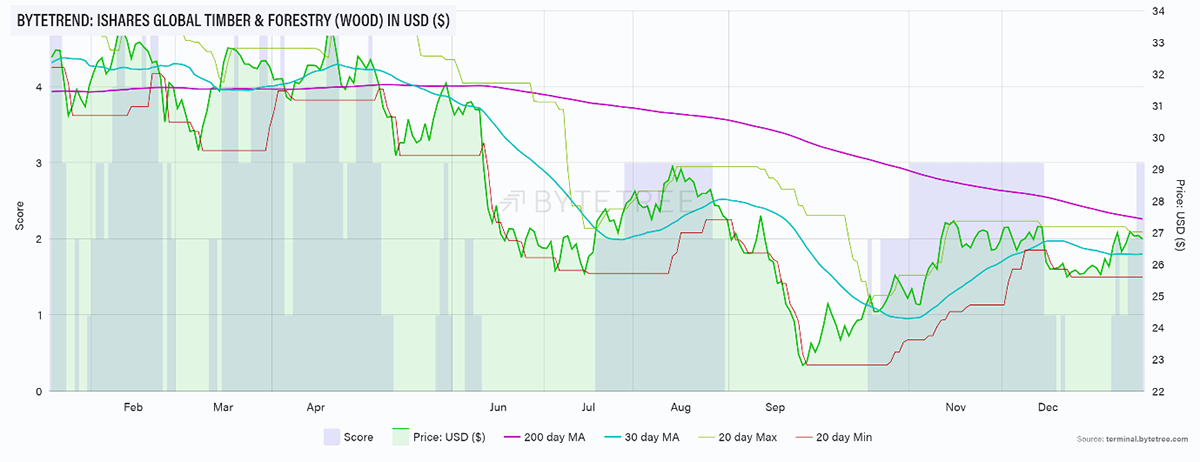
The iShares Global Timber and Forestry ETF (WOOD) holds the leading forestry and paper companies, namely Weyerhaeuser, Smurfit Kappa and Svenska Cellulosa. In this case, the price is below the 200-day moving average, which is negatively sloping. WOOD scores 3 points and is neither bullish nor bearish but consolidating.
Weak trend
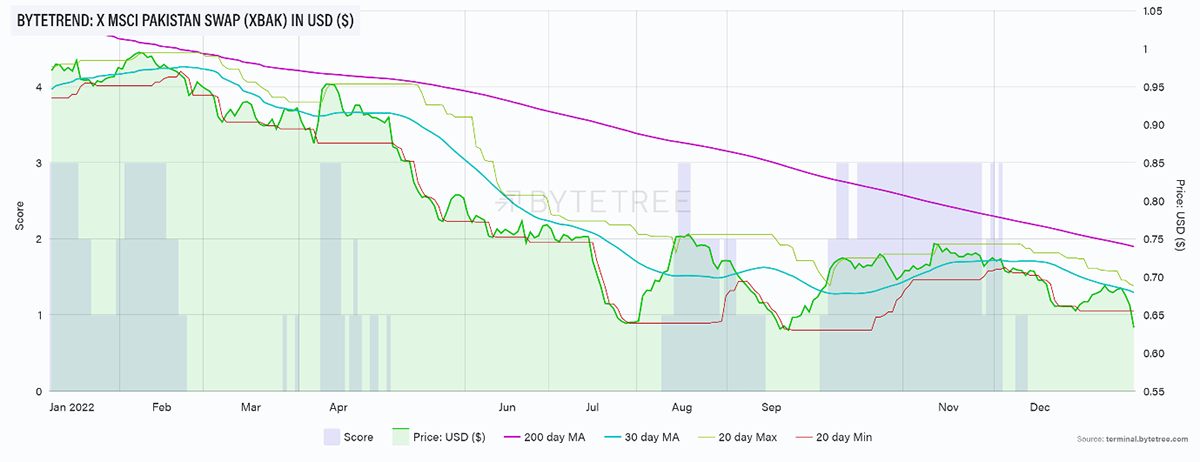
This third example shows the iShares Pakistan ETF (XBAK) stockmarket. Both moving averages are downward sloping, and price is below both. In addition, the last touch was a min. XBAK scores zero points and, despite doing well in years past, is currently in a downtrend.
We have measured three ETF trends in USD. One bullish, one bearish and the other neutral. We will now measure them relative to global equities.
Price Relative
Imagine you are watching the London Marathon from the side of the road. The runners shoot past as you cheer. How would you place bets on the final rankings?
My answer would be to get into your helicopter and get above the runners, inching forward at an average speed of around 6.5 mph. Now look down, and most runners are stood still. Yet some appear to be going backwards, and others forwards.
There is little point in betting on the average runner, and you definitely don’t want to bet on those going backwards. Those moving forwards, against a seemingly stationary pack, are the winners. They have relative strength, and they are climbing the rankings. Bet on this group. The faster they are, the better.
In stockmarkets it is no different. The market might deliver something like 7% per annum on average, with some years much better (+30%) and others much worse (-40%). You want to own assets that will rise faster in the good years and fall less during the bad. If you can repeatedly do this, your returns will far exceed that 7% average.
We now move away from measuring trends in dollars and instead measure against the market. We then ask the same question. Is the trend stronger, the same, or weaker?
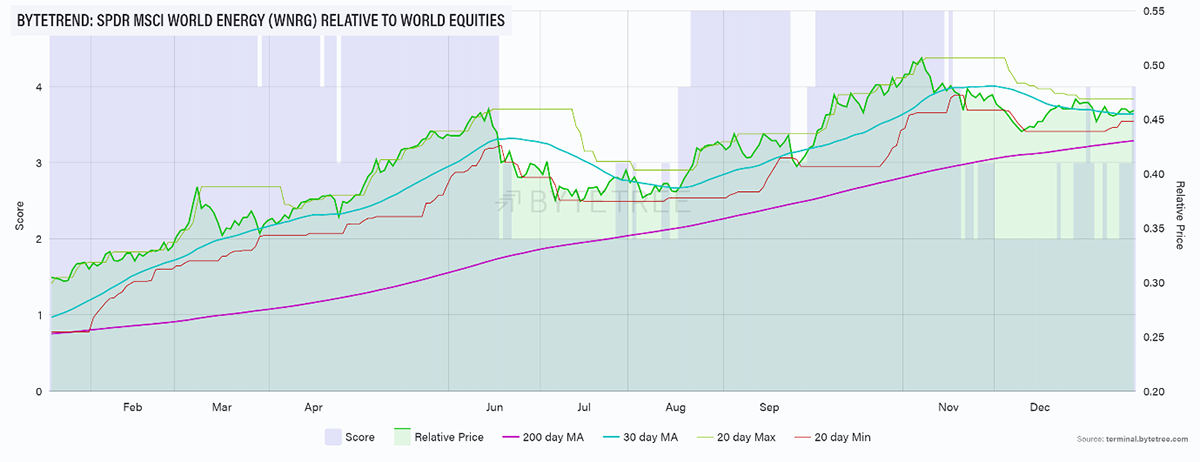
WNRG Is Still Strong, but Less So
At the time of writing, stockmarket is rising, and WNRG has 4 stars when measured in world equities. The price is above both moving averages, which are rising, but the last touch was min, and so a star is lost. A strong day or two would see WNRG regain 5 stars and become an uptrend.
WOOD Is Weak
WOOD, which had 3 stars when measured in USD, now has none measured against World Equities. The moving averages are downward sloping, with price below them, and the last touch was the min line. WOOD has zero stars and is underperforming the stockmarket.
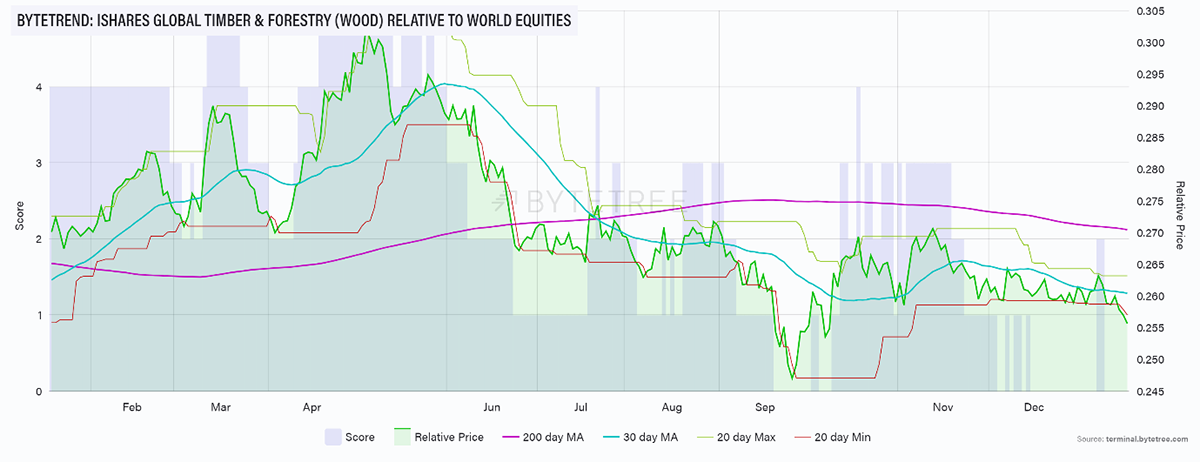
A common misconception is that something that has gone down is cheap. I would remind you of the results shown above. It is the strongest trends that make the most money, not the weak. Think of those runners and always bet on the ones moving forwards.
My last example is the Xtrackers MSCI Thailand ETF (XCS4). It scores 5 stars relative to the world with all criteria met. It was in a downtrend until August 2021 before starting to turn up. It made its first 5-star trend in February 2022 and has been doing well ever since.
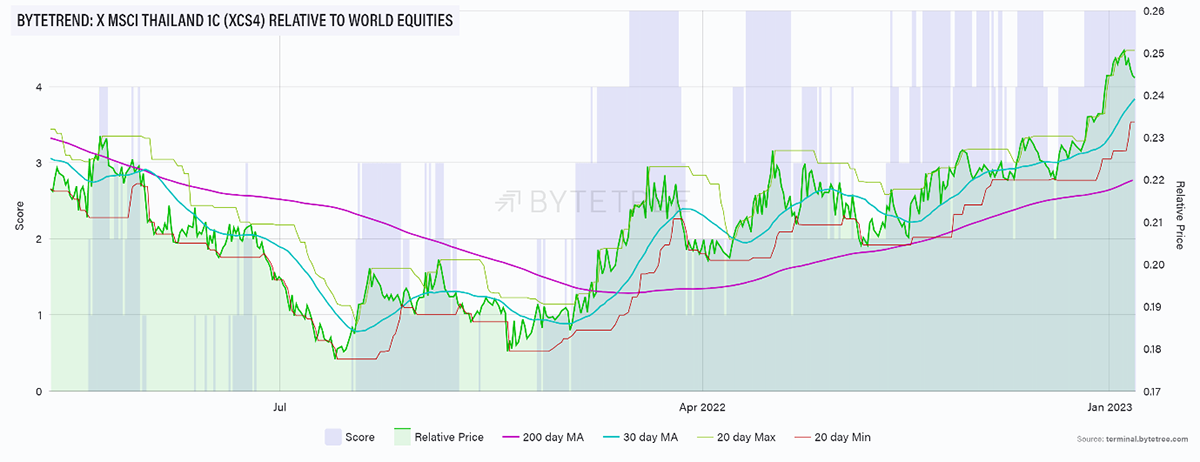
Sometimes the short-term signals have wobbled, but the key is the 200-day moving average is now sloping upwards with price above. This is the most important longer-term measure of trend, and it is very likely that Thailand will continue to beat global equities for some time to come.
As the saying goes, trends go on for longer than people think.
Summary
Trend following is an effective way to beat the market, but it requires discipline. You need to select your winning trades, and your portfolio needs to be frequently rebalanced. Do this, and you will win.
Use ByteTrend to help you, but you might also consider learning from the pros. Robin Griffiths and Rashpal Sohan select the strongest trends each month in The Adaptive Asset Allocation (AAA) report.
Using their proprietary AAA model, Robin and Rashpal rank a set of important assets to show the leaders at each phase of the business cycle. Using their approach, Robin and Rashpal have demonstrated how an Adaptive Asset Allocation approach can significantly compound wealth over the long term by growing it during the good times and protecting it during the bad. The model is run monthly, and the performance of the model can be mirrored by using Exchange Traded Funds (ETFs) or Managed Funds.
AAA is ideal for private investors who are interested in compounding their wealth over the long term using a portfolio of assets. You can read the report here.


