

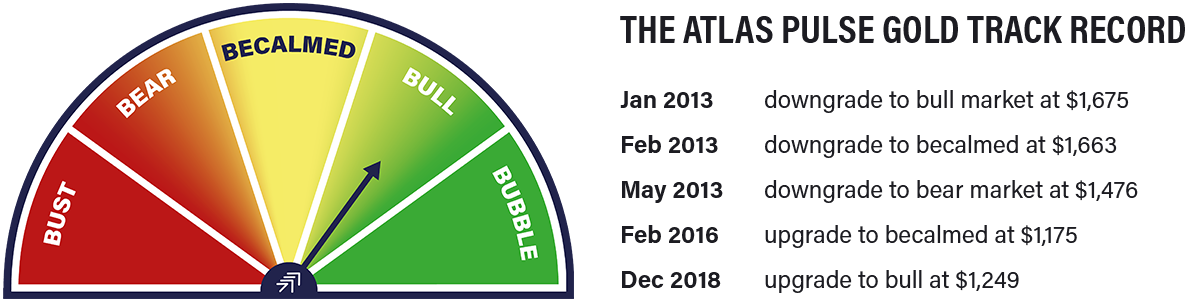
Atlas Pulse Gold Report; Issue 79
Atlas Pulse last called bull market for gold in late 2018 at $1,249. After a big move, I am asking difficult questions - to see whether this bull market continues or whether I should be calling time. Strong arguments are evolving on both sides, and in this issue, I explore them.
Highlights
| Technicals | Too good |
| Macro | M2 or CPI? |
| Flows | The value of liquidity |
| Real Rates | Heading south |
So Obvious, Say the Gold Bulls
On the one hand, it is easy to be gloomy about the world and, therefore, bullish on gold. As we keep being told, a recession is coming, and the central banks, who are supposed to be fighting inflation, will bottle it because they always do.
Inflation will then rip while interest rates fail to follow. After all, how can they? We are trillions in debt and are struggling to pay the interest bill as it is. We will have no way of fighting inflation, and a new gold standard is coming.
Just look at the money supply. We print money until the presses run red hot, yet the gold price is still below the money supply. It’s catch-up time, and the suits in Davos know it.
Last year saw record gold purchases from the central banks, using money that would normally have been spent on other governments’ bonds. But NATO weaponised bonds when Russia invaded Ukraine and had her reserves confiscated. No one is buying bonds now.
That probably explains why gold looks overpriced against US TIPS. If there is a lack of demand for US treasuries, it follows that TIPS would trade cheaply. Lower demand lowers prices, therefore increasing the yield, which means future inflation appears to be understated.
Inflation is out of control, the economy is in trouble, and the big fat pile of debt will never be repaid. The Fed will have no choice but to pivot within months. Just check out the long-term chart - it’s a corker.
Buy gold.
The World Is Fragile but on the Mend, Say the Gold Bears
The central banks are serious. Interest rates have never risen this quickly in history, and that shows how determined they are to fight inflation. Already we are seeing prices return to normal. In economic terms, the pandemic was a supply shock, which has passed, and the energy crisis is behind us.
Better still, we have China reopening, and a billion people want to jump on a plane and see the world. Demand will be huge, and any recession we were going to have has cooled. We will muddle through.
Gold is overpriced. The TIPS model is flashing red, and the central banks buying gold are overpaying. Have you seen one-year real rates? They are 2.5%, although I will admit they have dropped from 3% since last week. Gold can’t stomach that for long before it buckles.
As for M2, don’t mix prices and quantities. Do it properly, and you’ll see that gold is a bit rich. There’s 21.7 trillion dollars out there and $12.7 trillion of gold. That’s 58%, which is above average.
Here in the ivory tower, we institutional investors have been dumping gold since 2020, and we are right. It doesn’t even pay a yield and has career risk written all over it. I’m sticking with big tech and Terry Smith, who have made me look good for years.
Sell gold. And while I’m here, that bitcoin thing is a Ponzi scheme.
Who’s right? Let’s dig in.
Technicals
The long-term gold charts cannot be ignored because they are so damned good. Starting with gold in dollars, the price is on the verge of an all-time high following a decade of consolidation. A breakout is imminent. Surely!
Gold in Dollars
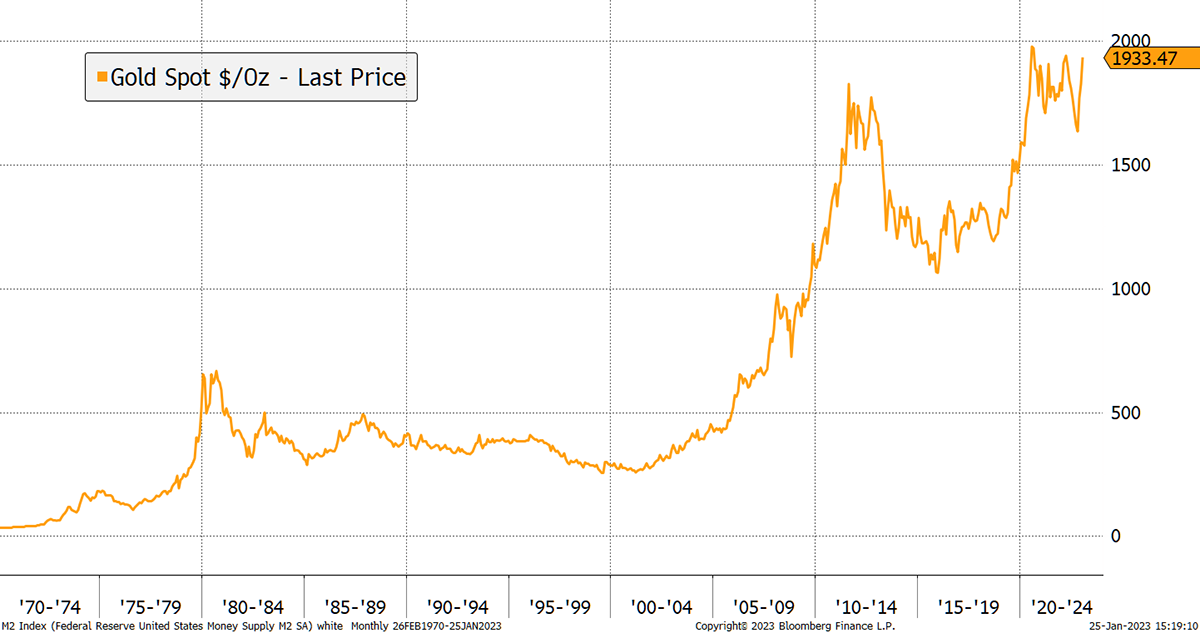
Source: Bloomberg
It would be odd for the chart above to suddenly reverse. It’s possible, just unlikely. Besides, gold isn’t even very stretched and has recently been tested with a 20% correction.
More important than price is price relative because it shows the opportunity cost. I show gold relative to the S&P 500 on ByteTrend. It has a 5-star trend which started warming up a year ago. These things don’t tend to reverse quickly. Whether gold rises or falls, it’ll do better than the S&P 500, and there can be little doubt about that. That ought to attract investors because gold offers not only higher returns than the S&P 500, but diversification too.
Gold Leads Equities, Which Is Historically Bullish
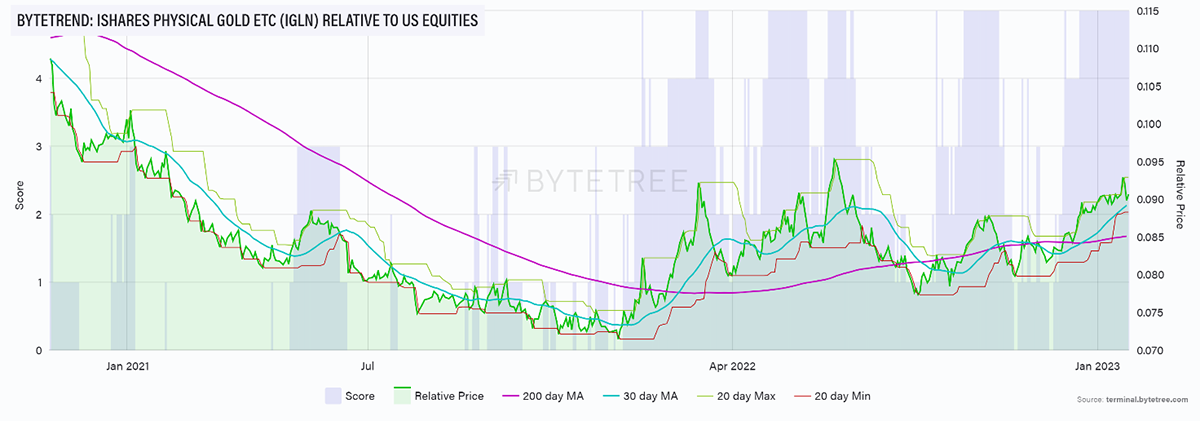
Source: ByteTree
And when we look at gold in other currencies, it’s at a new all-time high across the board, even in Swiss Francs.
Gold Around the World Sees New All Time Highs
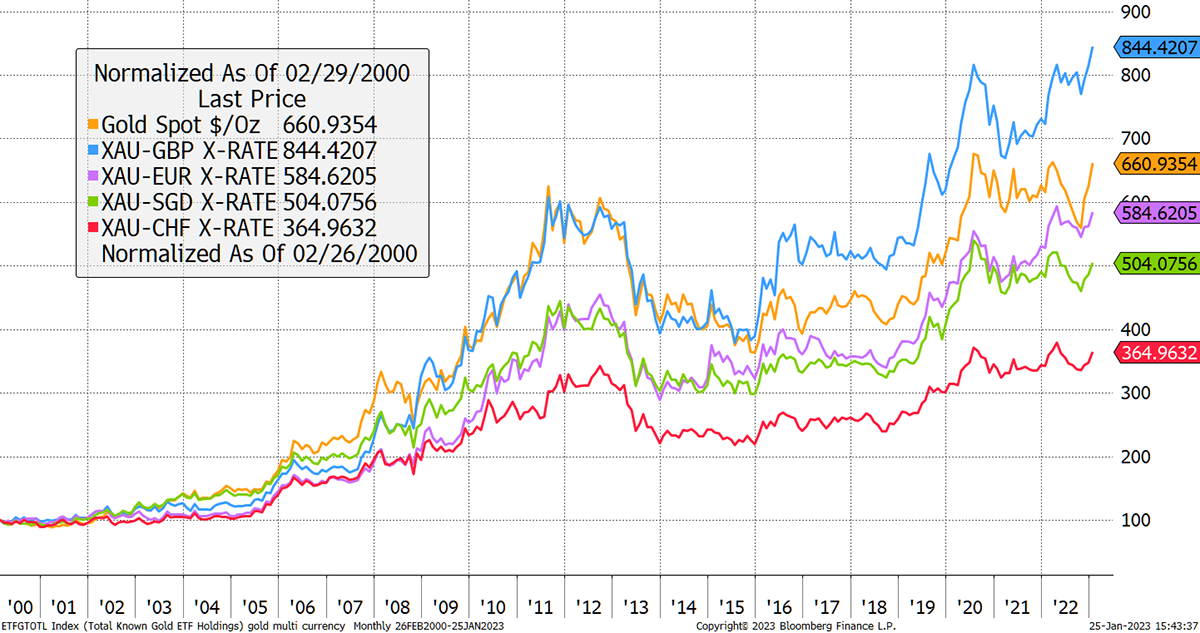
Source: Bloomberg
Notice how gold has been strong in GBP, which has been the weakest currency shown. Until Brexit, the pound was a bit like a dollar. The euro too used to match the Singapore dollar, but alas, that has broken too. There’s no decent fiat money these days – even the Swiss know that.
M2 or CPI?
The gold premium to TIPS is a relationship I have been following for over a decade. It tells you that gold is currently 33% rich versus 20-year TIPS. In recent issues, I have been asking why, and the answer keeps coming back to the central banks, who keep throwing money at gold.
Gold Is 33% Rich Versus TIPS
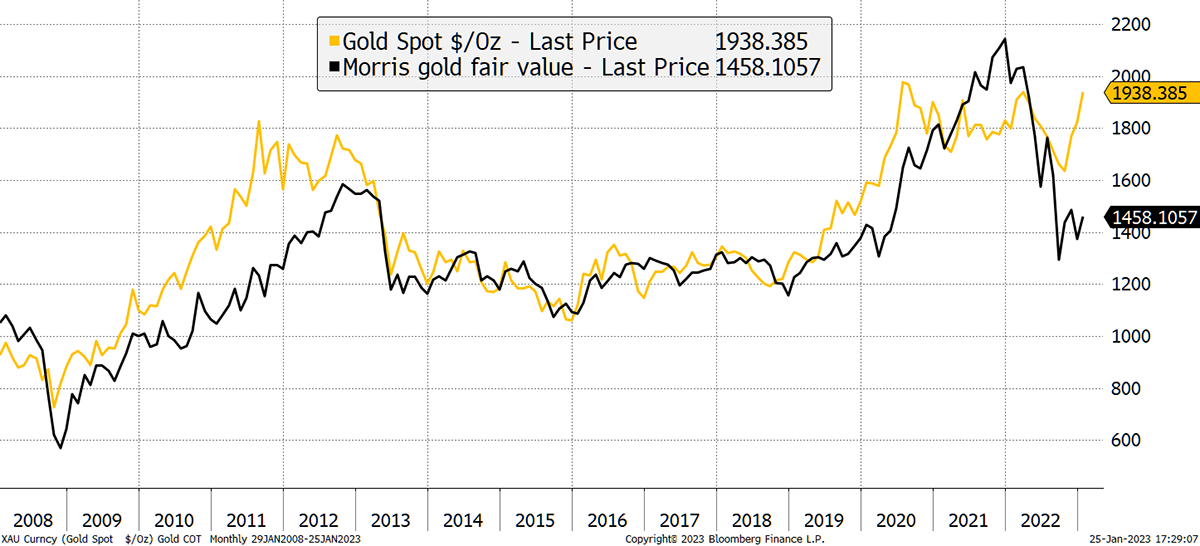
Source: Bloomberg
Last year saw the largest central bank gold purchases since 1968. That has certainly held up the gold price and has managed to offset the selling pressure by institutional investors.
The alternative thesis is that TIPS are understating inflation expectations. TIPS say 2.4% per year until 2043 (on average), while gold implies 3.1% (and rising).
I published the above chart on Twitter, and @StocksFormula cried foul. It’s all about M2 (US money supply) rather than inflation. It’s hard to ignore that because it fits so well over time. Better yet, gold has a 40% upside to catch up with M2 since 1960.
Money Supply or Inflation?
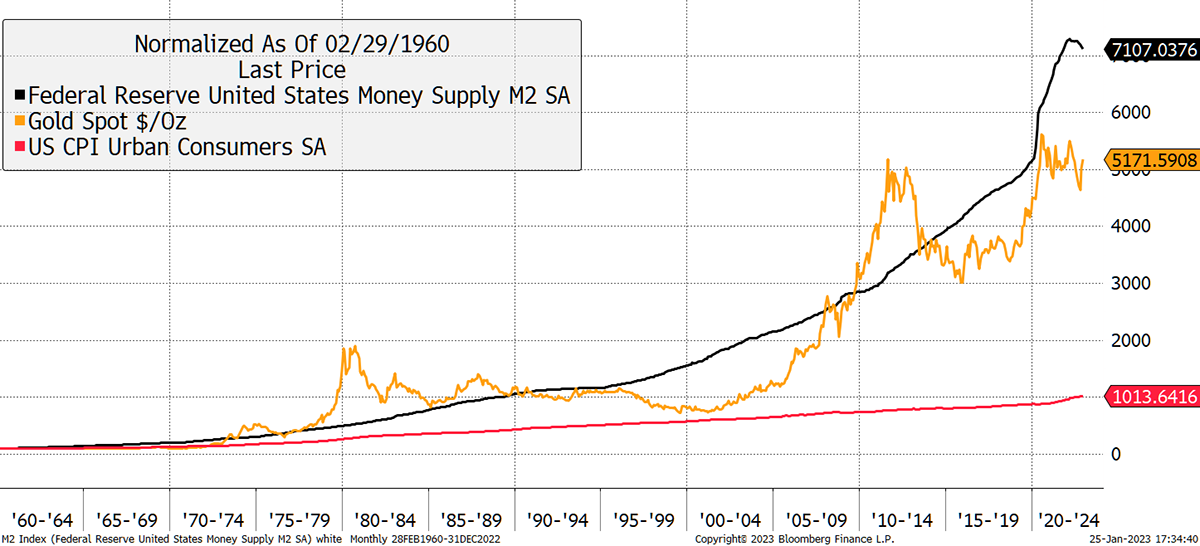
Source: Bloomberg
But over the very long-term, we know it’s inflation because that’s the concept behind the “golden constant” coined by Roy Jastram. And we also know the surge in the money supply is something that began when gold came off the gold standard in 1971. And let’s not forget; the money supply and inflation are closely linked.
The money supply is supposed to grow in line with the economy, which would see the black line below go sideways. But in recent years, it has grown much faster, and the real price of gold (gold less inflation) has broadly reflected this. Although choppy, there are some interesting relationships here.
I like the way the real gold price surged in the late 1980s only to fall back when the excess money supply failed to follow. They both collapsed in the 1990s, when the excess money supply eased back, only to surge since 2000. In 2011, gold was ahead of itself, just as it was in 1980. Today it is in line, but the money supply is falling, which isn’t necessarily supportive. Presumably, that won’t last as the Fed will have to buckle it and pivot.
Excess Money Supply and the Real Gold Price
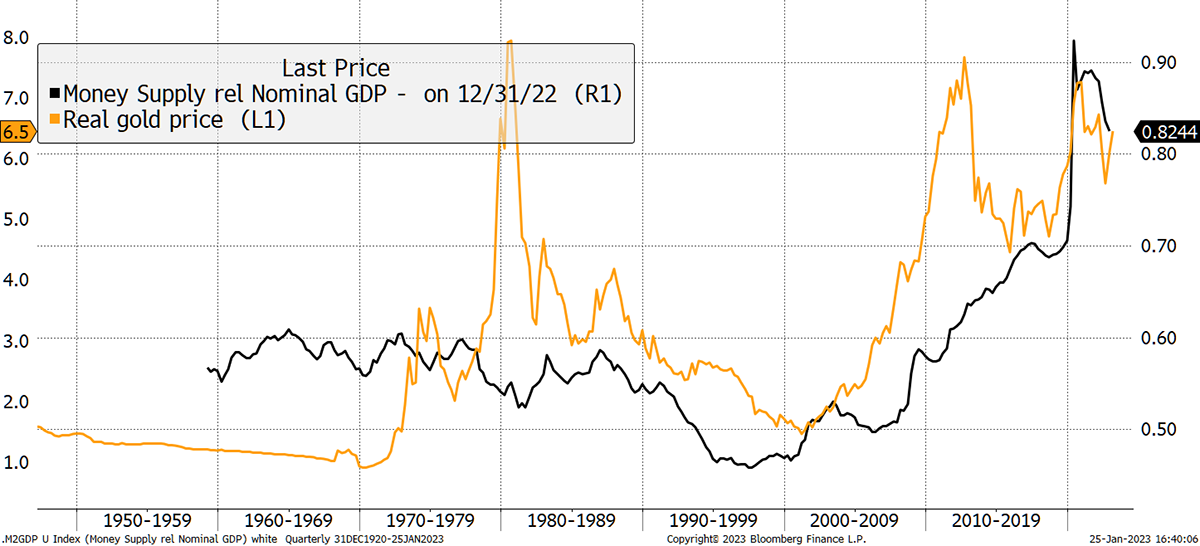
Source: Bloomberg
But rather than looking at gold and the money supply, here is the above ground gold supply (valued in US dollars) against the US money supply. The post-1975 average has been 51%, and it currently reads 58%. When comparing the gold price to the money supply, should we not count the additional supply that has been mined over the years? Just a thought.
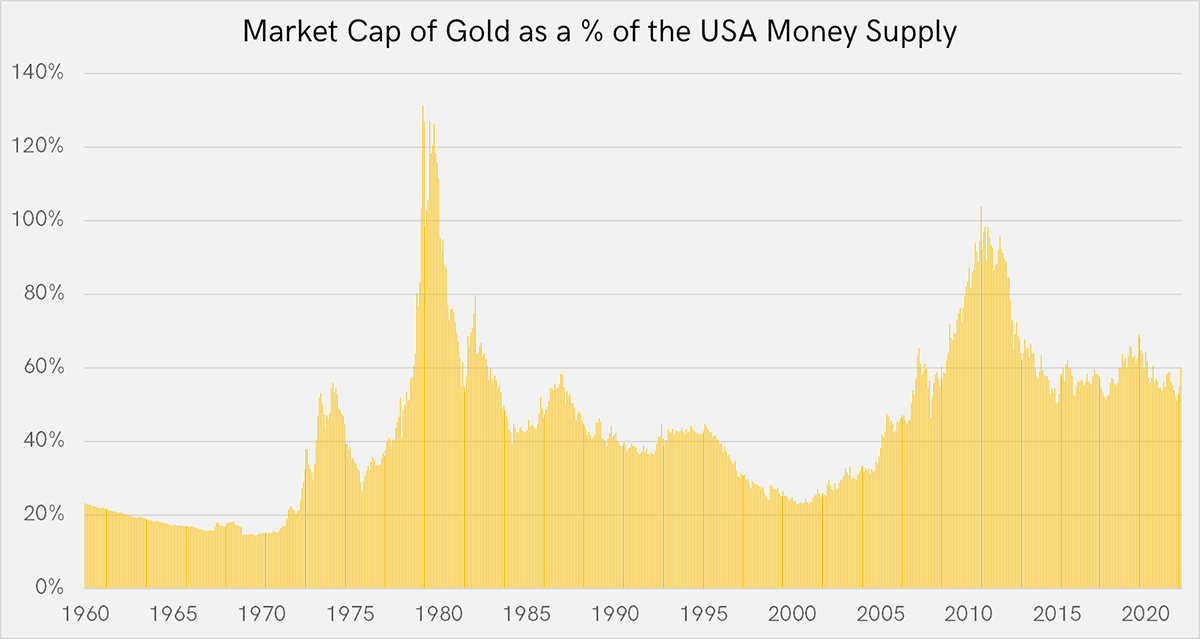
Source: Bloomberg, World Gold Council, Atlas Pulse, Fed
Since 1975, the world’s gold supply has grown by 150%, which makes a difference. To simply use the gold price equates to the assumption that the gold supply hasn’t risen at all.
In bitcoin, supply is at the centre of the conversation, probably because, until recently, it grew so quickly. Today annual growth is 2%, which is about the same as the new supply of gold. Yet in April 2024, bitcoin’s new annual supply will fall below 1%, which, for the first time, will make it scarcer than gold.
I mention it because the techniques we have used to better understand bitcoin can be applied to gold.
The Value of Liquidity
The London Bullion Metals Association (LBMA) is gold’s trade body that manages standards and publishes data. The LBMA gold value traded is the equivalent to on-chain data in bitcoin, as it represents real transactions in physical gold. This differs from futures volumes, which may not directly impact the physical market.
I have smoothed the LBMA gold value traded over 4 months and overlaid it with the gold price. There is quite a fit. Some of this is circular, as there is bound to be a fit when both series include the price, but not all.
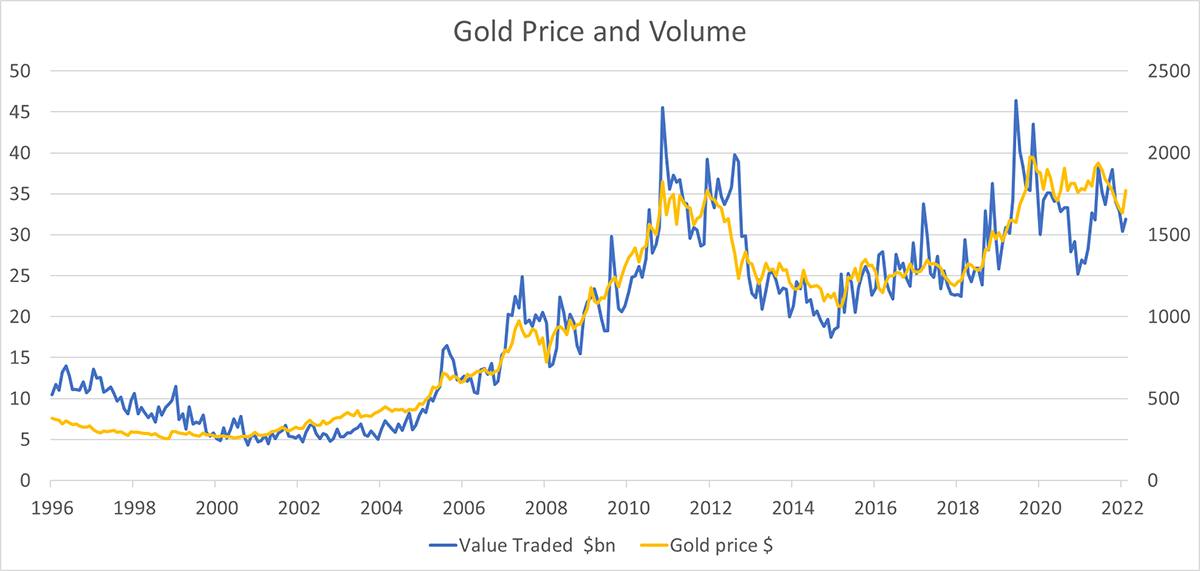
Source: LBMA
The point is that value traded is not just a function of price. Liquidity also changes, and more importantly, it has value. Have no doubt that the gold price would be lower if it wasn’t a highly liquid monetary asset. If you doubt that, then ask why liquid blue chip stocks and bonds trade at a premium to less liquid, but similar, equivalents.
Party like It’s 2010
Just as bitcoin has an NVT ratio, which looks at the network value (market cap) against the transaction value (on-chain transaction value), I have done a similar exercise for gold. This is a simple “liquidity valuation”, and as expected, gold is most liquid at times of exuberance, such as in 2011 and 2020. I show that against my TIPS fair value model.
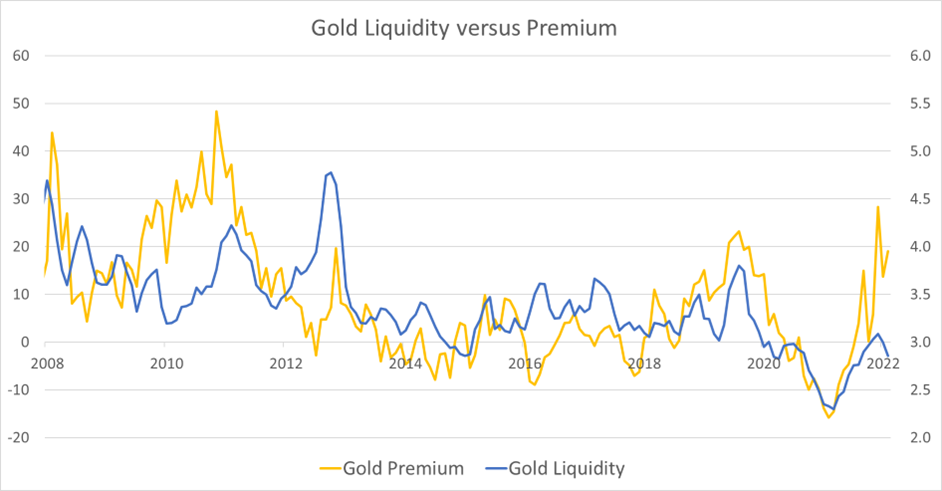
Source: LBMA, Bloomberg, ByteTree
The correlation isn’t bad, and much higher than I expected to see. It shows the link between liquidity and value. If gold ceases to be liquid, it ceases to be as valuable. In that regard, it is just like bitcoin, and more people need to understand this.
It is irrational to love gold and hate bitcoin on purely financial or economic grounds. You might disapprove of bitcoin’s environmental impact or have doubts about the technology or infrastructure, but the economics between gold and bitcoin have much in common. That statement will become increasingly obvious over the coming decade.
What’s interesting this time is that gold is exuberant against TIPS but, at the same time, light on hype. Should we be partying like it’s 2010 when gold bolted from $1,100 to 1,900?
If you think real rates have peaked, yes, we should.
Heading south
Institutional investors don’t believe in this gold rally. We can be sure of that because they aren’t buying the gold ETFs. The risk to gold is that real rates are high, and if they keep rising, and stay high, then gold is in big trouble.
It all comes down to the Fed and their friends around the world. If they keep hiking rates while inflation cools, the real rates stay high, and gold will see a repeat of 2013 when the price slumped. Institutional investors think this is going to happen because they believe everything the Fed says as they are paid to do so.
But real rates are already high, and it is hard to imagine them much higher than they already are. Either a cooling of the hikes, or more stubborn inflation than expected, would see real rates fall and gold surge.
Real Rates Are Heading South
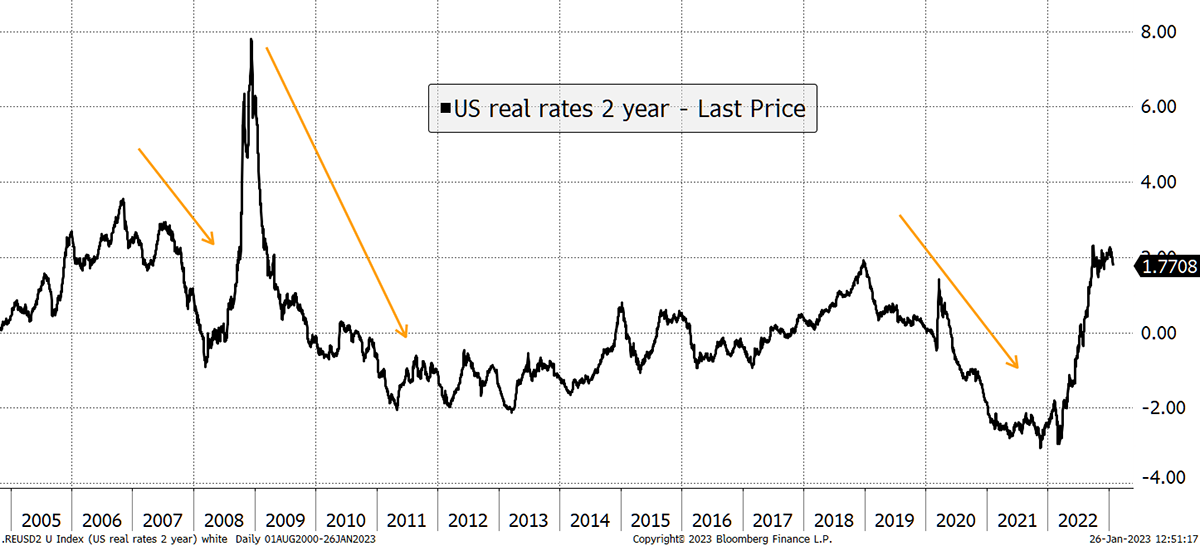
Source: Bloomberg
Having considered all the options, the bulls have it. But that doesn’t mean it isn’t wise to take advantage of cheap TIPS while you still can.
Summary
In the 25 years that I have followed gold, I have never seen a time of such high uncertainty combined with so little interest in gold. We have come through a brutal bear market in 2022, where both bonds and equities collapsed. Yet still, the institutions look to Davos for more of the same while they shun gold. I think they’ve lost the plot.
The Fed meet on 1st Feb (Wednesday), and then we get US CPI on Valentine’s Day. How romantic.
