


ATOMIC 69
Bitcoin has long been correlated with equities, but this year, it is off the scale. The hope is that it starts to fall, but we live in hope.
ByteTree ATOMIC
Analysis of Technical, On-chain, Macro, Investment Flows and Crypto.

Highlights
| Technicals | Crypto breadth slows in BTC |
| On-chain | What are the miners up to? |
| Macro | Those bonds make bitcoin look stable |
| Investment Flows | Bitcoin steady, ETH weak |
| Cryptonomy | Crypto tokens with use cases |
Technical
By Charlie Morris
BitDAQ, bitcoin in NASDAQ, holds 3-stars. This relative resilience in the face of carnage in TradFi (traditional finance bonds, equities etc.) is starting to look credible.
BitDAQ holds firm
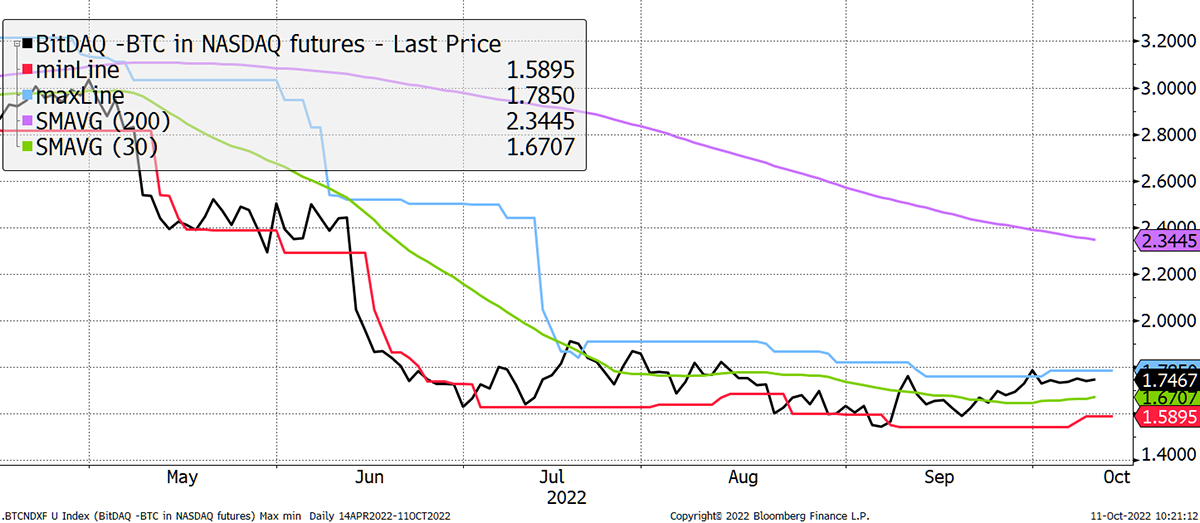
Source: Bloomberg
In the first half of this year, bonds had the second phase of their bear market, yet the press only talked about bitcoin as if it were to blame. What’s changed is that bitcoin is no longer the fall guy, and I will come back to this in the macro section.
Crypto breadth is deteriorating. Our crypto portfolio, ByteFolio, is 2/3rds bitcoin and Binance (BNB), which is a defensive stance. That makes sense, given that 50% of tokens are now in a downtrend when priced in BTC (red), with only 30% neutral or better. More on this in the Cryptonomy section.
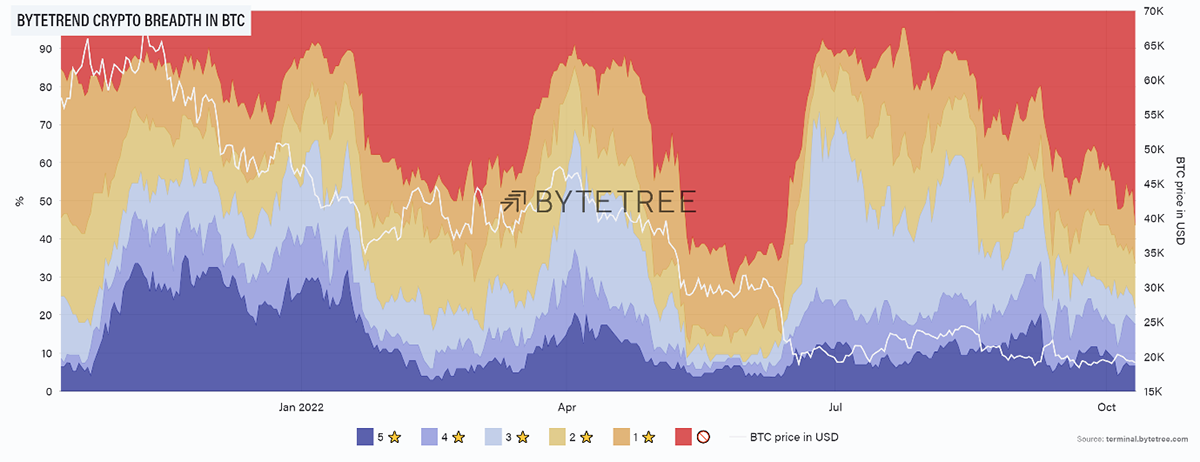
Source: ByteTree. ByteTrend breadth chart of the top 100 crypto tokens, measured in BTC, over the past year.
It would be helpful to see this improve before we can get outright bullish again.
Macro
By Charlie Morris
The carnage in bonds continues as interest rates surge. This is what the US bond market looks like, and it’s not the worst. Rather than show yields, I have shown prices. The US 30-year bond yield is 3.9%. You could buy a zero-coupon bond for $31 today that will redeem at $100 in 2052. But the harsh reality is that those who bought bonds two years ago have experienced severe capital losses.
The US bond market in prices
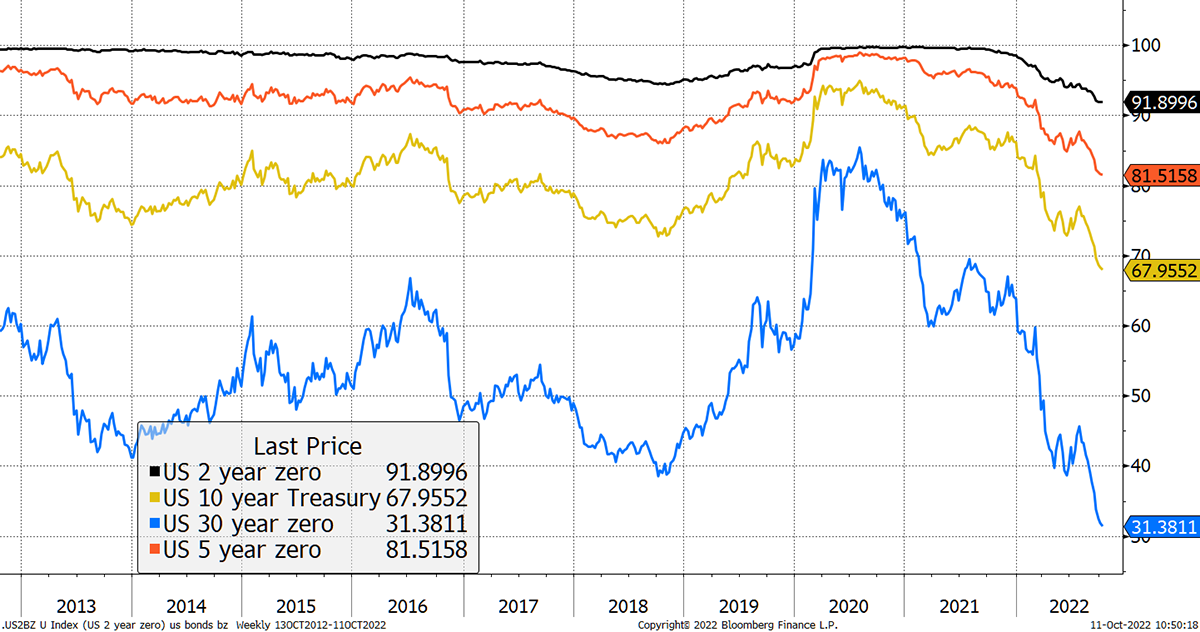
Source: Bloomberg
Bitcoin peaked on 9 November last year and is down 72%. A 30-year gilt wasn’t much better.
Bitcoin versus the long bond
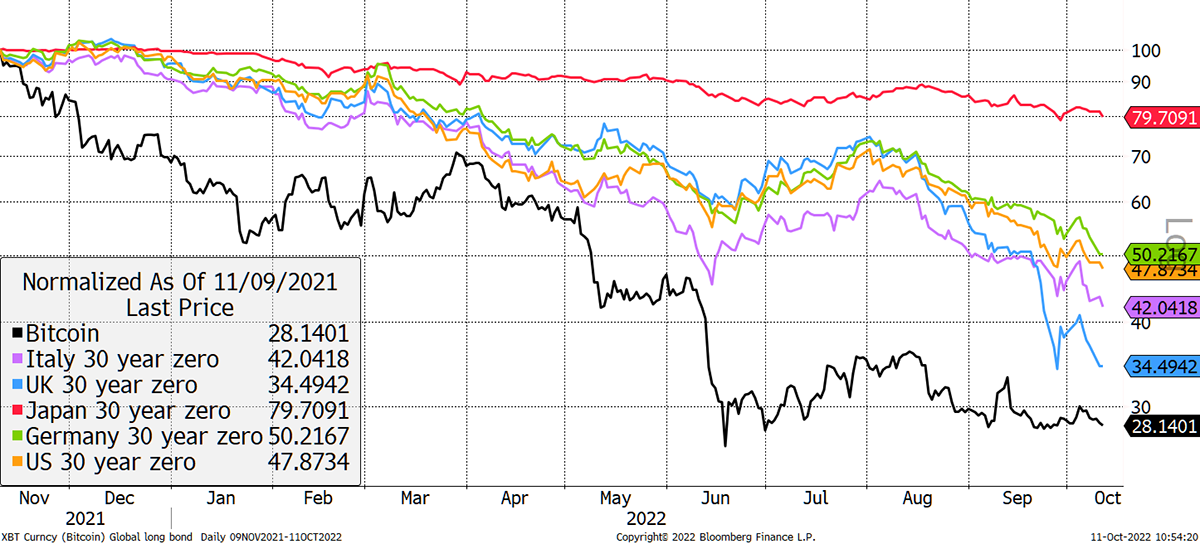
Source: Bloomberg
But you’d have been unlucky to have bought bitcoin then. In the interests of impartiality, here is the same chart since the bond market peaked on 4 August 2020, shortly after the oil price was negative and we were locked in our homes.
Bitcoin remains credible on a longer-term basis
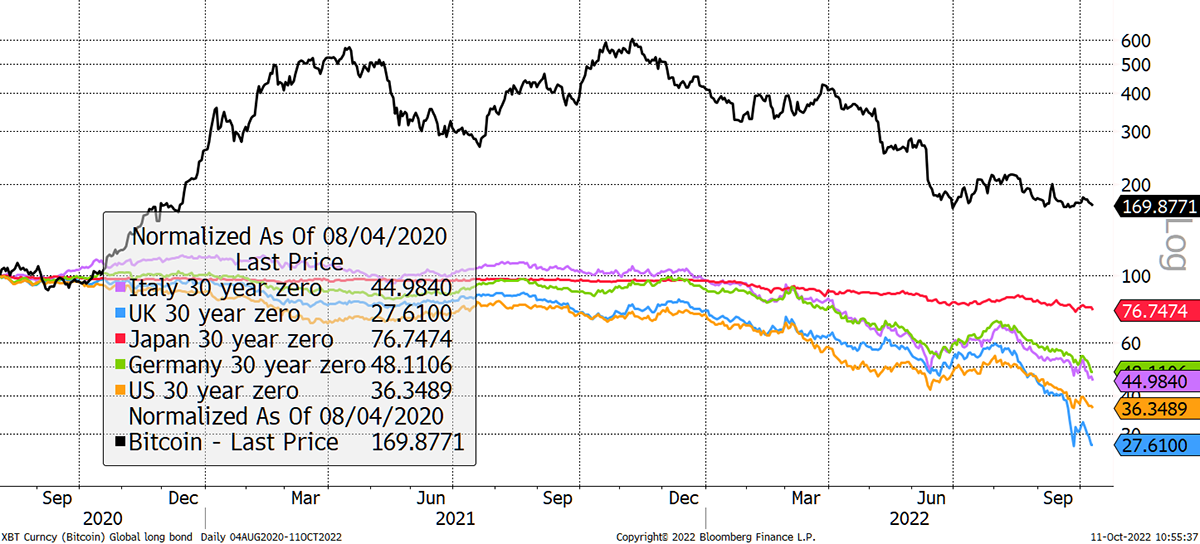
Source: Bloomberg
Provided bitcoin can find a floor, and we believe the $20k zone is underpinned by the network, the path to credibility grows.
Stocks are only marginally below their June lows while bonds keep on falling. This equity to bond relationship is seriously stretched. I was concerned at 90, and now it’s 115. Think this through, and it’s frightening to think what might happen to equities.
Equities are still ignoring bonds
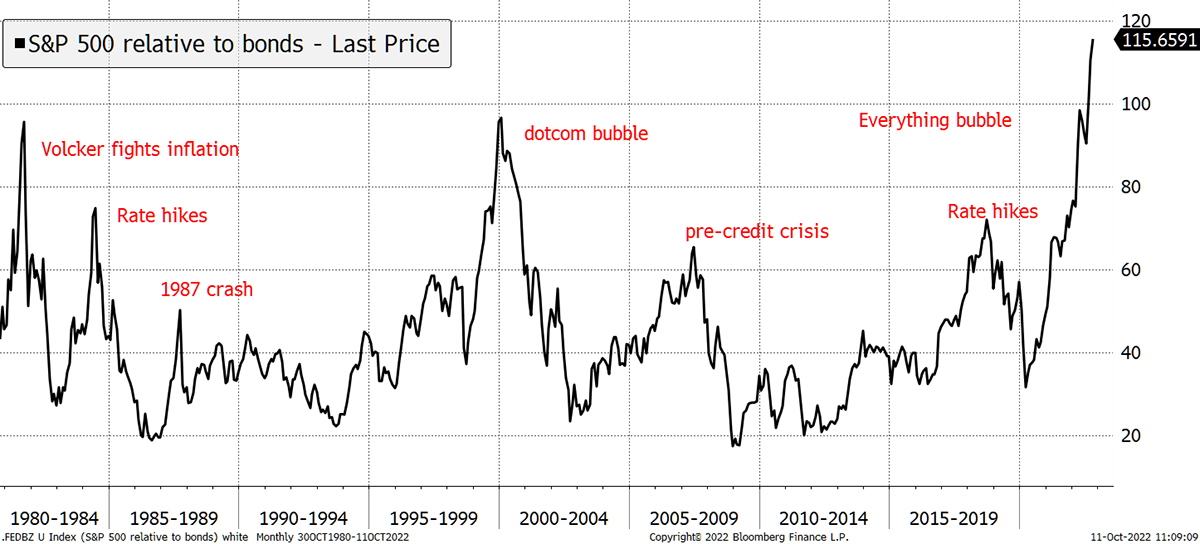
Source: Bloomberg
Bitcoin has long been correlated with equities, but this year, it is off the scale. The hope is that it starts to fall, but we live in hope.
Bitcoin and equities have high correlation
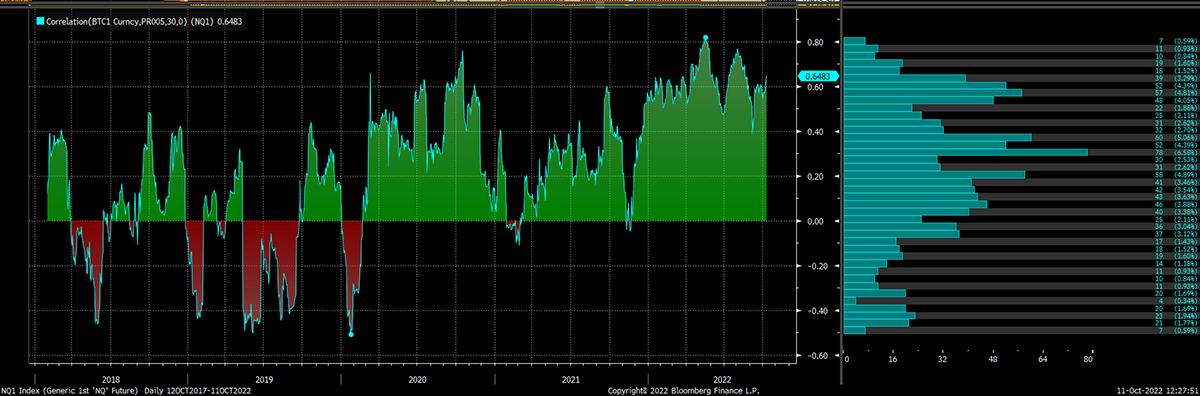
Source: Bloomberg
The almighty NASDAQ can take it no more. It just closed below 11,000, and as it breaks, BitDAQ has an opportunity to shine. Will it? I can’t be sure, but just falling less would be a positive result.
NASDAQ breaks a 0-star trend
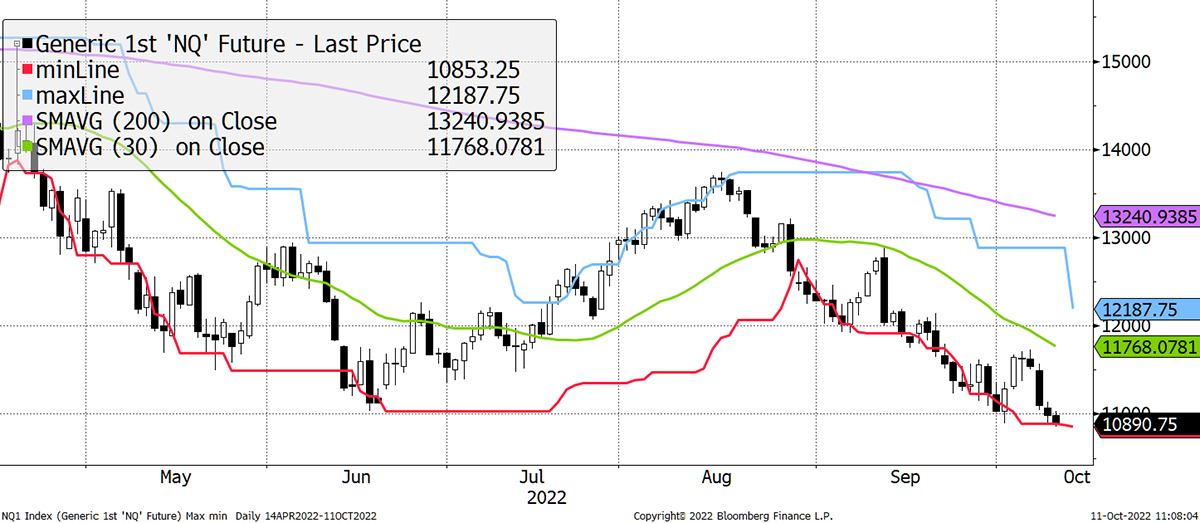
Source: Bloomberg
US monetary policy is too tight, and you have to assume that the Fed will pivot. Until they do, markets will make their life difficult.
Expected inflation has already come down, according to TIPS prices (which may well be wrong), but we will find out on Thursday when they next publish inflation numbers.
Inflation has been cooling
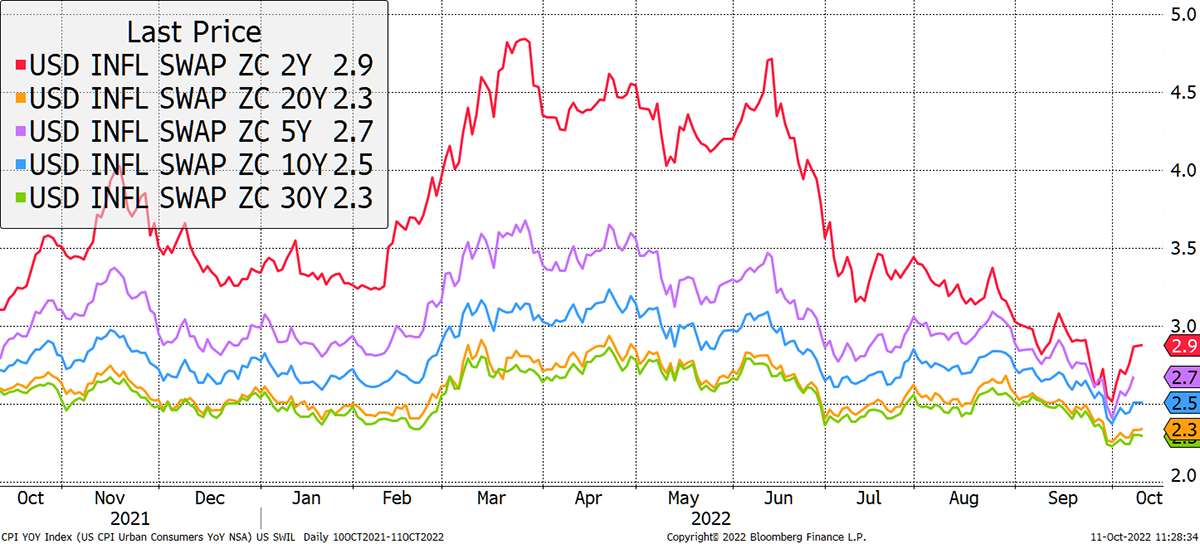
Source: Bloomberg
James Ferguson, from the Macro Strategy Partnership, has a theory that CPI can be forecast using the year-on-year change of a basket that is 50% oil and 50% gold. If so, inflation is already behind us. Not a bad record and plausible.
The battle against inflation might have already been won
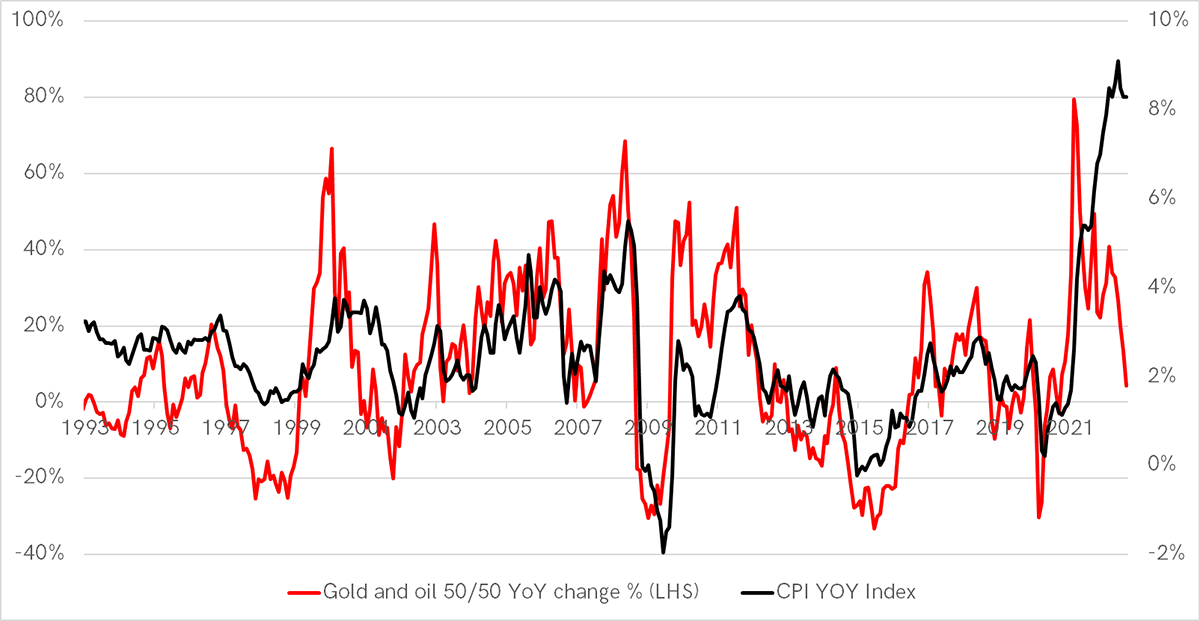
Source: Bloomberg
On-chain
By Charlie Erith
The Network Demand Model remains bearish, with the score standing on 1/6. Activity over the network remains subdued.
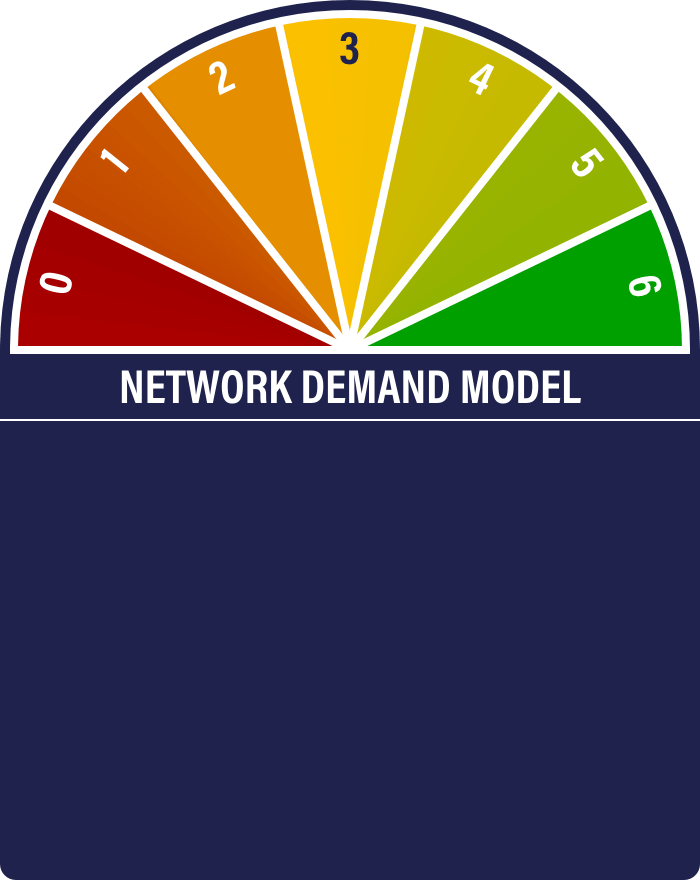


Transaction value and fees are down at year lows, and even the numberof transactions is wilting. It’s not a happy picture.
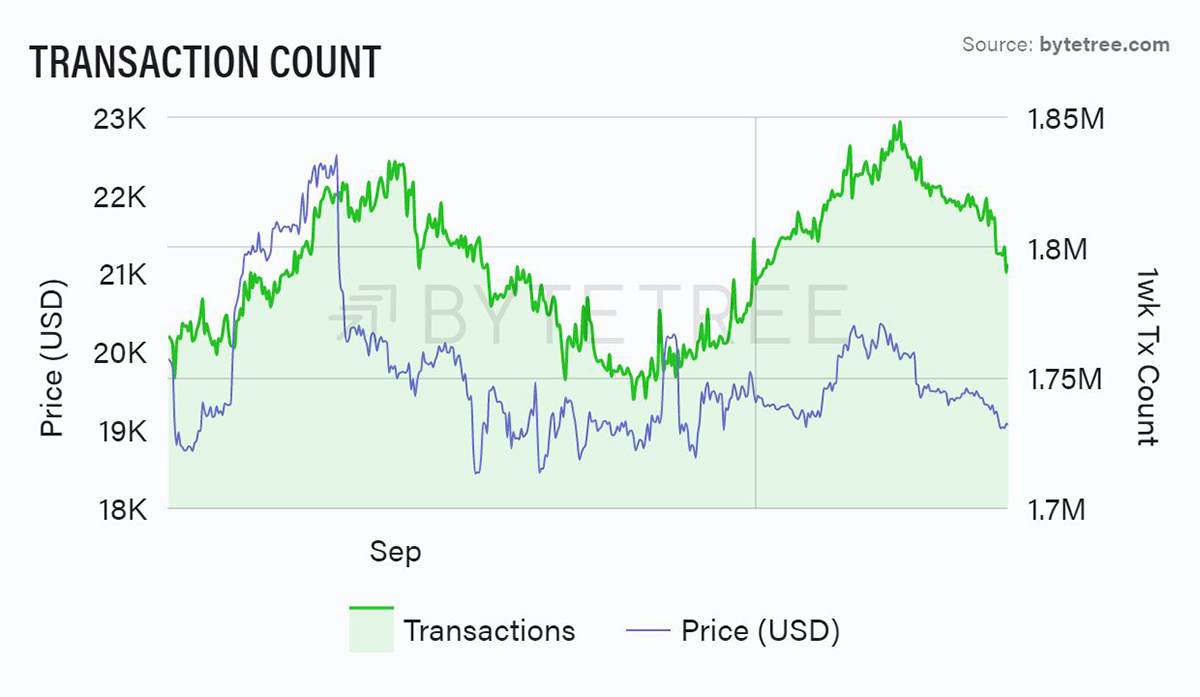
Source: ByteTree. The number of bitcoin transactions (green) and bitcoin price (blue) in USD, over the past 5 weeks.
This makes the behaviour of the miners both counterintuitive and somewhat unsettling. Block time has collapsed, and thus generation has soared (see Generation chart below). This tells us that the miners continue to throw huge resources at this market at a price level where one would have thought they’d be tiptoeing away and waiting for better times (particularly given the general level of energy prices). As a result, “difficulty” has jumped sharply – again – to new all-time highs (see below).
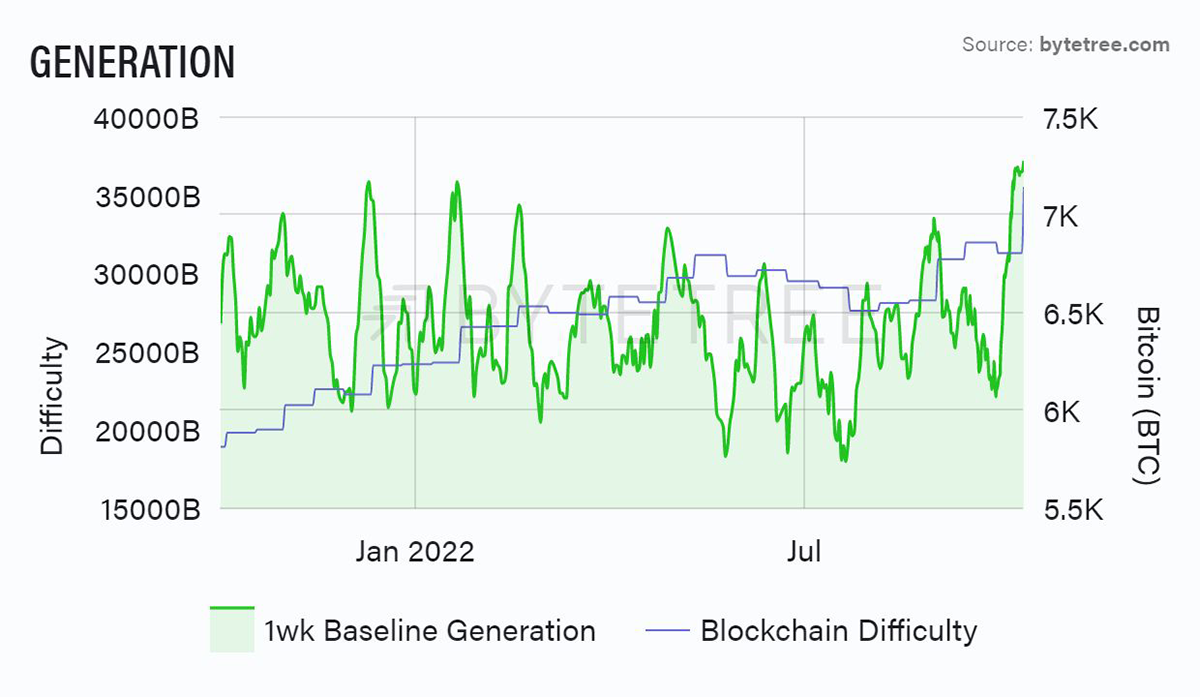
Source: ByteTree. New bitcoin generation (BTC) and blockchain difficulty over the past year.
So far, the miners appear to have had little difficulty finding buyers for all the fresh inventory over the last few weeks, as shown by the correlation of 1st Spend with Generation (see 1st Spend chart below). That said, problems will arise if the source of that buying dries up. Then we would see a build-up of miner inventory (Inventory chart, below) which is already some way off August lows. Given the low bitcoin price, high energy costs and falling fee income, it stands to reason that miners would be forced sellers into a weak market.
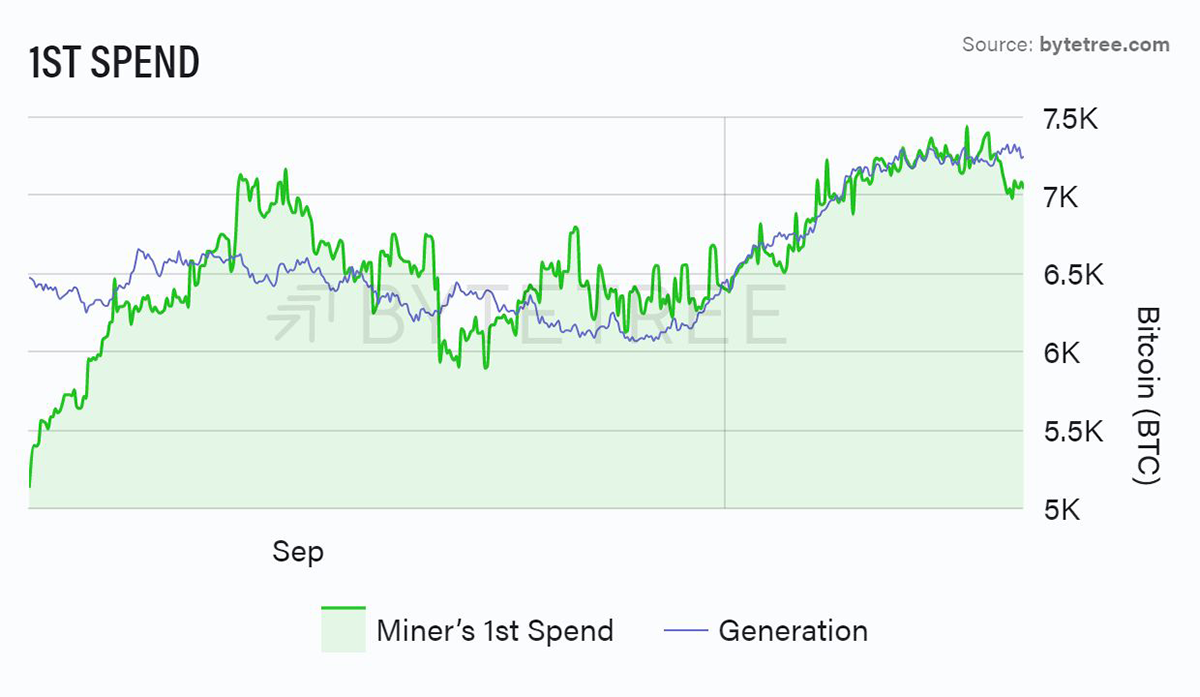
Source: ByteTree. New bitcoin supply entering the market (i.e. Miner’s 1st Spend) and generation of new bitcoins over the past 5 weeks.
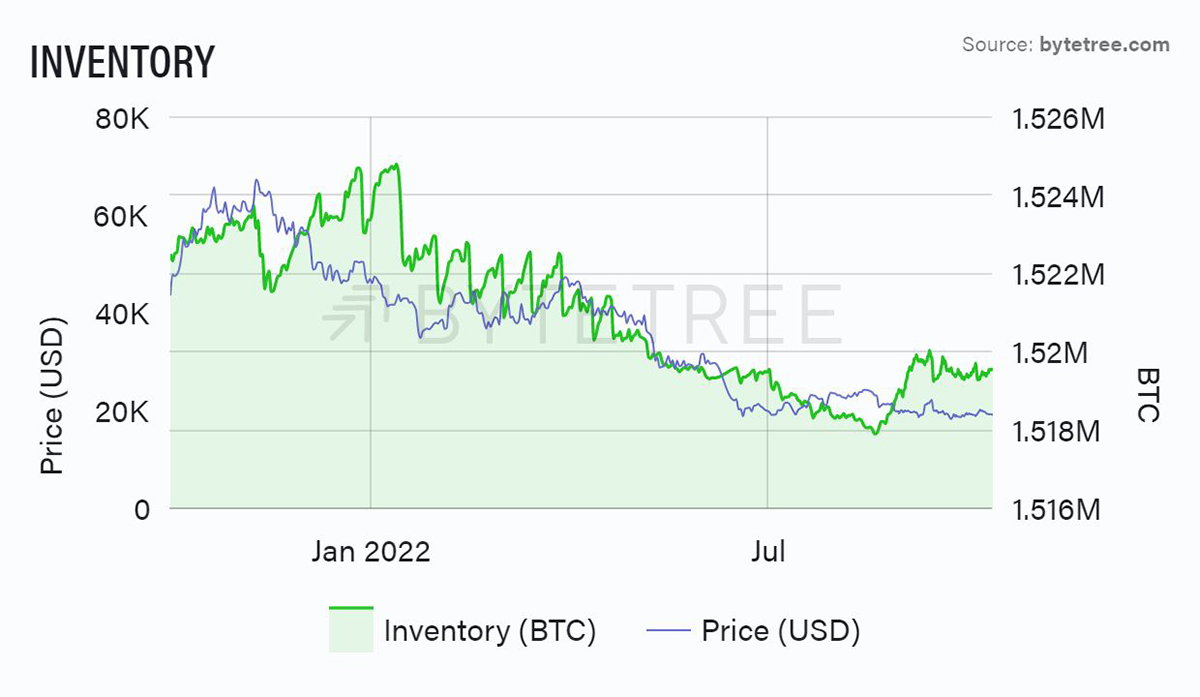
Source: ByteTree. Bitcoin miner unspent BTC inventory and bitcoin price (USD) over the past year.
Bitcoin needs a catalyst because without one, the network fundamentals point lower.
Fund Flows
By Charlie Erith
Bitcoin owned by the ETFs we track has mildly grown. In a risk-off environment, this is encouraging.
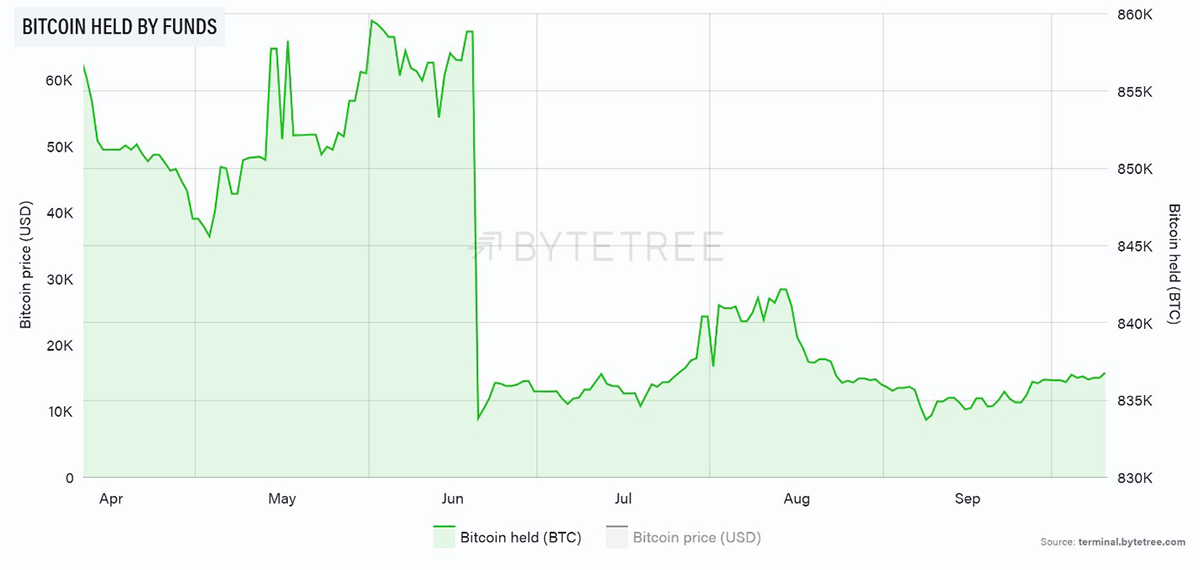
Source: ByteTree. Bitcoin ETF flows (BTC) over the past six months.
Ethereum ownership continues to sag, however, with the hangover from the successful Merge lasting longer than most commentators expected.
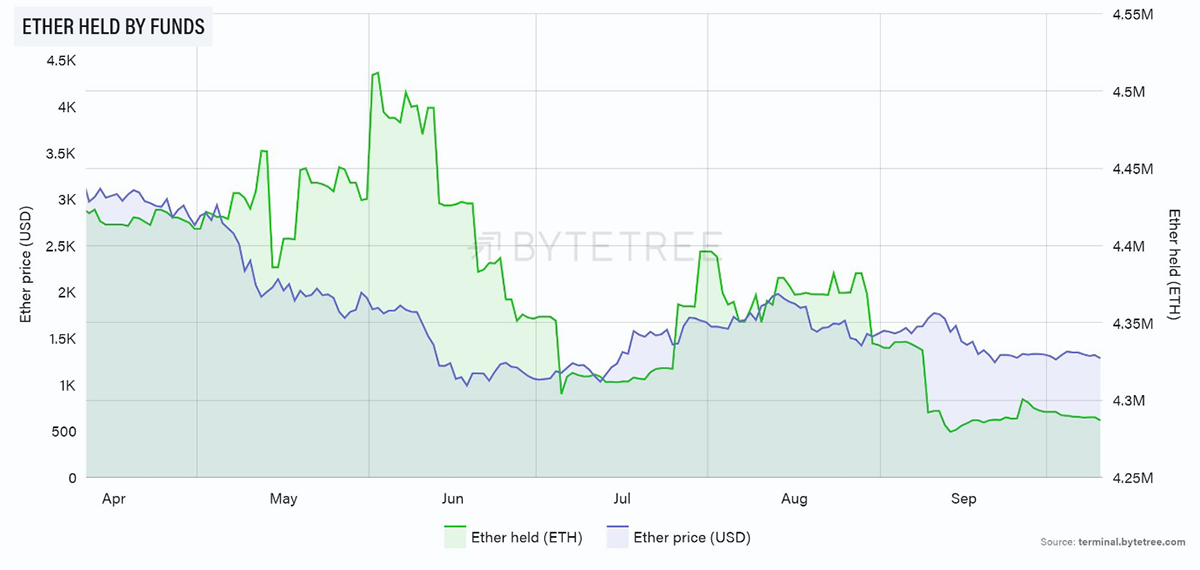
Source: ByteTree. Ethereum ETF flows (ETH) and the price of ETH over the past six months.
Cryptonomy
Cryptonomy will henceforth draw observations from ByteTrend, which is a fabulous trend-following tool to:
a) look for new crypto ideas
b) act as a warning signal
I encourage all subscribers to play around with it. Remember, it’s all about Relative Strength. Long-term winners outperform their peer group, much as the strongest runner in a marathon gradually draws away from the crowd. Technology is a “winner takes most” space, as exemplified by the performance of the FANGS stocks over the last 15 years. The best thing we can do, therefore, is to identify the long-term winners early…and then stick with them. This is how we think about ByteFolio, of course, which is published on a Monday.
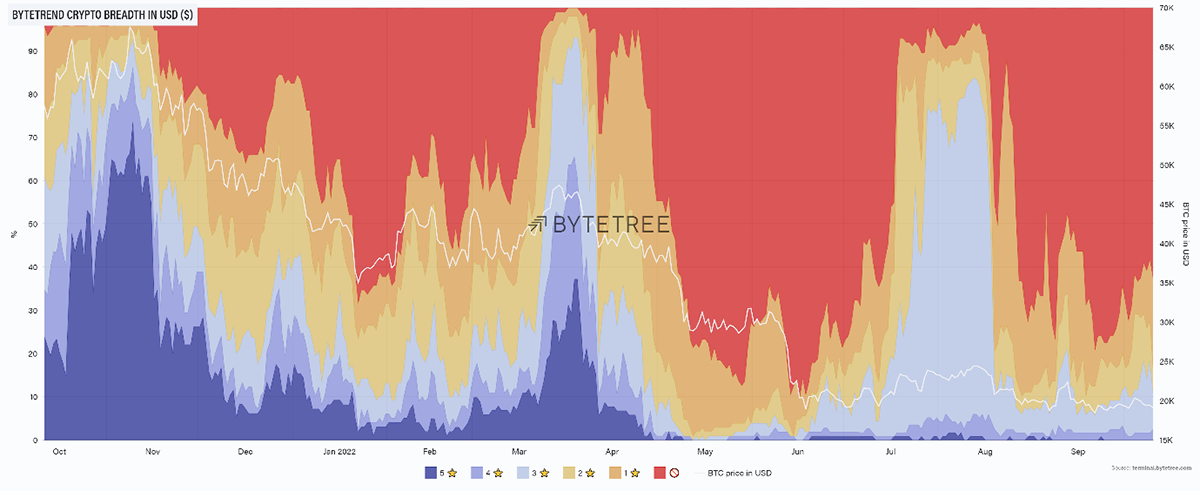
Source: ByteTree. ByteTrend breadth chart for the top 100 crypto tokens, measured in USD, over the past year.
In a sign of the times, there are zero 5-star trends in the top 100 tokens when measured relative to the US$ (above chart). This shows just how down on its knees the sector is. We have three, however, that are on 4-star trends. The first is Quant (QNT), the second is Ethereum Name Services (ENS) and the third is Chrono.tech (TIME).
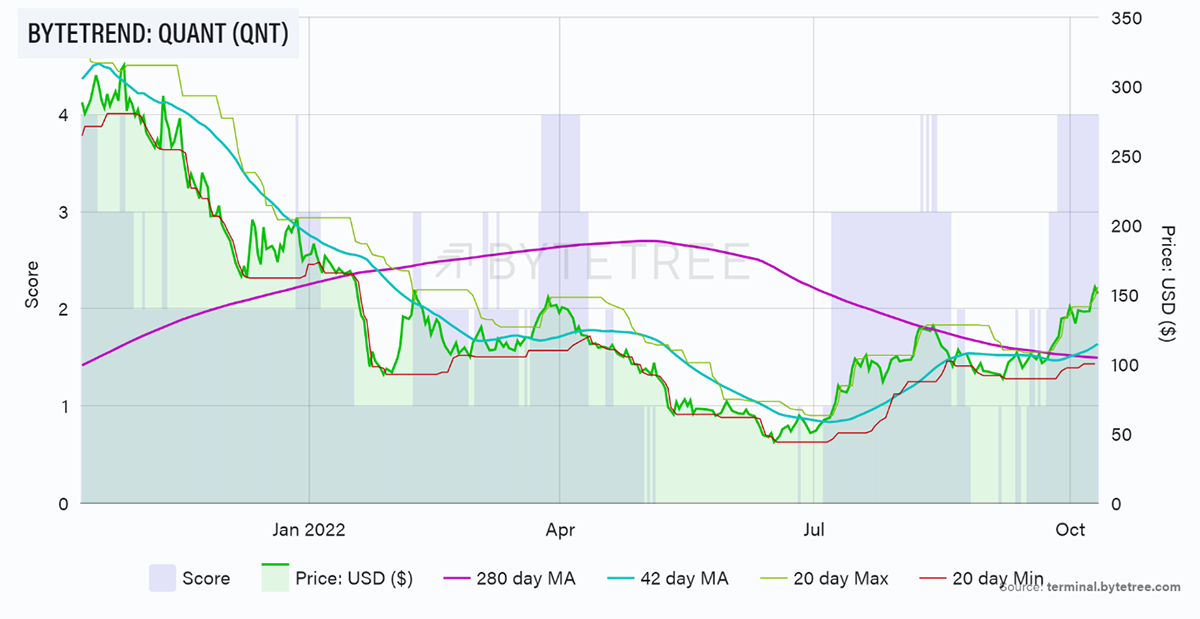
Source: ByteTree. ByteTrend chart for Quant (QNT), with the score in blue, measured in USD over the past year.
We’ve published on QNT and you can read the latest note hereto understand what it’s all about. The price behaviour has been very strong, particularly given the weakness in the overall market. Since bottoming in mid-July, it is up three-fold. While short-term, it appears slightly extended against trend, it won’t take much for the final star to come on. This would be the 280-day moving average moving from sloping downwards to upwards. In QNT’s case, the shift from a 2-star to a 3-star trend has been a good moment to add, while a fall from a 4-star to a 3-star trend has worked well from a profit-taking perspective.
Looking at the overall scores, it is interesting that much-heralded tokens like Ethereum’s ETH, Polkadot’s DOT (Layer-0), Solana’s SOL (Layer-1), Cardano’s ADA (Layer-1), Avalanche’s AVAX (Layer-1) and Near’s NEAR (Layer-1) are all on 0-star trends. While you typically read that blockchain infrastructure and smart contracts are the places to be, the market currently disagrees.
The relative strength in the space has been coming from tokens with a more intuitive use case, which are not necessarily blockchains. QNT, with its exposure to CBDCs, is one. But also note that Chainlink’s LINK (oracle network), Stellar’s XLM (payments), Compound’s COMP (decentralised lending), and Uniswap’s UNI (decentralised exchange), all have stars on against the US$ and have held up well in a very tough environment.
Summary
All things considered, Uptober is going well compared to the spring. Global wealth is being destroyed at breakneck speed, and Bitcoin is looking to be more like a part of the solution than the problem.

