Prepare for Uptober

Disclaimer: Your capital is at risk. This is not investment advice.
ATOMIC 65
For whatever reason, October tends to be a strong month that normally follows weakness over the preceding summer months. Thus, its nickname, “Uptober”.
ByteTree ATOMIC
Analysis of Technical, On-chain, Macro, Investment Flows and Crypto.

Highlights
| Technicals | The power of a sliding dollar |
| On-chain | Small improvement, but far short of bull |
| Macro | Dollar softens |
| Investment Flows | ETH outflows ahead of Merge |
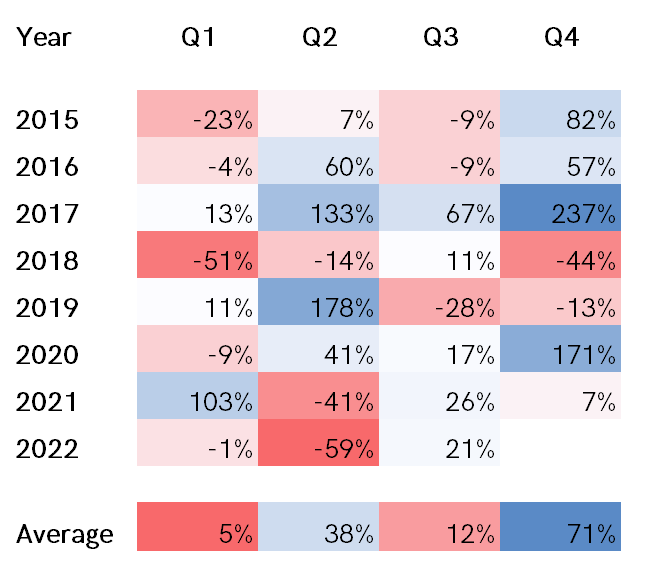
It is a strange old thing that the third quarter has consistently been weak in crypto. As always, there have been exceptions with these things, but Q3 is generally “missable”. Even in 2017, when BTC rose 67% in Q3, it was sandwiched between quarters either 2x or 4x stronger. That said, Q3 has normally been quiet (by crypto standards!), neither surging nor slumping.
Quarterly returns
Source: Bloomberg
What stands out is how Q4 has rarely been calm. While generally strong, it slumped in 2018, a year with many parallels to 2022. Yet that similarity is simply “bear market”. Has the 2022 bear done enough damage? We hope so.
Look at the months, on the other hand. What is wrong with September?
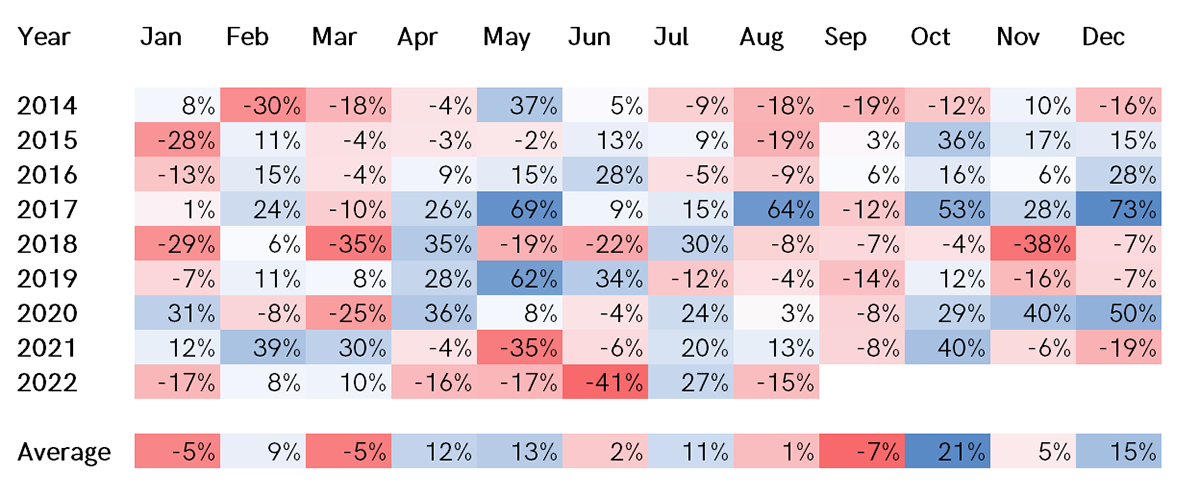
The monthly data seems to be more consistent than the quarterly. For whatever reason, October tends to be a strong month, which normally follows weakness over the preceding summer months. Thus, its nickname, “Uptober”. Let’s hope we see a repeat.
Technical
Bitcoin has jumped to a 2-star as it took out the 30-day moving average and the max.
Bitcoin 2-star
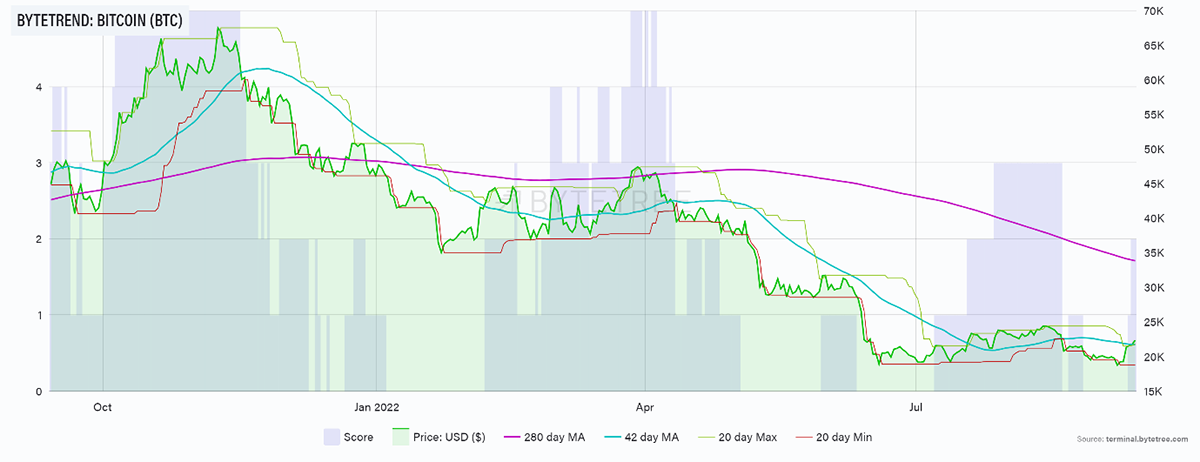
Source: ByteTree. Bitcoin (BTC) ByteTrend, in USD, over the past year.
Bitcoin has also recovered a bit of market share. We’ll cover this more in the macro section, but the breadth chart shows a recent increase in the red sky when we show ByteTrend crypto against BTC. This can obviously be for two reasons: Bitcoin rising faster than everything else (positive) or outperformance against a weakening crypto market (negative). With the heat coming out of ETH ahead of the Merge, it looks like the crypto sphere is adopting a “wait-and-see” approach, so best not to read too much into this at the moment.

Source: ByteTree. ByteTrend crypto breadth chart in BTC and BTC price in USD, over the past two years.
On-chain
By Charlie Erith
This week’s on-chain activity has carried on from last week’s signs of improvement. It’s not a massive uptick, but at least we’re travelling in the right direction. The number of transactions, in particular, has seen a healthy pick-up and is around a third higher than it was during the slump at the end of August.
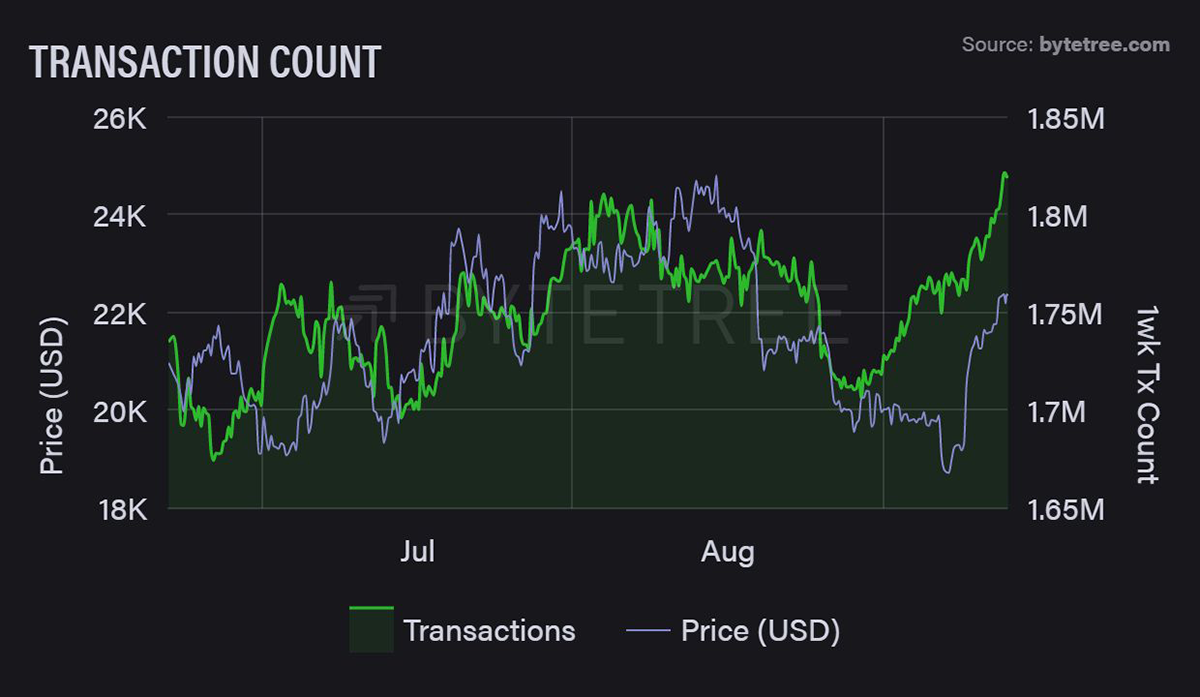
Source: ByteTree. Bitcoin transaction count and BTC price in USD over the past 12 weeks.
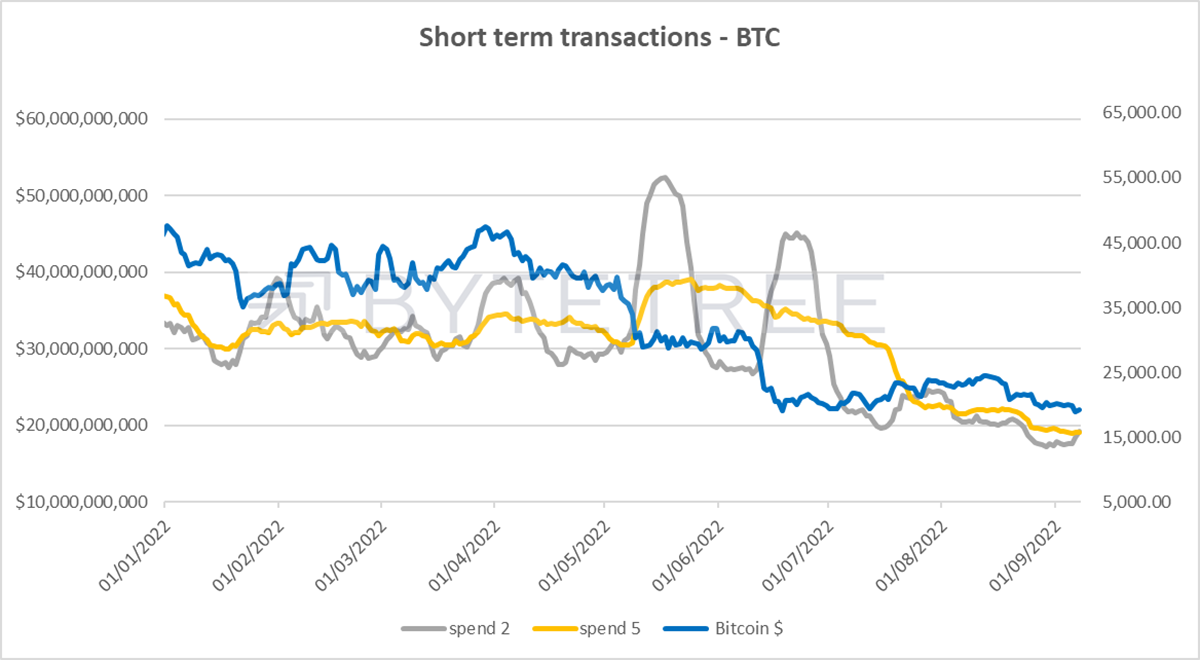
It’s good to see this. Unlike the value of transactions metric, the number of transactions contains no price information and is thus a cleaner look at network activity. As a result, it’s probably the best short-term leading indicator of the on-chain metrics, although it hasn’t been so useful for the longer term.
The pick-up in activity has seen one of the Network Demand Model signals turn back on, taking the score to 2/6.
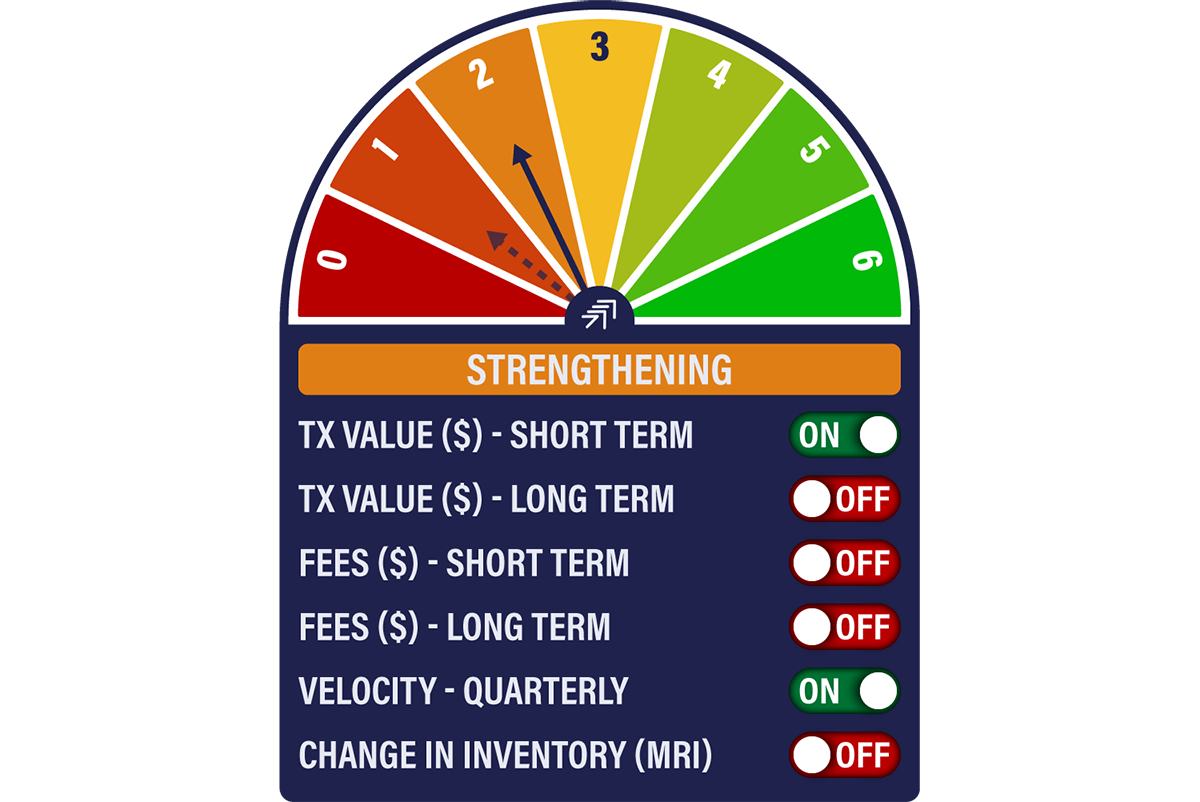
This is the short-term transaction value signal, the most volatile of all. While we have to start somewhere, and it’s a move in the right direction, don’t forget that until it reaches 4/6, the model remains bearish. It’s the long-term cycle we’re trying to capture here, not short-term moves, which is why we have a “committee” of signals.
Source: ByteTree
Institutional Flows
Bitcoin ownership in funds remains flat, with holdings largely unchanged from mid-June. There is little evidence of new investor impetus in this series.
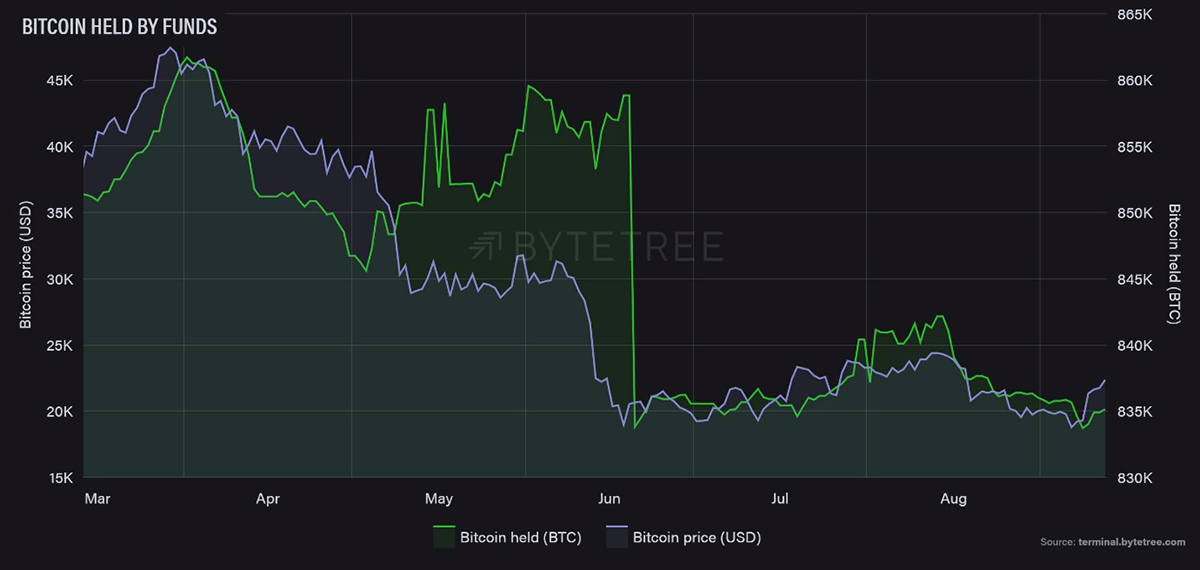
Source: ByteTree. Bitcoin held by funds (BTC) and bitcoin price in USD over the past six months.
Ethereum, on the other hand, has seen outflows. It may be that old investors are locking in recent gains ahead of the Merge, and new investors are standing on the sidelines. We will be in a better position to judge that over the next couple of weeks.
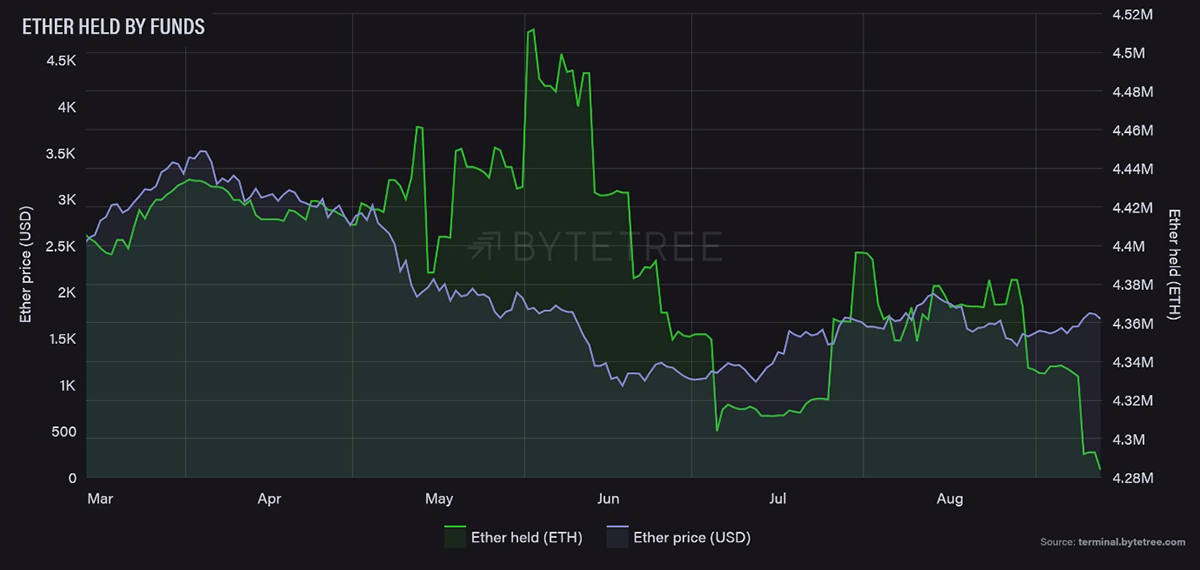
Source: ByteTree. Ethereum held by funds (ETH) and Ethereum price (USD) over the past six months.
Macro
By Charlie Morris
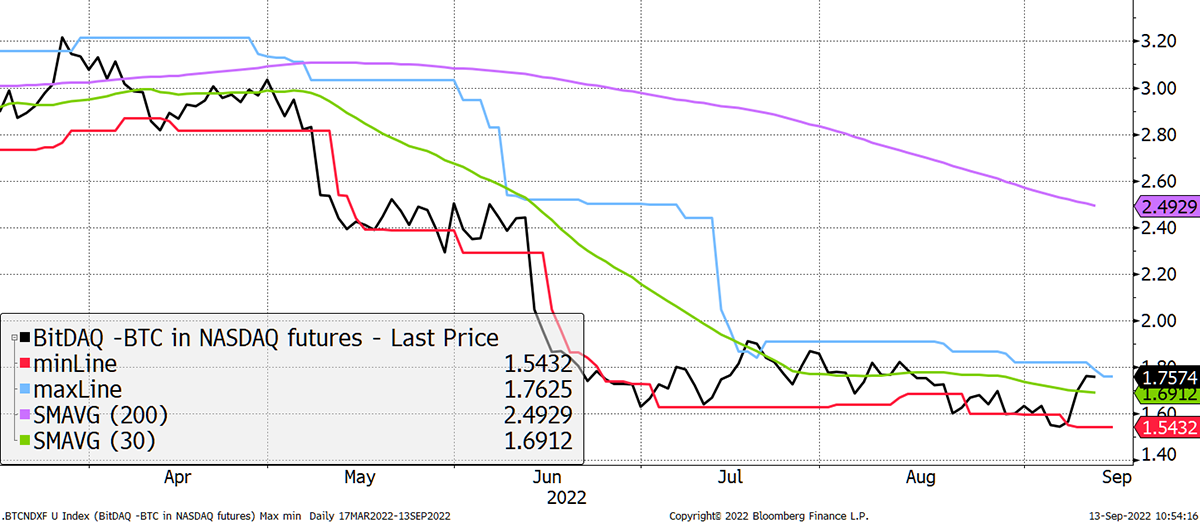
In recent months, good news in bitcoin has been hard to come by – a bit like Tom Hanks looking for ships at sea in Castaway. It feels like an eternity since BitDAQ (bitcoin in NASDAQ) last perked up, but it just happened.
BitDAQ 1-star
Source: Bloomberg
It wouldn’t take much from here to jump to 3-stars, and it could happen within a week or so. The point here is not just that bitcoin rallied but that it did much more than the NASDAQ when they both faced the same macro conditions.
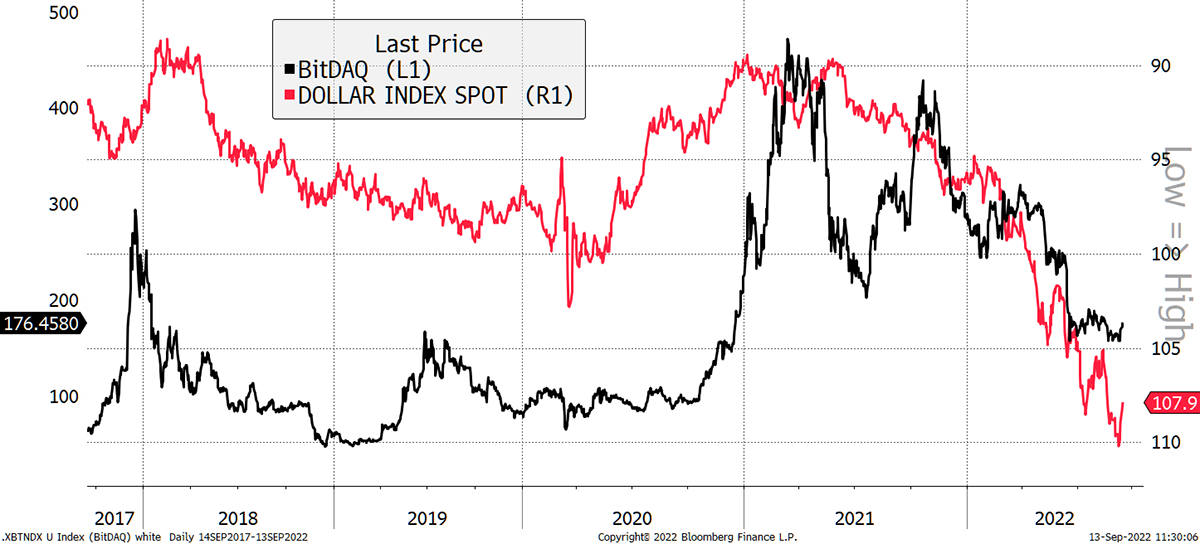
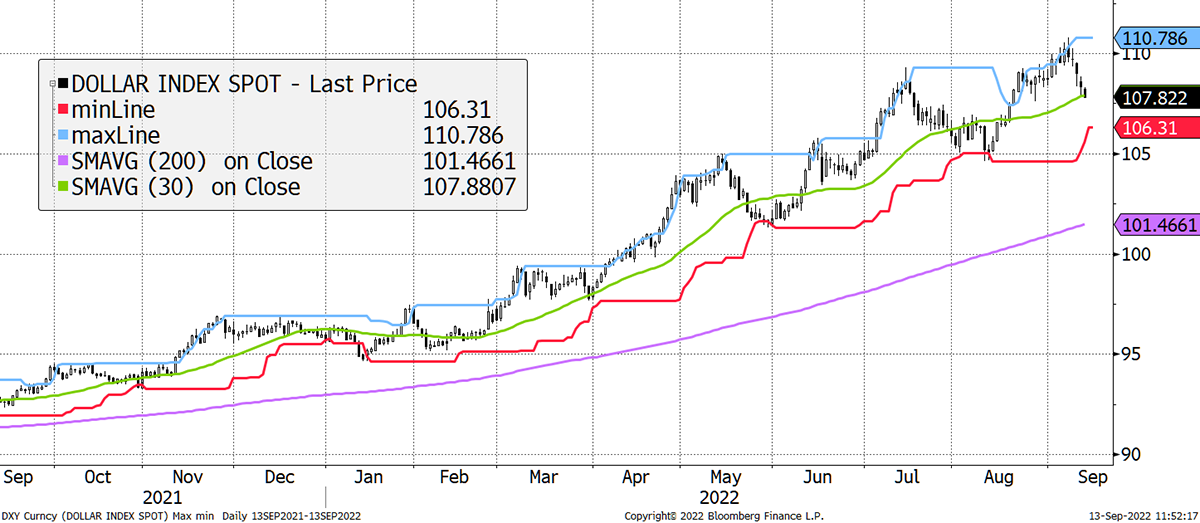
Whereas a strong dollar is a headwind for bitcoin, it’s a tailwind for the NASDAQ.
BitDAQ has followed the dollar (shown inverted)
Source: Bloomberg
But I suppose that’s just showing that a falling dollar is risk-on, at least when it comes to alternative, hard assets.
Dollar downgrades to 4-star
Source: Bloomberg
Summary
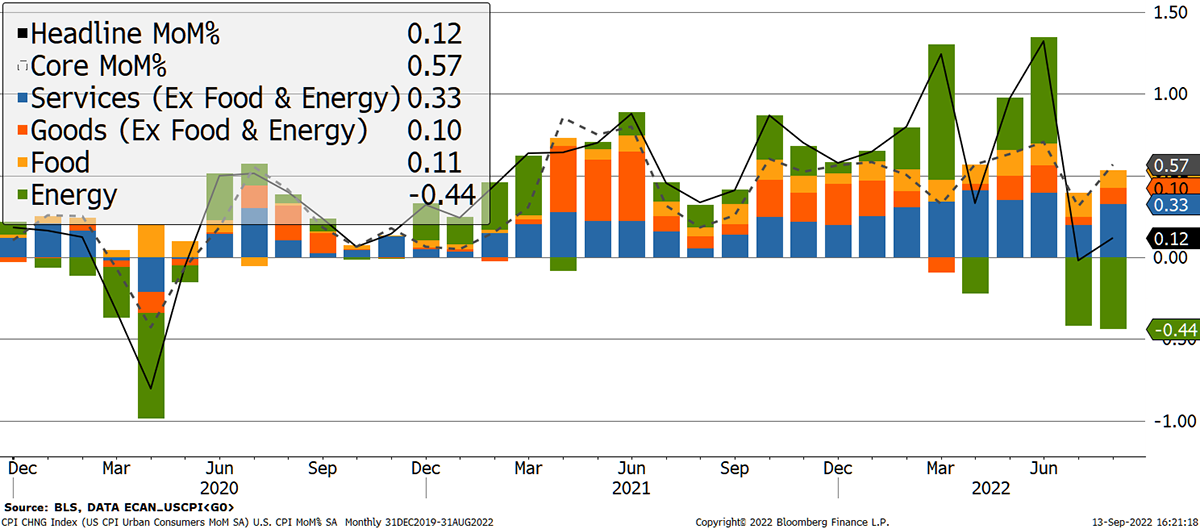
Today saw US inflation data published which refused to comply with the Fed’s wishes. Energy was down again, but services (which means wages) were up. This inflation isn’t going away. That should be good for hard assets, but not while it gives the Fed a reason to keep on hiking rates.
CPI won’t obey the Fed
Source: Bloomberg

Comments ()