

ATOMIC 62
The long-term fundamentals of this network are down but not out, and despite a tactical neutral view, we remain long-term bitcoin bulls.
ByteTree ATOMIC
Analysis of Technical, On-chain, Macro, Investment Flows and Crypto.
Highlights
| Technicals | Bitcoin back to one star |
| On-chain | Slowing network |
| Macro | China’s Renminbi falls |
| Investment Flows | Modest outflows |
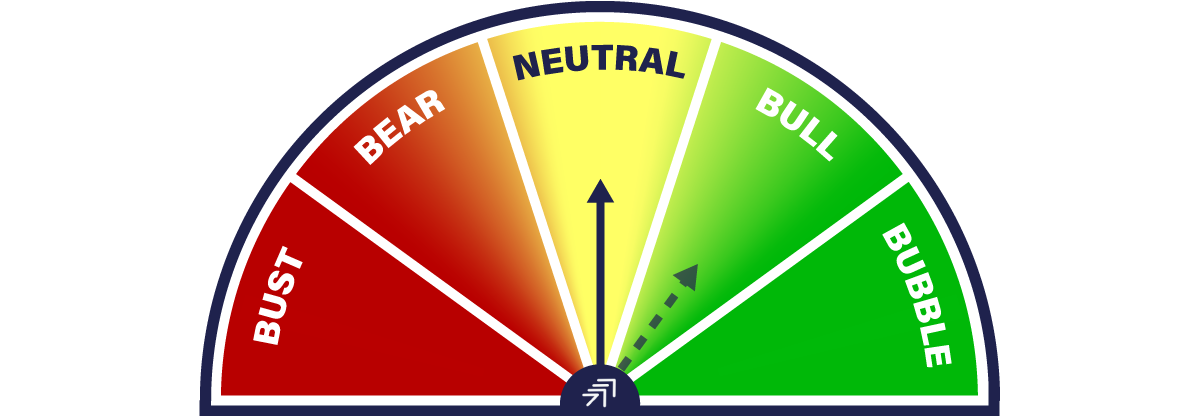
The tone of last week’s ATOMIC pointed towards neutral, yet we held the dial at bull market. Things happened quickly, and given the recent weakness in technicals, flows, on-chain, and the macro environment, ATOMIC reluctantly returns to neutral.
We find it hard to be bearish on valuation grounds. Basic network analysis from the 2018 to 2020 era saw roughly $10 billion (rhs) of on-chain transaction value each week. The current level is twice that, although softening. This comfortably equates to a price around the $20,000 level, and unless there is a serious deterioration in the network, bitcoin’s price is underpinned.
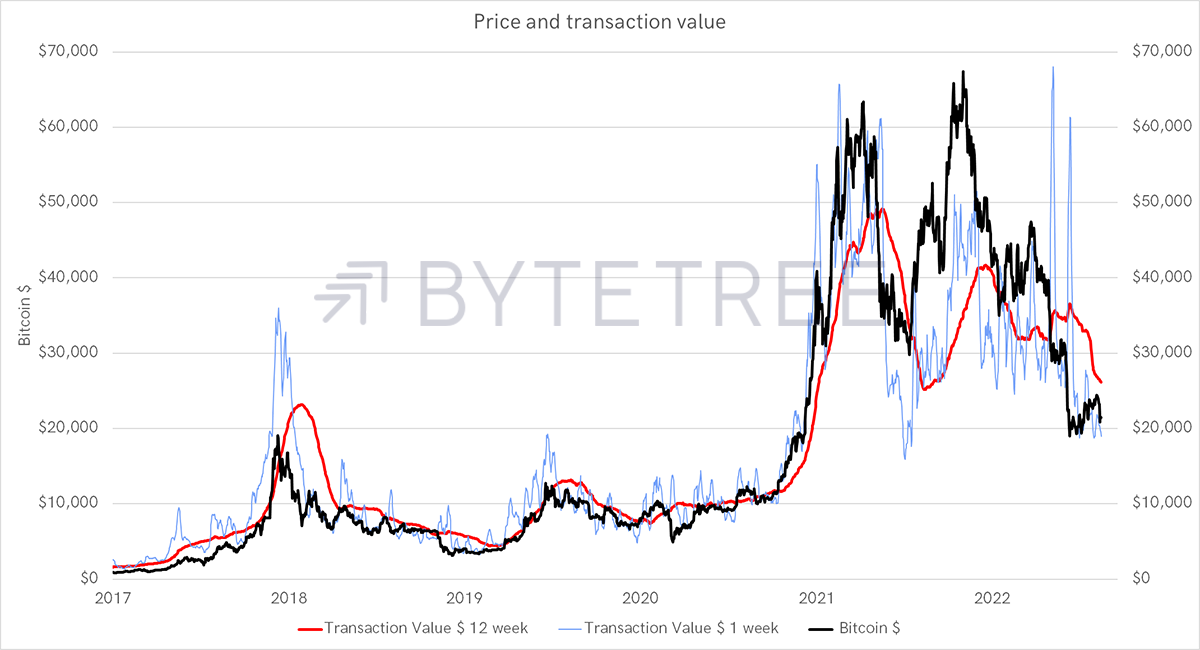
Source: ByteTree
But being underpinned isn’t the same as growing, and we cannot currently make that claim. However, halving is getting closer. In April 2024, bitcoin’s inflation rate halves from around 1.9% to less than 1%. That will see the miners’ revenue halve, which reduces selling pressure. That explains why previous cycles have seen the “pull to halving” around 18 months ahead of time.
The current epoch (halving cycle) is well past the halfway mark. Epoch 2 made its low after 777 days, and epoch 3, 889 days. Epoch 4 is currently 827 days old, so we’re in the zone.
The Pull to Halving
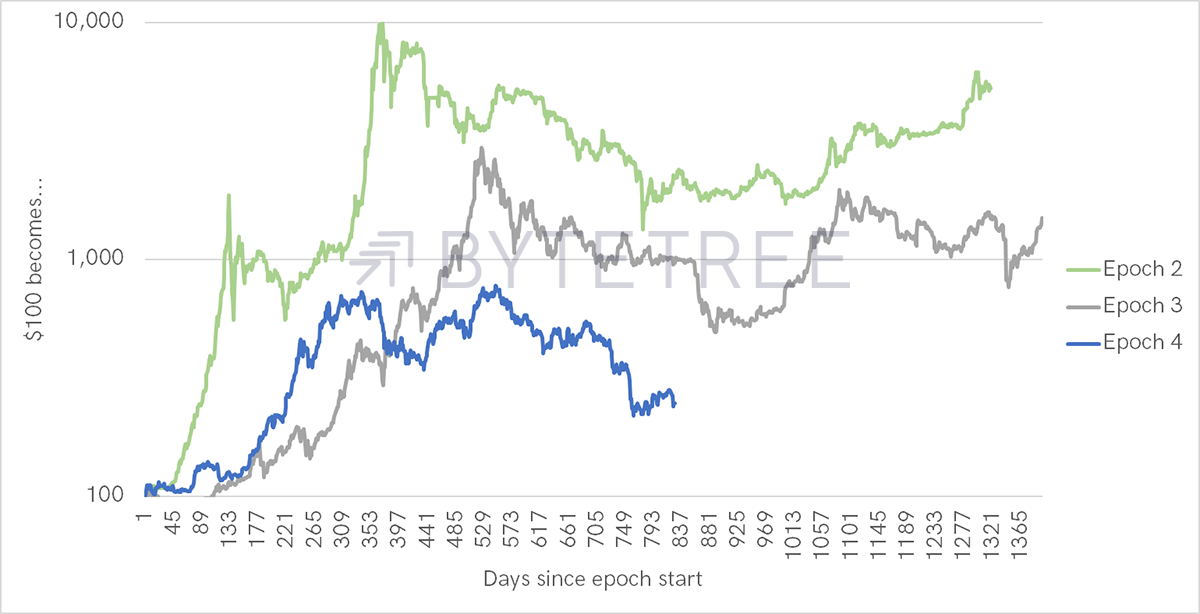
Source: ByteTree
The long-term fundamentals of this network are down but not out, and despite a tactical neutral view, we remain long-term bitcoin bulls.
Technical
The short-term moving average is positive, while all other scores are negative.
Bitcoin One-Star Trend
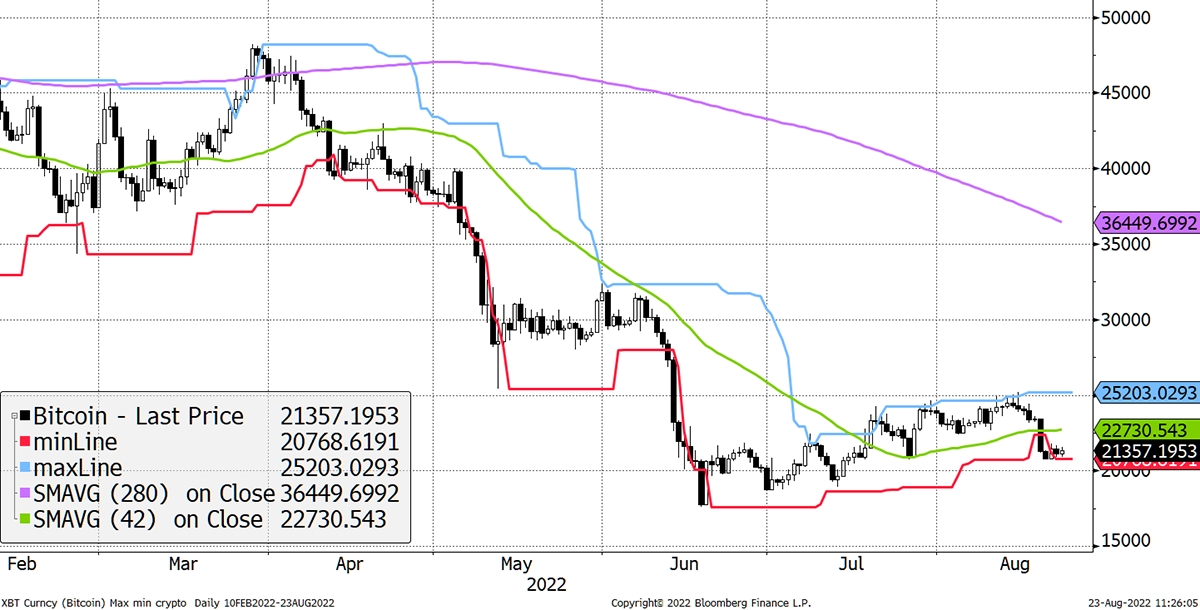
Source: Bloomberg
I could show you the chart in euros to make us all feel better, but it’s still a one-star trend. More importantly, bitcoin in NASDAQ (BitDAQ) has also returned to zero stars.
BitDAQ at Zero Stars
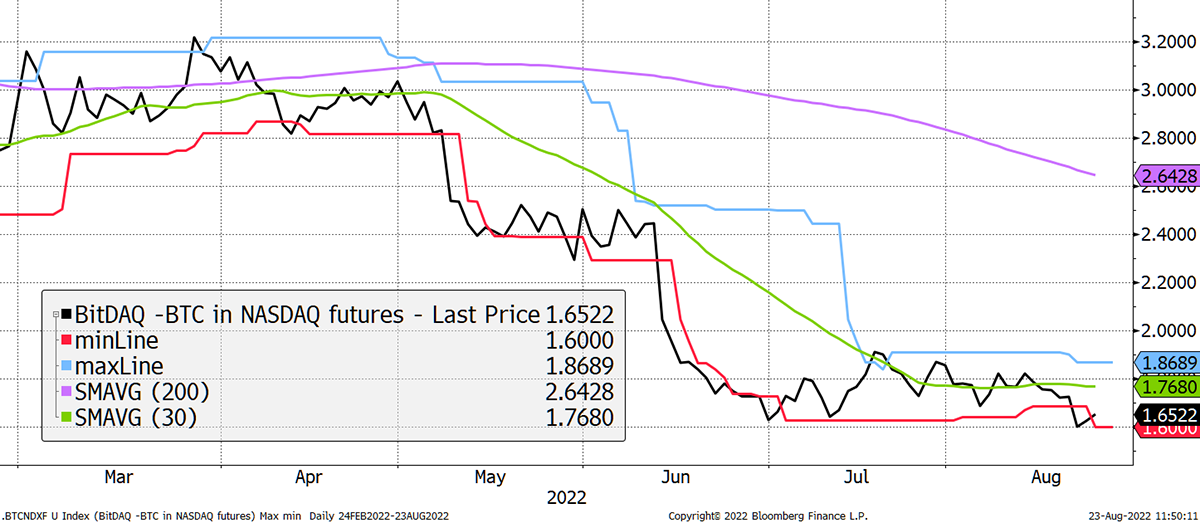
Source: Bloomberg
This is unhelpful because outperformance is needed to drive inflows. We have seen this in the gold market for years, where inflows follow outperformance and therefore lag. The great hope is that bitcoin, sooner or later, shows resilience versus the stockmarket or starts to outperform to the upside. We can’t realistically expect a tsunami of institutional buying until that happens.
On-chain
By: Charlie Erith
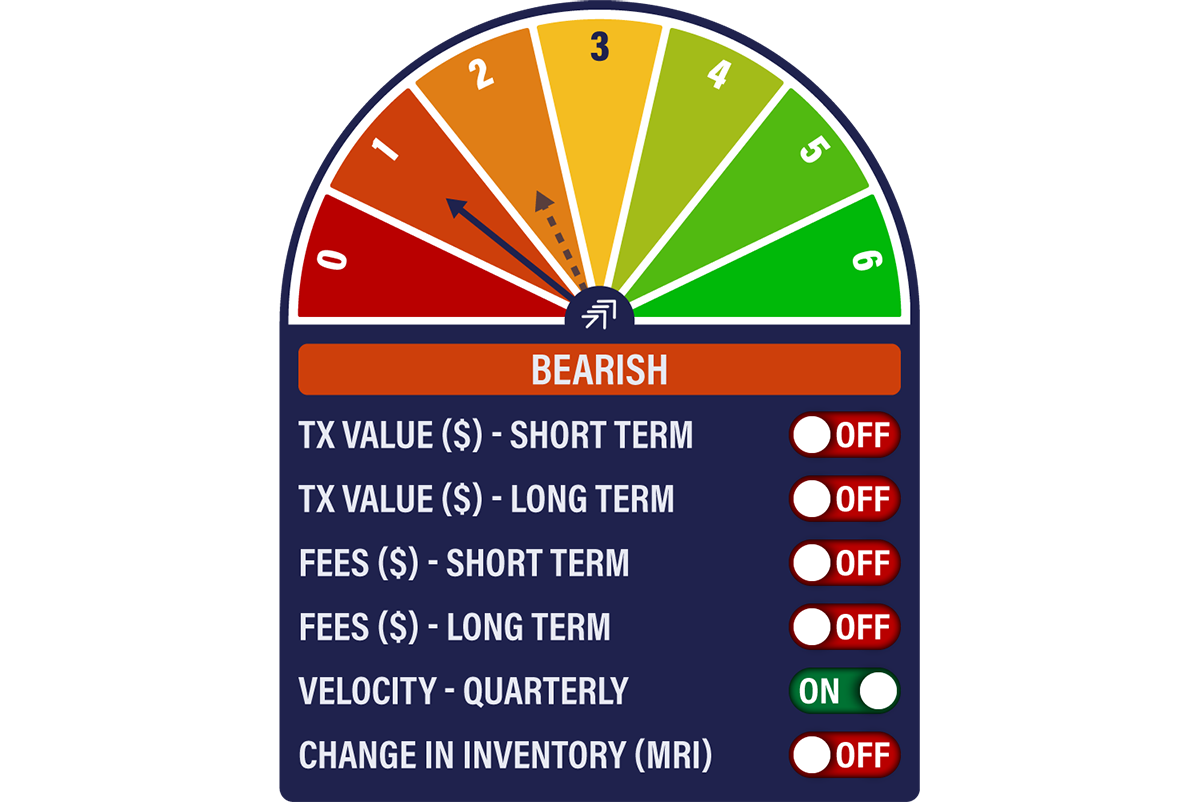
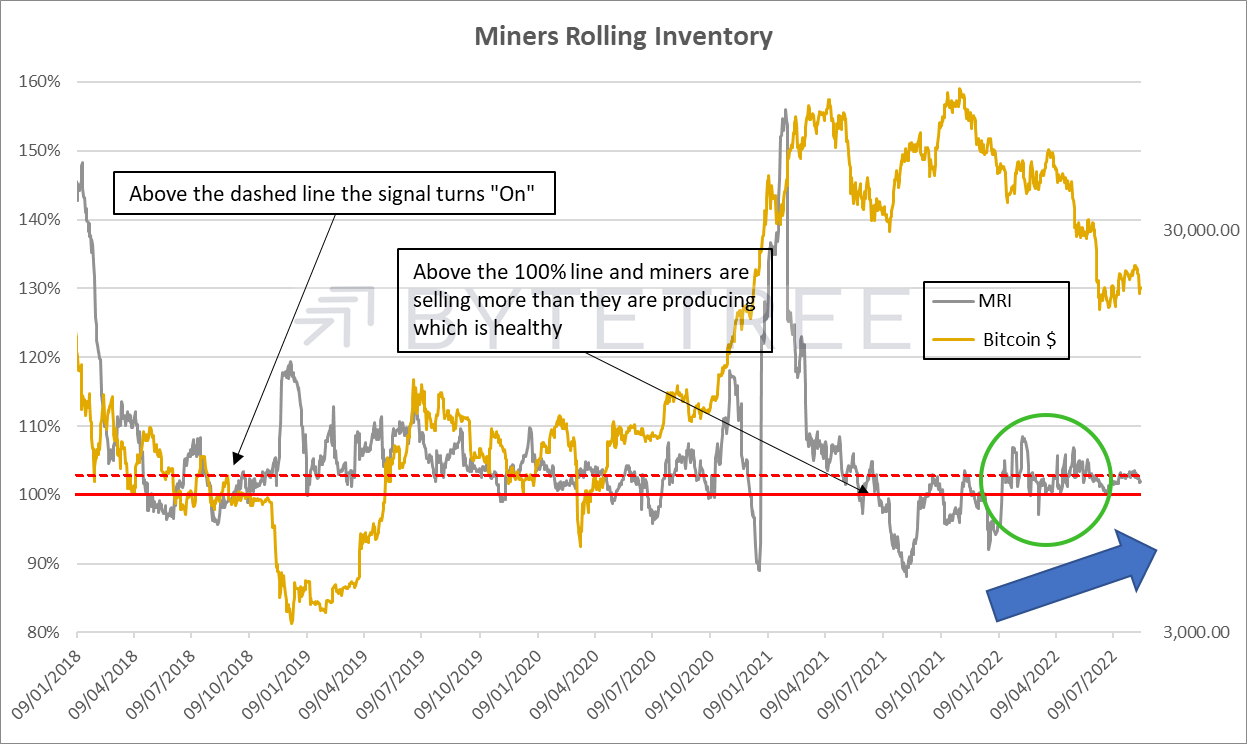
The Network Demand Model slips to 1/6 this week, as the MRI (Miners’ Rolling Inventory) signal turns off. A score of 1 is a bear market setting and demonstrates that network activity remains subdued. We can create all the narratives we like about crypto, but the data doesn’t lie.
The contrarian view could be that at least miner selling is abating, signalling either that they have got their collective houses in order financially, or they see better times ahead. This latest bout of concentrated selling activity (circled in green) has coincided with the precipitous falls seen since the start of Q2, so perhaps less pressure from this direction will improve the dynamics of the market.
It is not as though the miners are abandoning the network. Both the block interval (too low) and baseline generation (too high) charts indicate that “difficulty” will have to rise at the next adjustment at the end of August. The engine room of the network is in good shape.
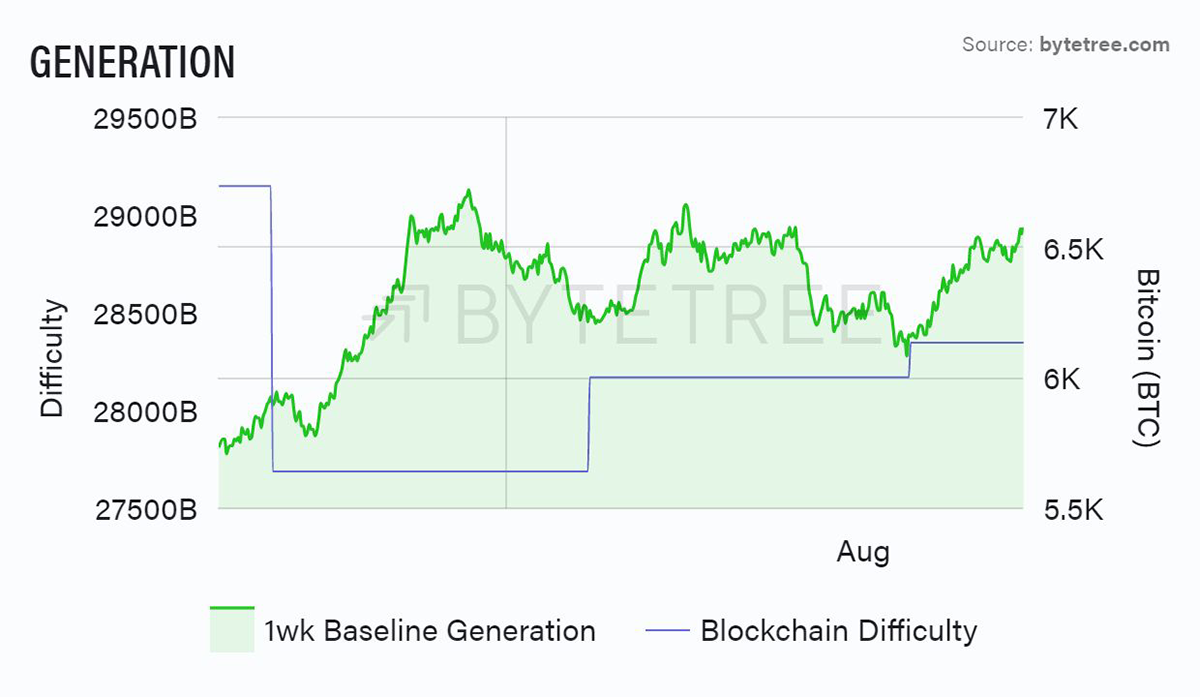
Source: ByteTree. BTC Generation and Difficulty over the past five weeks.
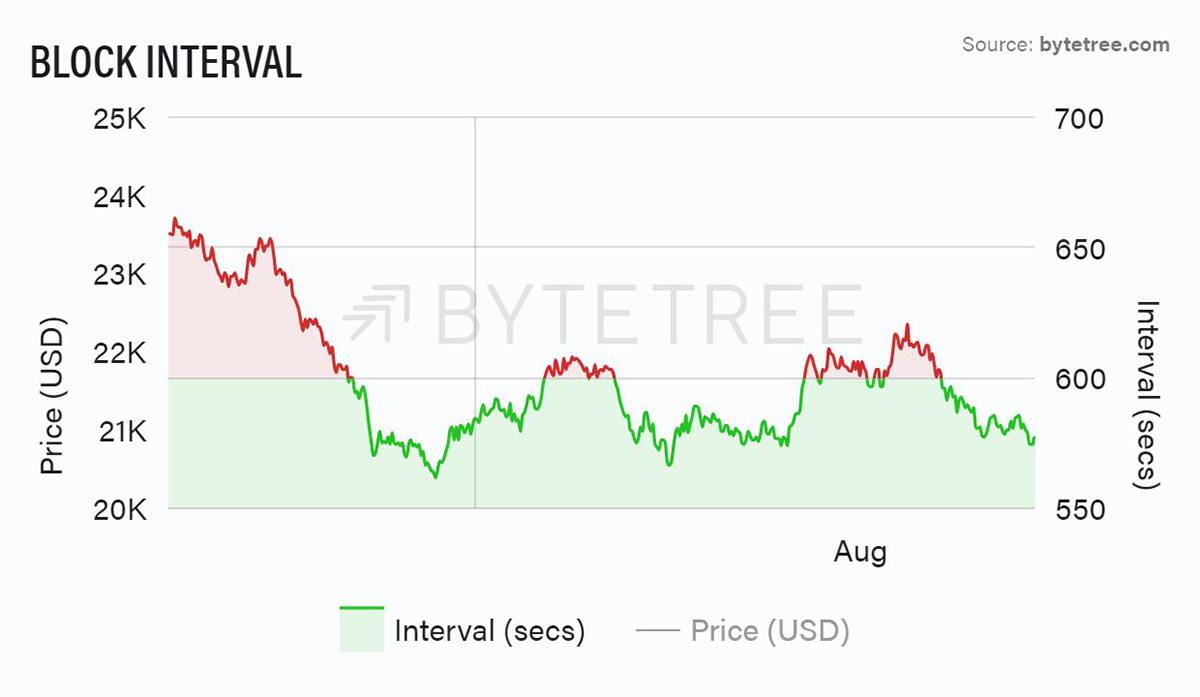
Source: ByteTree. BTC Block Interval over the past five weeks.
Meanwhile, transaction value across the network remains soft. The long-term series (below) shows the decline dramatically, and we are back to levels last seen in early 2021 when the price was moving towards US$30,000.
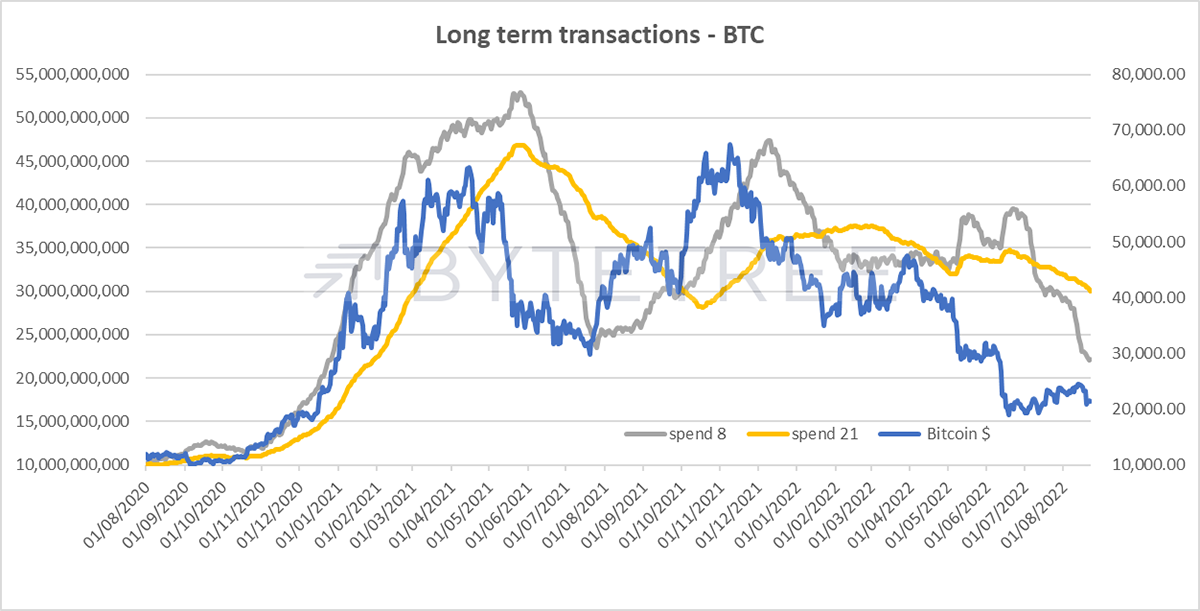
Source: ByteTree
Of course, this latest decline is largely price driven. At least the number of transactions is holding steady, as shown below.
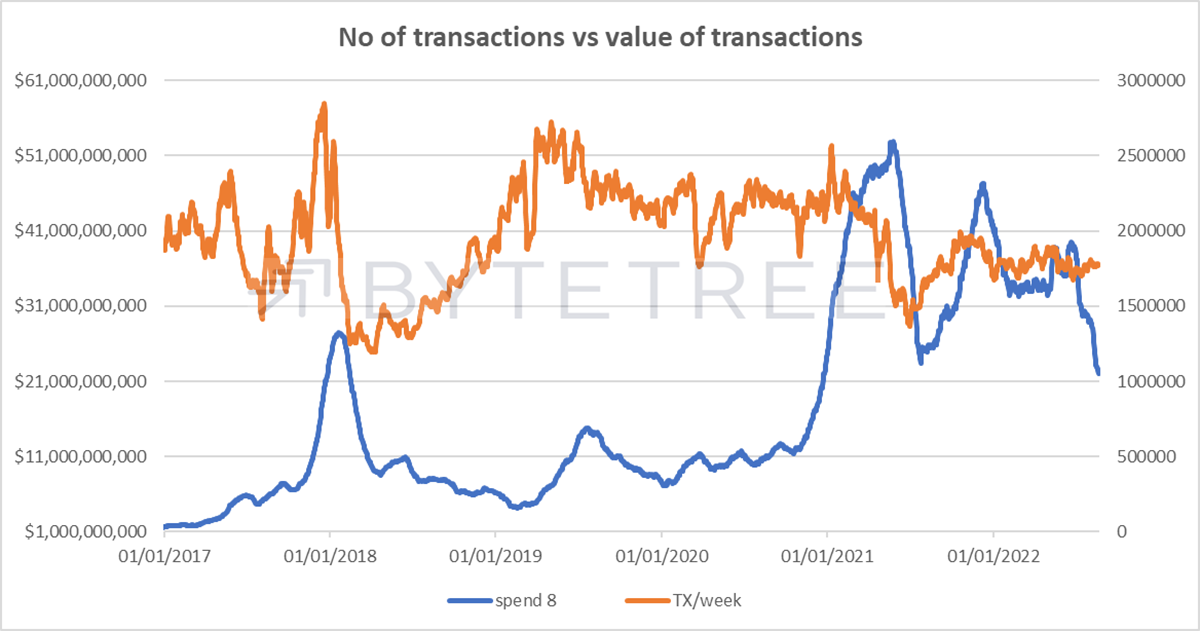
Source: ByteTree
Macro
The Chinese Renminbi (CNY) did sell off last week, but that wasn’t the whole story. It was the other side – dollar strength - which was felt across markets.
The Dollar Wrecking Ball
Source: Bloomberg
A peak dollar would be a welcome turn of events, but what we are seeing are two-year treasury yields rising, albeit slowly, with inflation expectations falling in the US. This contrasts the US with the rest of the world, where inflationary pressures are still rising, especially in Europe.
Falling Inflation Expectations in the US
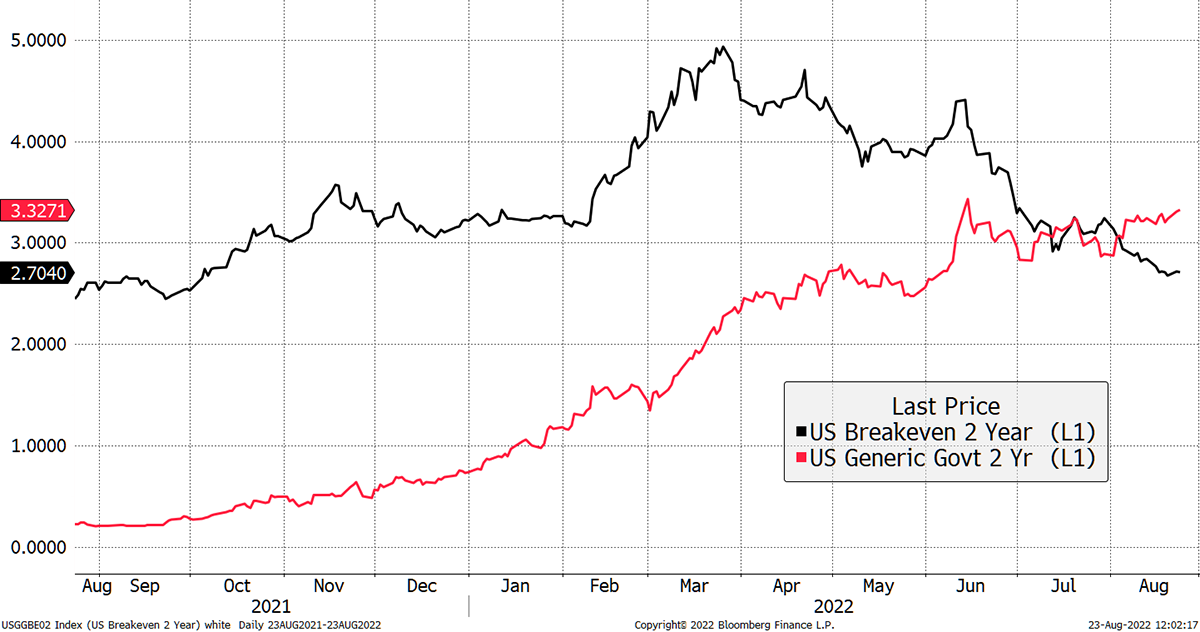
Source: Bloomberg
Recent months have seen bitcoin weaken in the face of rising 2-year real rates (red minus black from above shown INVERTED, below). While the dollar has soared on the back of rising real rates, bitcoin has struggled.
A Remarkable Fit
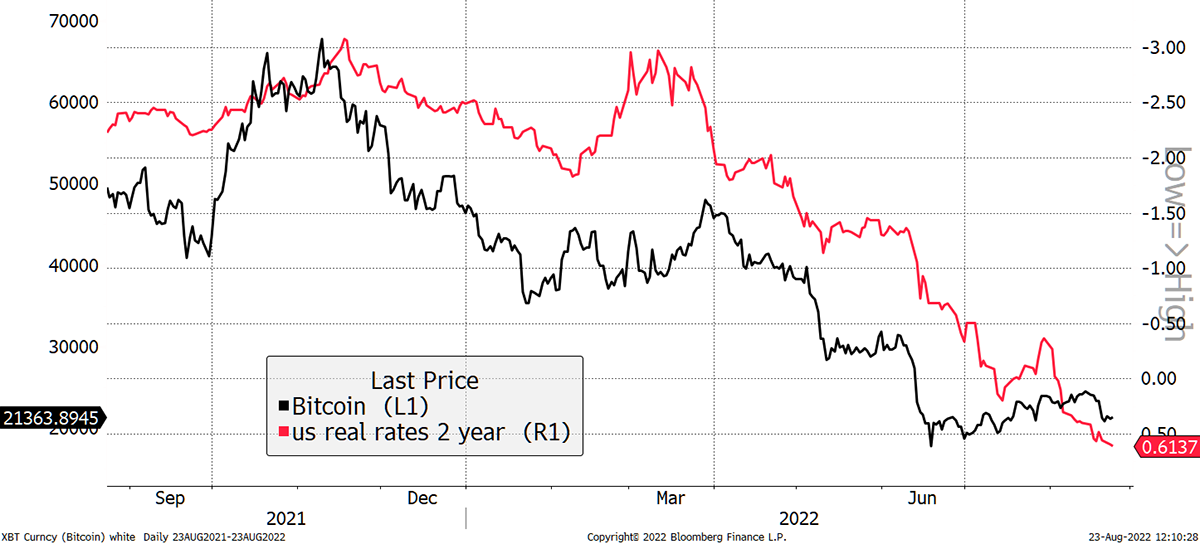
Source: Bloomberg
This reiterates what we intuitively already know. Bitcoin likes easy monetary conditions. To make bitcoin rally from a macro perspective, I don’t think rate cuts are required, just higher inflation expectations combined with the end of upward pressure on rates.
Summary
It’s still August, the month when strange things happen. It seems unlikely that bitcoin will surge in the near future, but it has good reason to be underpinned in the $20k zone. A peak in the dollar, driven by easing monetary conditions, will be well received by crypto.

