

ATOMIC 60
The correlation between crypto and speculative growth is too high to ignore, and that means external macro events cannot be overlooked.
ByteTree ATOMIC
Analysis of Technical, On-chain, Macro, Investment Flows and Crypto.

Highlights
| Technicals | The alts rally |
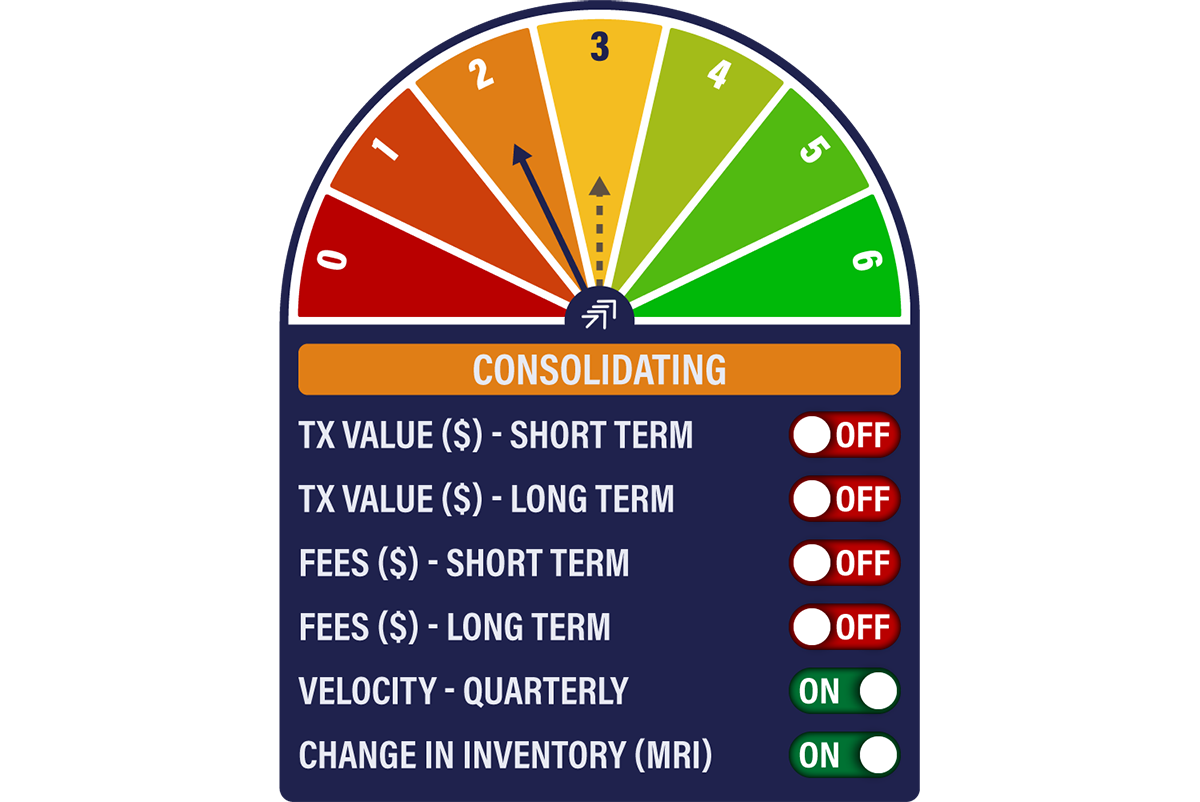
| On-chain | Subdued consolidation |
| Macro | Is the bear dead? |
| Investment Flows | Contrarian indicator? |
| Cryptonomy | Galaxy’s Q2 Earnings Reports |
Technical
By: Charlie Morris
The alt rally continues as the MVDA 25 Index, which is 18.8% BTC with the rest in the leading alts, outperforms.
It is interesting to look at this history, whereby alts have significantly lagged bitcoin since early 2018. They slumped that year, and once again in mid-2019. The final slump occurred during the last truly great bitcoin rally in late 2020. I can only assume the 1 January 2021 is the all-time low for alts vs bitcoin. Bitcoin bull markets are highlighted in blue.
Alts gain since early 2021
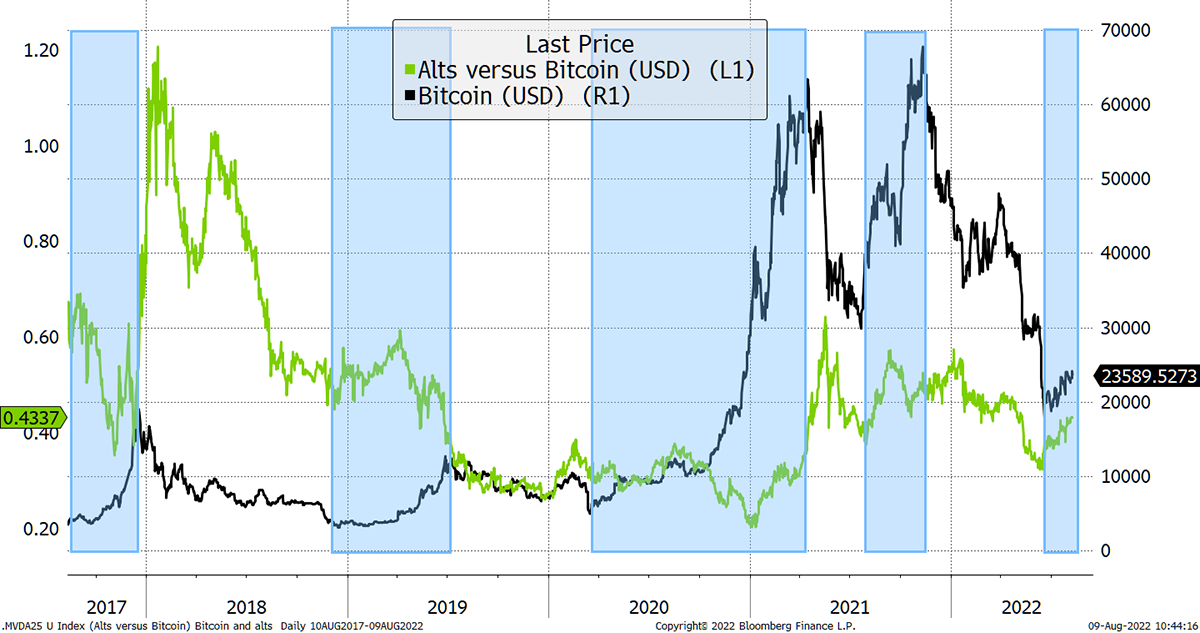
Source: Bloomberg
Assuming that’s true, and assuming crypto is here to stay, which it is, then we can start to frame the crypto market against bitcoin. The alt market is clearly more volatile, but it’s up 62% since 1 January 2021, when bitcoin is -20%.
Alts in front since 2021
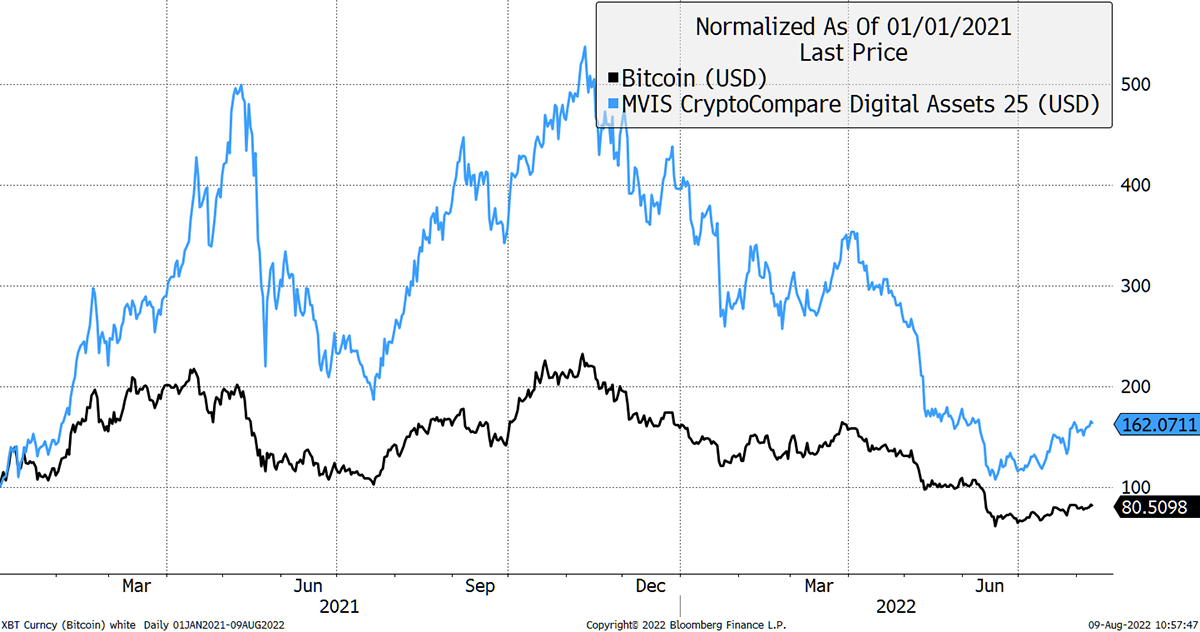
Source: Bloomberg
This starting point favours the latter, and the volatility is materially higher, but you would expect that from assets with superior growth.
The alts are volatile
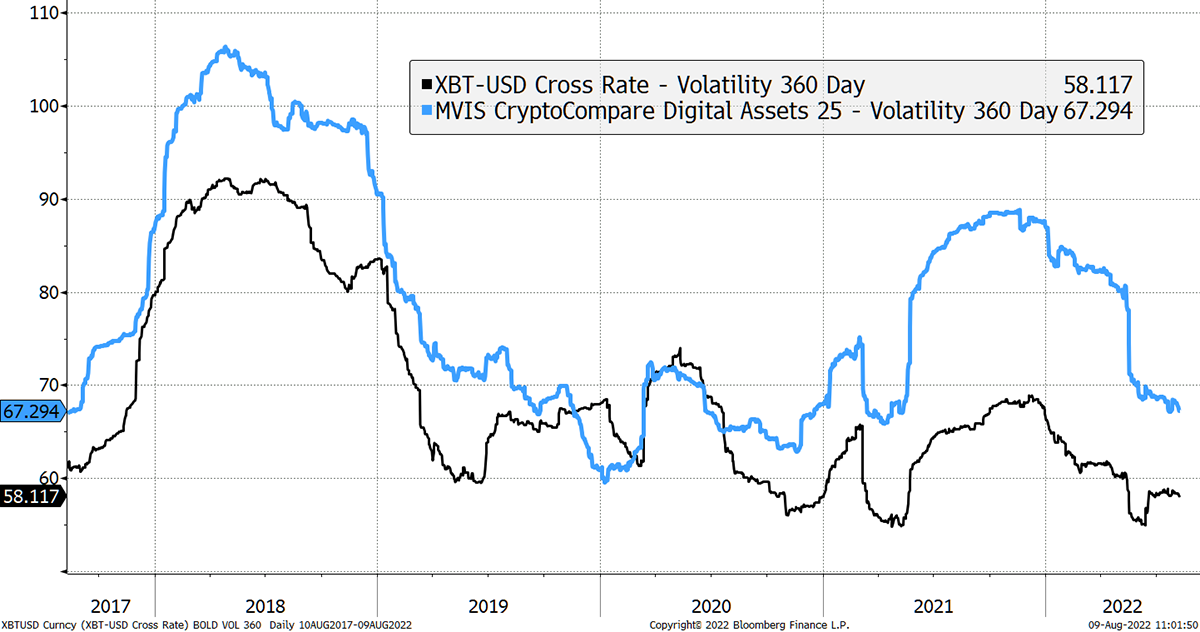
Source: Bloomberg
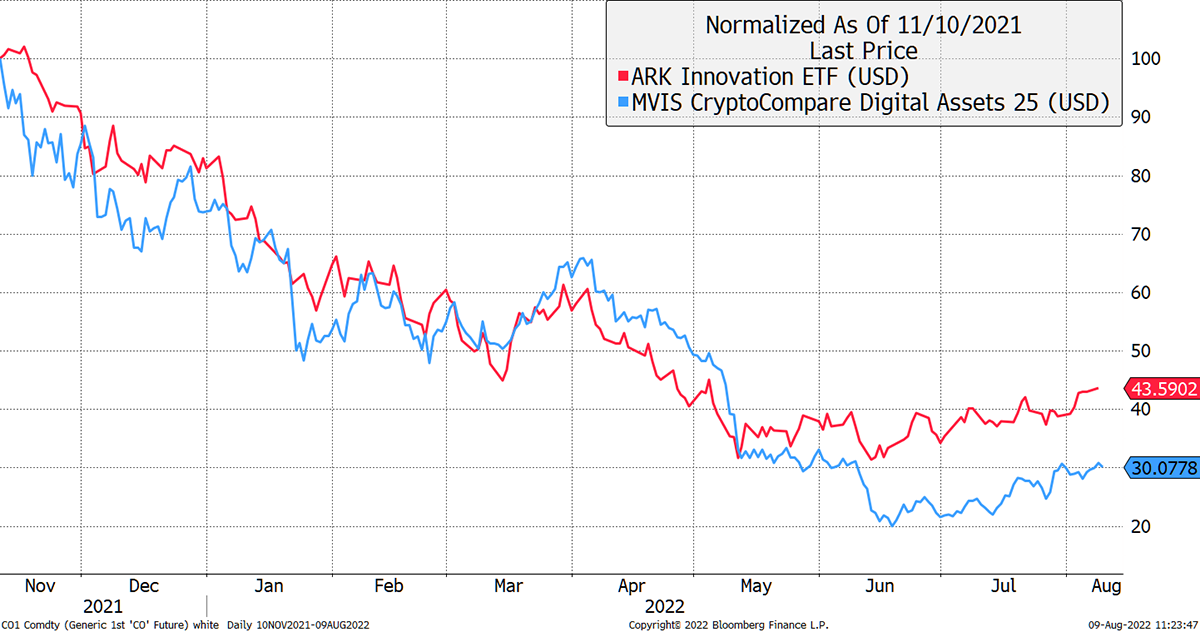
Looking at the experience since the last peak on 10 November 2021, the underperformance of holding an alt basket has been much less than seen in previous cycles, and that is despite Terra Luna, a major constituent, falling to zero.
Alts underperformance less than expected during the bear
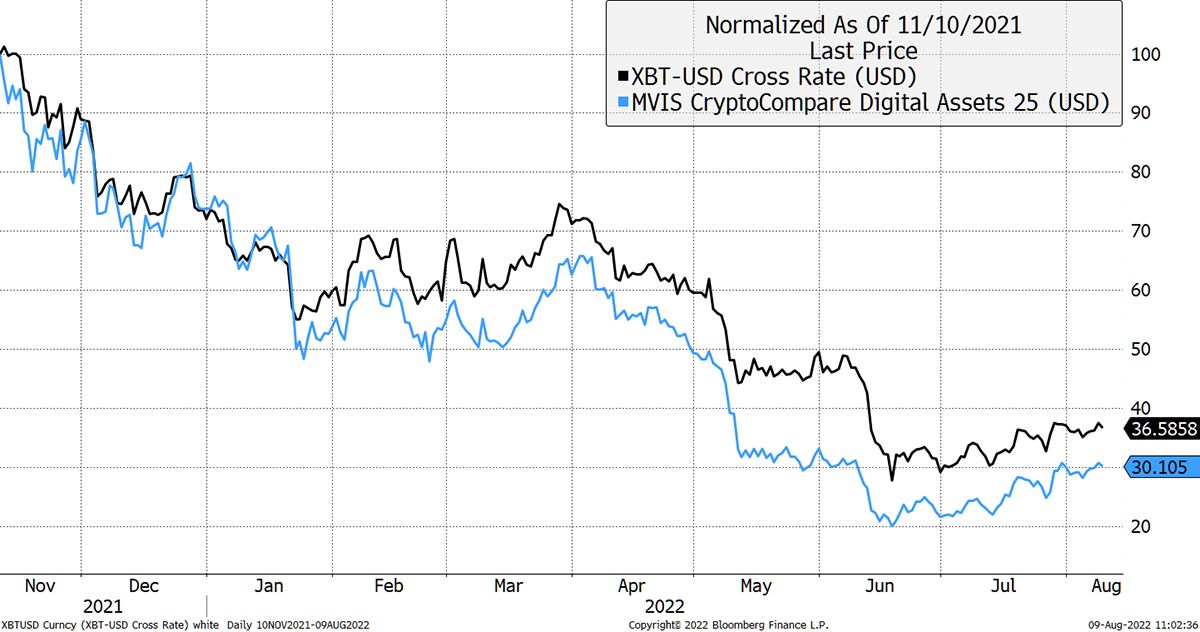
Source: Bloomberg
This is why we launched ByteFolio in April, with the aim to identify and lock on to the winners. In hindsight, I wish I had waited a little longer for the storm to pass, but the performance is respectable, and we didn’t hold Terra Luna.
Finally, I show the crypto breadth measured in BTC. With the red skies retreating, there is only a few alts severely underperforming bitcoin. The dark blue is rising from low levels, which highlights new leading trends. I have overlaid the ByteTree Crypto Average (BCA), which helps gauge the average token performance but be aware this overstates reality in both directions. Nevertheless, a useful directional tool.
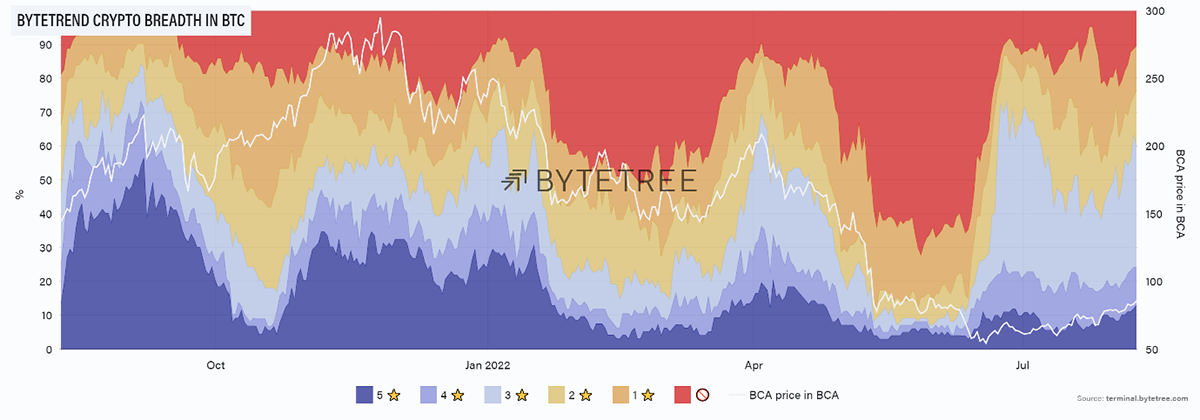
Source: ByteTree. ByteTrend crypto breadth chart in BTC over the past year.
Even if crypto declines further, you have to wonder whether there will be resilience from the leading alts. I suspect there will, and ByteFolio’s role is to find them.
On-chain
By: Charlie Erith
Bitcoin on-chain activity remains subdued. Short-term transactions have yet again turned off in the Network Demand Model, while we see a decline in the Institutional Demand Ratio (IDR). The number of transactions has held up well, but the velocity of coins has also been falling. The conclusion we’d draw is that this is all consistent with a phase of consolidation. If you’re hoping for an explosion to the upside, don’t hold your breath.
The chart below shows the 2-week transaction series (grey) falling below the 5-week series (yellow). Weekly transaction activity is hovering around US$21bn, which is consistent with the price fall. The good news is that the number of transactions has held up well. It’s just that they’re not as large as they were.
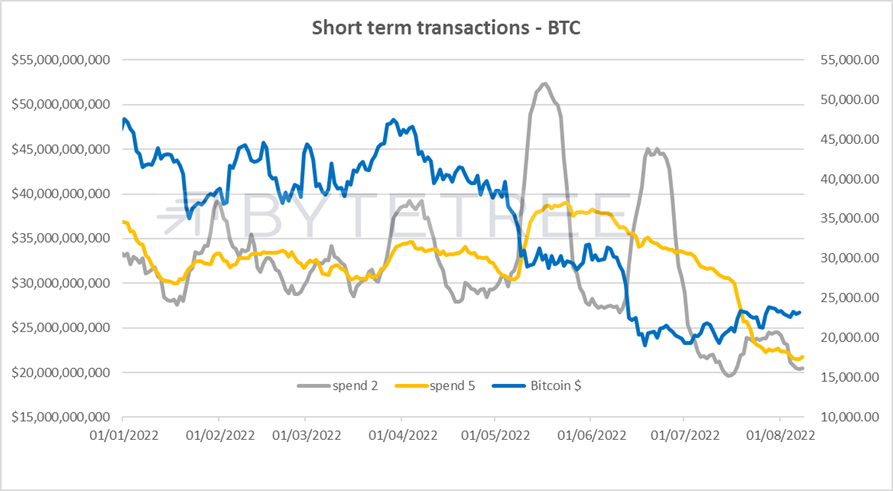
Source: ByteTree. Short-term bitcoin transactions and price since January 2022.
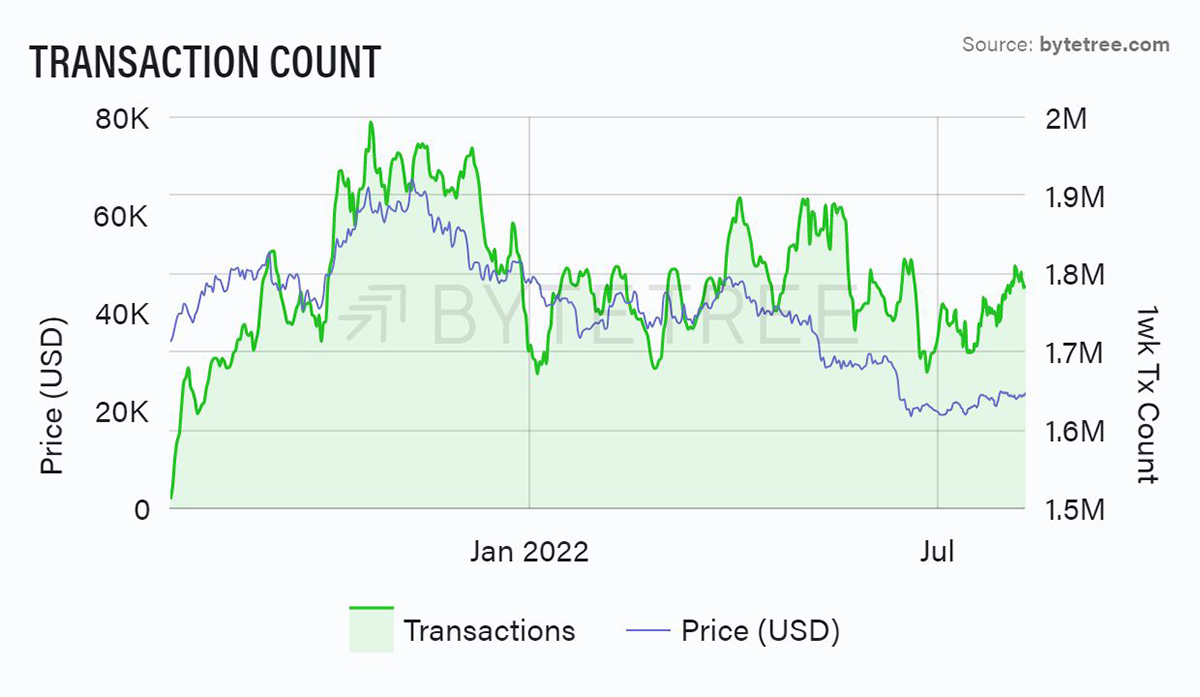
Source: ByteTree. The number of bitcoin transactions and price over the past year.
The IDR (green line, below) looks at the top quintile of transactions as a percentage of the total transaction value. With the exception of the Christmas break, you can see we’re back at a level for a year. Back in September 2021, the ratio was on the cusp of turning higher as we went into the 4th quarter rally that took the bitcoin price to an all-time high.
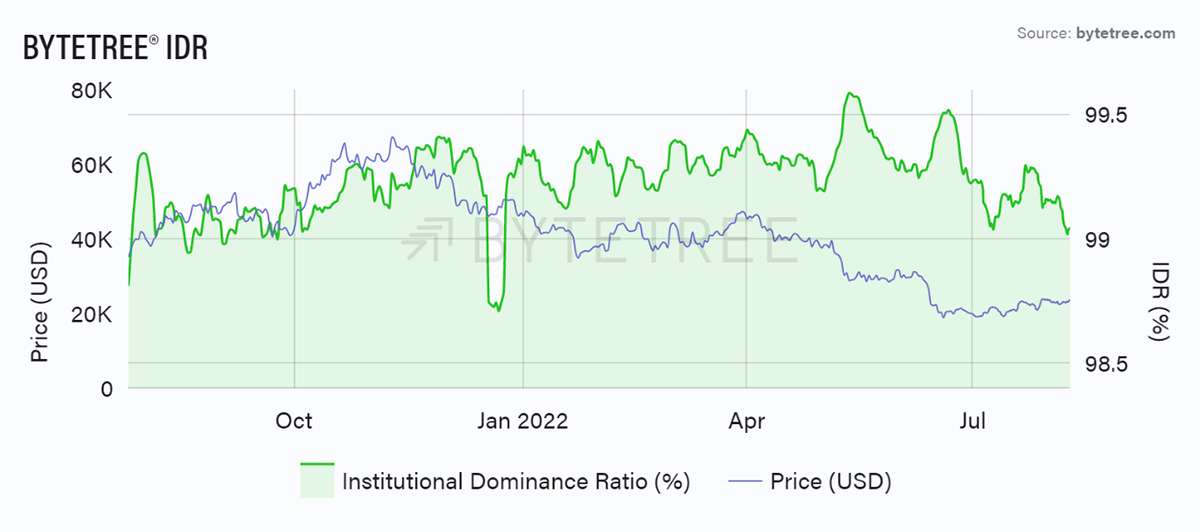
Source: ByteTree. Bitcoin Institutional Dominance Ratio (%) and price over the past year.
We also see velocity turning down after the extreme levels of activity seen in the Q2 sell-off this year. This tells us that ownership is settling down: the sellers have departed, and their replacements are happy to “hodl”.
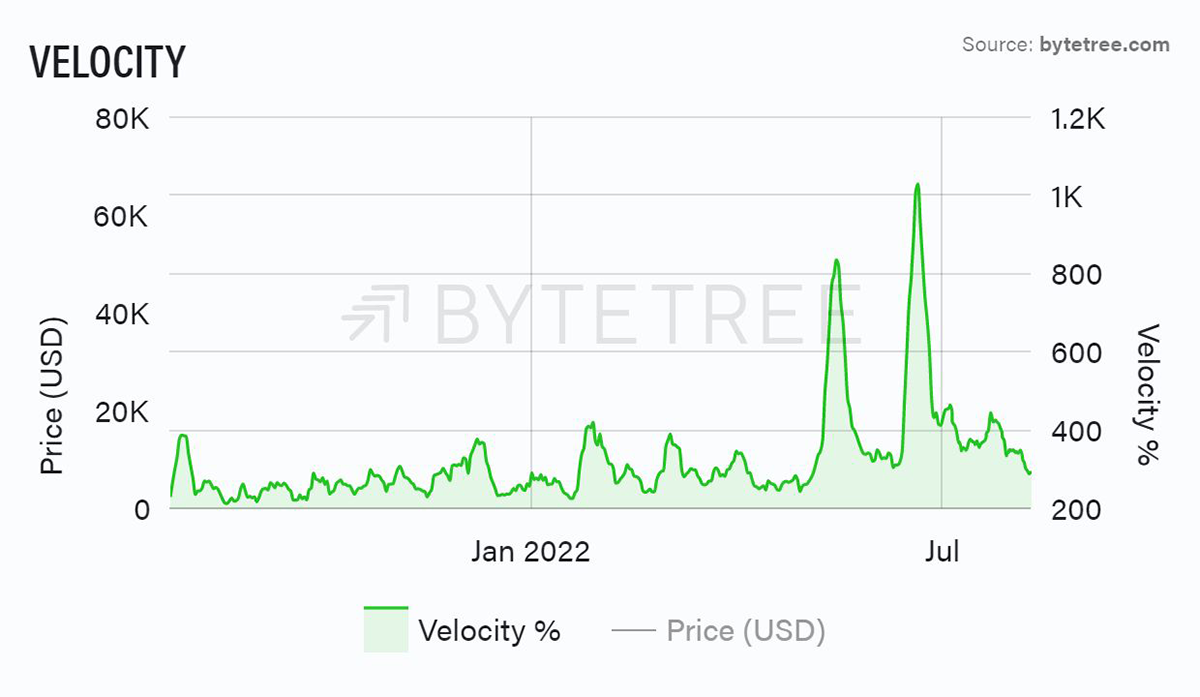
Source: ByteTree. Bitcoin velocity (%) over the past year.
The optimistic interpretation is that these signals are a sign that a bottom has been reached. If the price continues to move higher, it might be the catalyst for greater activity. The less rosy view is that weakened activity is telling us that adoption is weak and we should expect to remain in a range at best.
The one thing that appears evident is that large-scale institutional involvement has moved to the sidelines. That suggests a network dominated by retail investors, which in our view is healthy. A significant catalyst would be a more accommodative regulatory environment, which would be a green light for the big beasts.
Fund Flows
By: Charlie Erith
Bitcoin ETF ownership has recovered from the dip last week, with a net gain of 3,478 BTC (around US$80m). At the very least, it reveals steady hands.
The 30-day cumulative net fund flow chart shows the difference between the structural bull market of 2020 versus choppier behaviour since. The indicator was a powerful contrarian indicator in the late 2020-early 2021 period, and again in October 2021, when spikes in net inflows signalled the top of the market. FOMO, no doubt. Even recently, it’s been useful, with journeys into the red suggesting buy and vice versa when we’ve hit the 10k inflow level. As it stands, we’re in neutral to cautious territory on this measure.
Bitcoin needs a catalyst
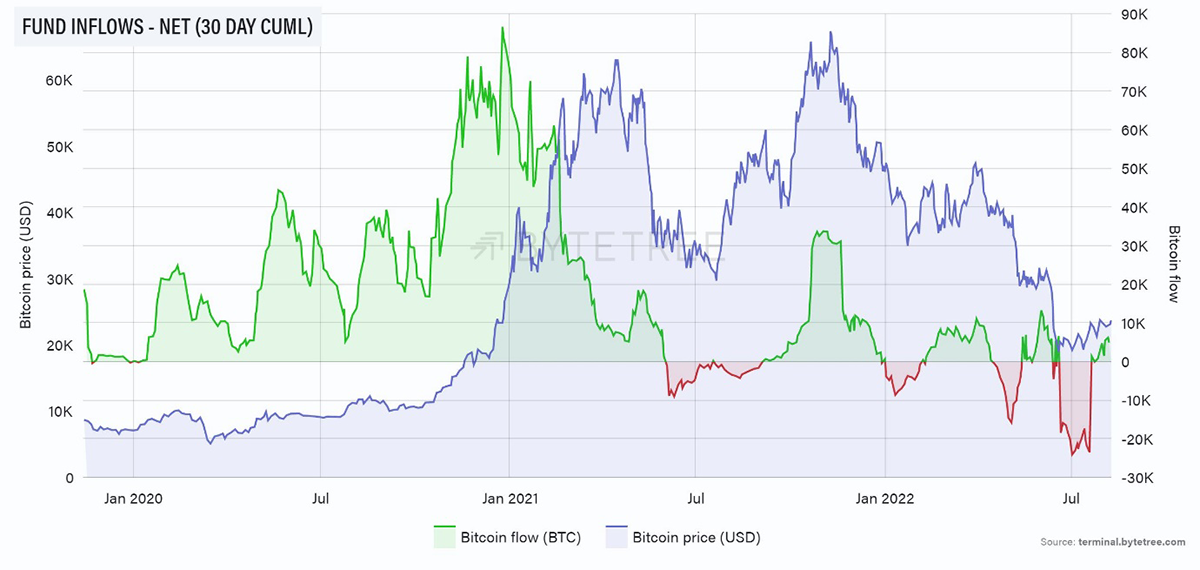
Source: ByteTree. Bitcoin ETF net inflows, 30-day cumulative, since January 2020.
Macro
By: Charlie Morris
As crypto has rallied, so has the speculative end of the stockmarket. There can be no doubt that crypto has been highly correlated with profitless growth stocks. Yet increasingly, the message from crypto is that profitable business models are the ones that will sustain. That is why exchanges and fee-generating platforms are the ones showing the best performance. Grow those networks, as we keep on saying.
Crypto vs speculative growth stocks
Source: Bloomberg
The correlation between crypto and speculative growth is too high to ignore, and that means external macro events cannot be overlooked.
One of the key drivers of stockmarkets, is margin debt. The brokers report their total client debt to FINRA, which publishes the data. The money to buy stocks must come from somewhere, and given investors don’t have trillions themselves, they keep borrowing it until they do. Eventually, this goes into reverse.
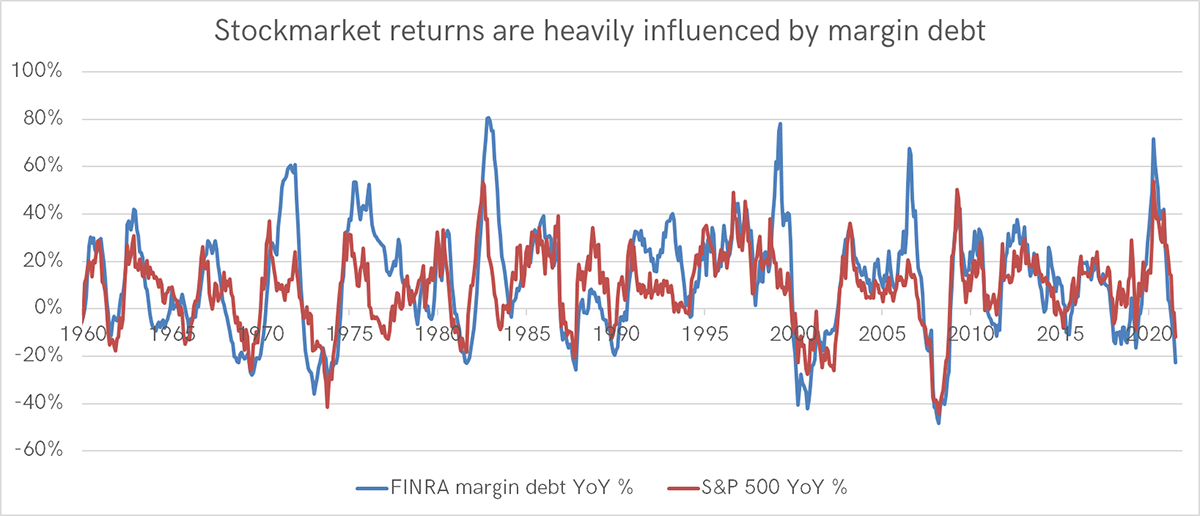
Source: Bloomberg, FINRA
This change in the stockmarket versus the change in debt is one of the most powerful drivers of returns, yet under-discussed. The current reading is -23%, meaning the outstanding margin debt has declined by 23% (or $198 billion) over the past year. Possibly that’s enough, but I have my doubts as there’s the potential for things to get worse than they already are.
There’s also the idea that the last third of a bear market is normally the worst. That implies if things turn down in the autumn, there’s a good chance it gets ugly, as the blue chips have only suffered minor damage compared to crypto and speculative growth stocks.
Crypto investors cannot escape this, but there is a glimmer of hope should the dollar peak be in. Even if the Fed keeps raising rates, the worst of the shock factor must be behind us for the time being.
Dollar peak still on track
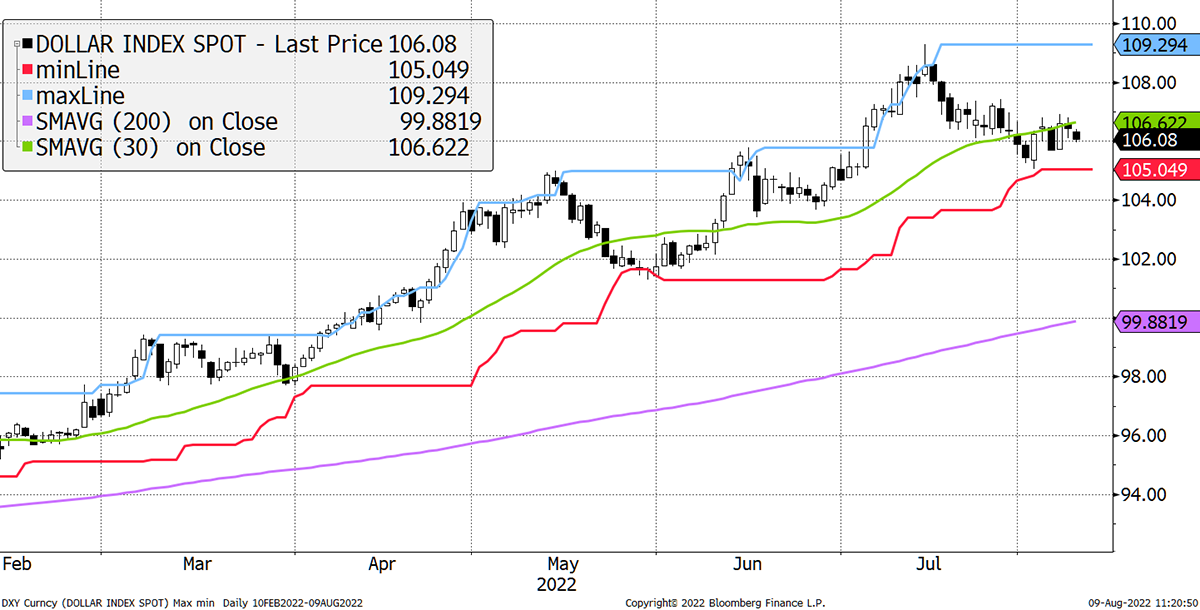
Source: Bloomberg
There is a chance that credible crypto business models to deliver and pull away from the market mess around us. At the very least, I suspect any damage in crypto will be lesser than seen by the blue chips. The worst is surely behind us.
Cryptonomy: Galaxy’s Q2 Earnings Reports
By: Laura Johansson
This year’s market turmoil is further reflected as Galaxy Digital, a well-known blockchain company, yesterday reported a hefty loss for the second quarter. According to the report, the losses were largely attributed to unrealised write-downs on digital assets and investments due to the crypto crash. This loss was partially offset by record revenue in the company’s mining business, which brought in $10.9 million in Q2 2022 - up 204% YOY. Commenting on the results of the earnings report, CEO Michael Novogratz said:
“While the crypto landscape is less certain than it was, my confidence of where it’s going in the medium-term hasn’t waned a bit […] I don’t feel nearly as bad as I thought I would, and I hope it’s the worst quarter this firm ever has.”
Late last week, BlackRock, the world’s largest asset manager, unexpectedly announced that the firm was partnering with Coinbase to give institutional investors access to bitcoin. Not only will this open bitcoin to a big cash boost, but it will also give the green light to other institutional investors who are looking to follow suit. Coinbase revealed that they would connect to Aladdin, BlackRock’s investment technology platform, which handles $trillions of assets.
As the news spread across the crypto space, predictions of new all-time highs for bitcoin by the end of this year emerged in force. We will see.
Summary
After 25 years in markets, I know never to trust the price action in August. The autumn is nearing, and that’s when people get back to work and rediscover the sell button. The escalation in tensions around the world could get ugly. I hope crypto offers us something different.

