

ATOMIC 63
At ByteTree, we believe bitcoin is underpinned at the $20,000 level, but acknowledge that the trend is weak and the macro is harsh. What’s needed is peak macro carnage, which will ease correlations. At that point, bitcoin will be able to differentiate itself and find its own path.
ByteTree ATOMIC
Analysis of Technical, On-chain, Macro, Investment Flows and Crypto.

Highlights
| Technicals | Weak |
| On-chain | A recent pickup |
| Macro | Peak dollar |
| Investment Flows | Net flows |
| Cryptonomy | Lightning |
Technical
By: Charlie Morris
Over the past year, bitcoin has fallen sharply to a level where ByteTree believes it is underpinned. That is based on the underlying network, which has contracted much less than in past bear markets.
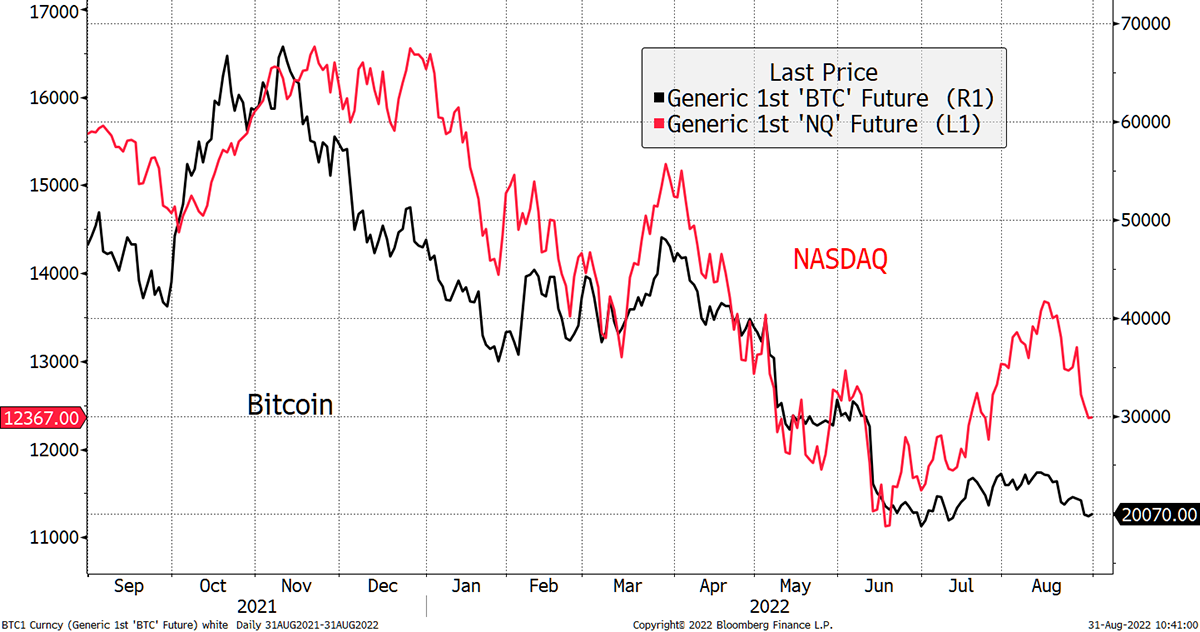
Yet, it has remained highly correlated with traditional markets, especially technology stocks. Better still, it has been a leading indicator, as you can see. Bitcoin started its decline last November, several weeks ahead of the NASDAQ.
Bitcoin and NASDAQ will soon decouple
Source: Bloomberg
It then made a low in January, ahead of the NASDAQ. Since then, the two have tended to move more closely together, but Bitcoin has not confirmed this bear market rally in equities, which gave us the heads up to doubt it.
This correlation between bitcoin and stocks isn’t always as high as it is today. It rose in 2020 as the covid crash and recovery saw general asset prices move together. Then it cooled in mid-2021, as bitcoin had its own problems with the China crackdown. More recently, correlation hit a record high as the “everything bubble” in bonds, equities and crypto came tumbling down at the same time.
Peak correlation
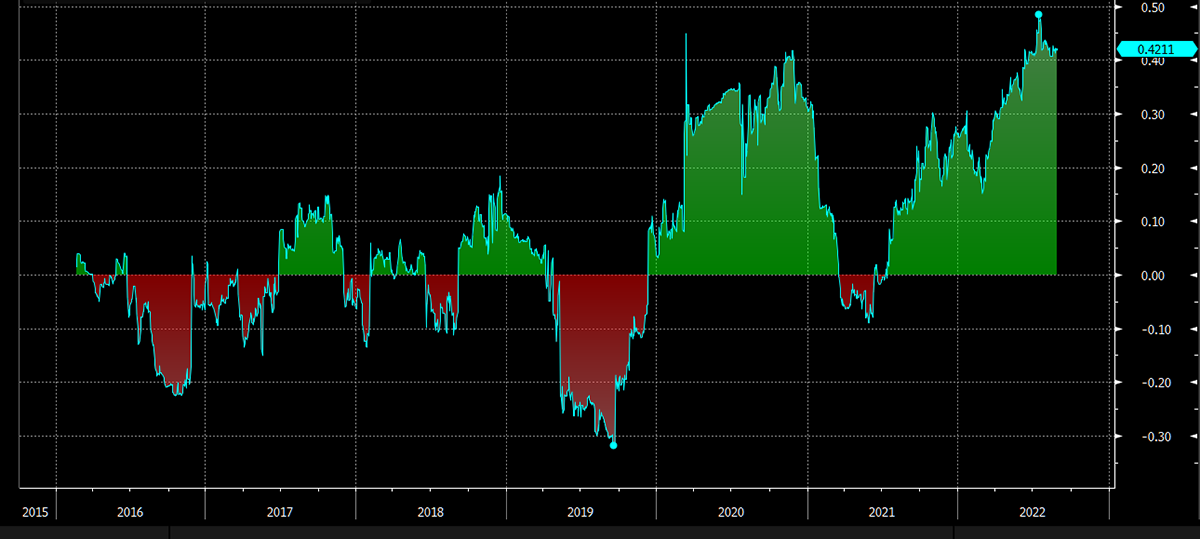
Source: Bloomberg
When two very different asset classes, such as bitcoin and tech stocks, have an unusually high correlation, it’s a fair bet to assume it will reverse.
Looking at BitDAQ (bitcoin in NASDAQ), the two assets have seen the same return at all points along the green horizontal. In other words, bitcoin has enjoyed the same return as the NASDAQ since early 2018, mid-2019 and late 2020.
Bitcoin = NASDAQ since early 2018
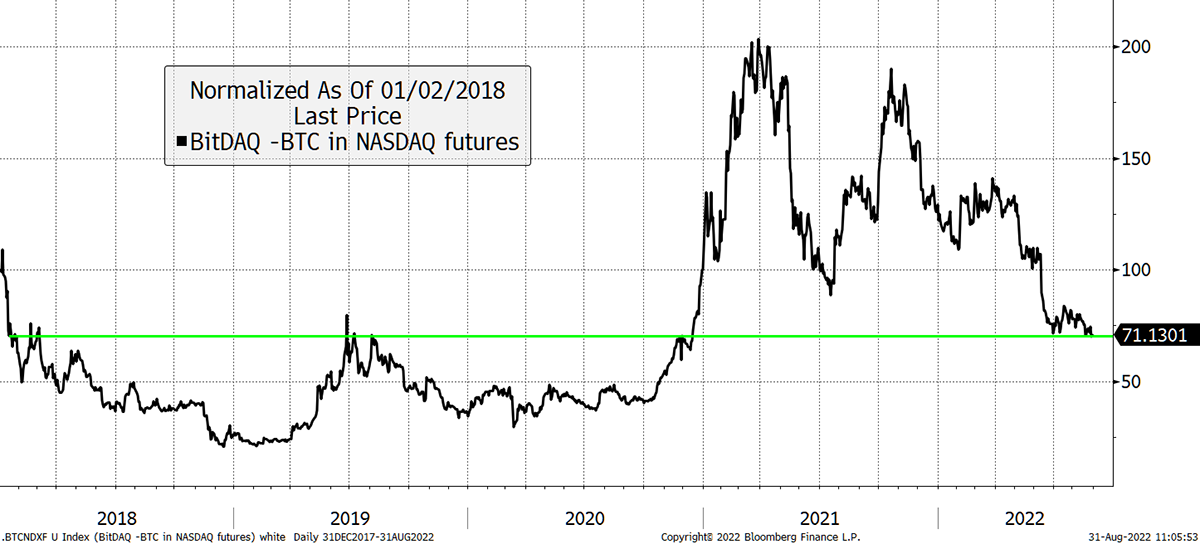
Source: Bloomberg
The average has been 75 on the y-axis, and so at 71, bitcoin trades at a slight discount. Going back to the 2013-high a different picture emerges. Bitcoin had a trend growth rate 60% higher than the NASDAQ and has traded in bands. The upper bands have called market tops, and the lower bands market bottoms.
Challenging the trend
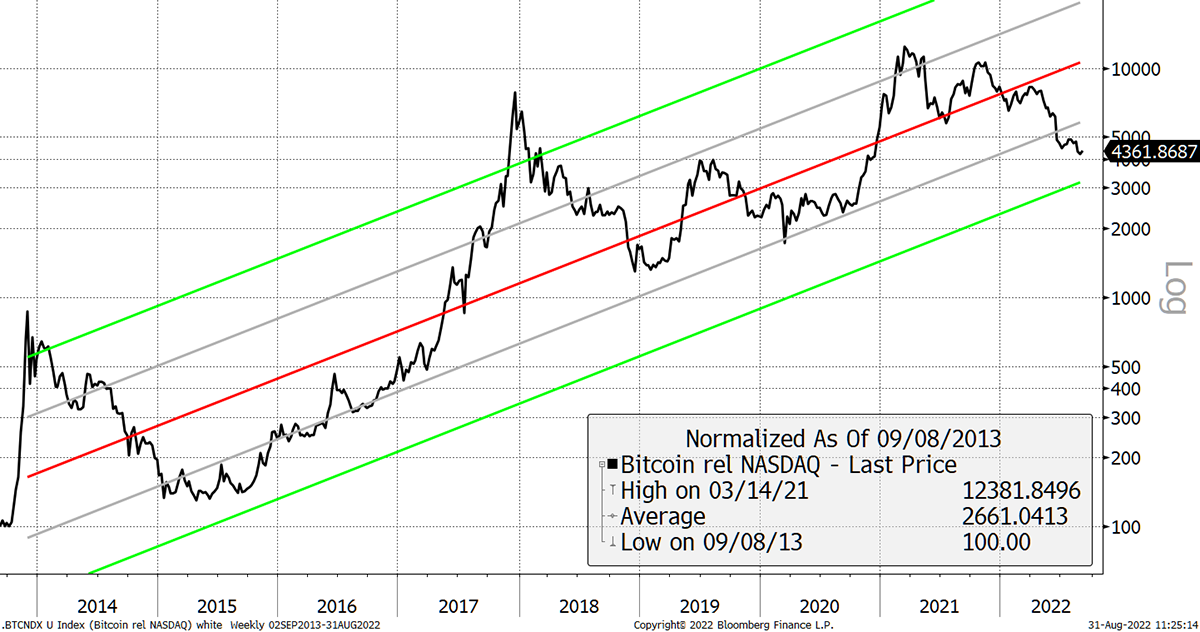
Source: Bloomberg
Over the years, the underlying bitcoin network has grown massively, but typical of bear markets, it has recently stalled. Now that BitDAQ is clearly in the lower bands, it would be a welcome time to show resilience. If it can, BitDAQ will rise, and correlations will fall.
That combination will be well received by potential investors because they want bitcoin to offer something different, not just be a leveraged bet on the stockmarket.
For that to happen, we need a miracle. The short-term moving average has turned negative, and bitcoin remains in a downtrend. The $20,000 zone is being tested. Fundamentally, we support it, but technically, another challenge of the low remains possible.
Bitcoin one-star trend
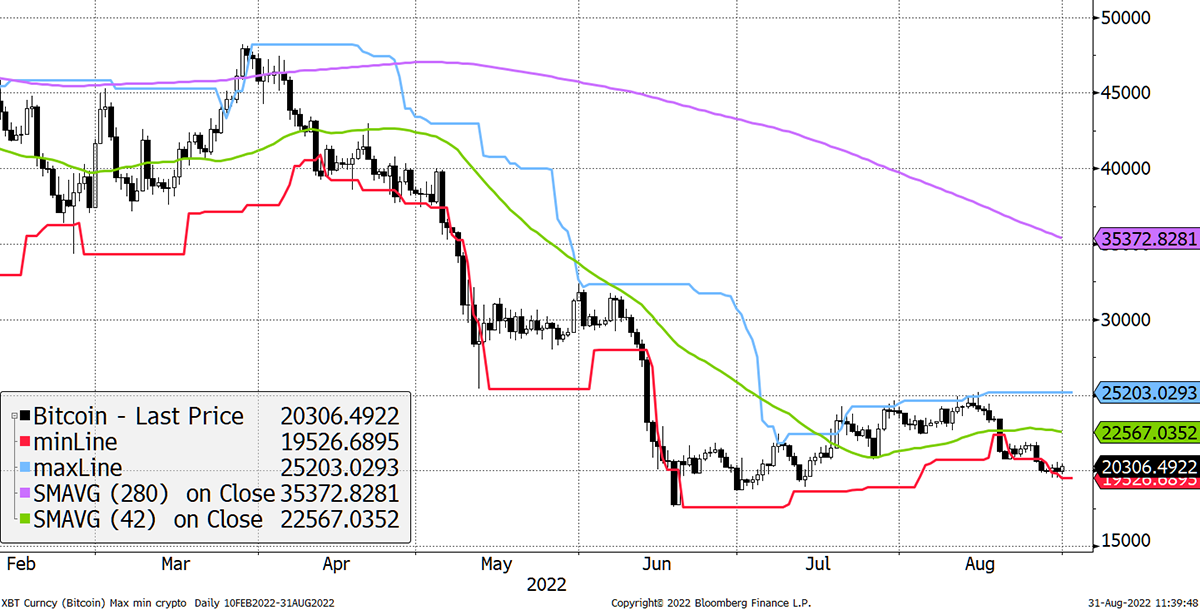
Source: Bloomberg
Looking at the wider crypto space, breadth has deteriorated again. That means the number of tokens in a downtrend has exploded from 6% two weeks ago to 70% today as shown by the red skies.
Weak breadth
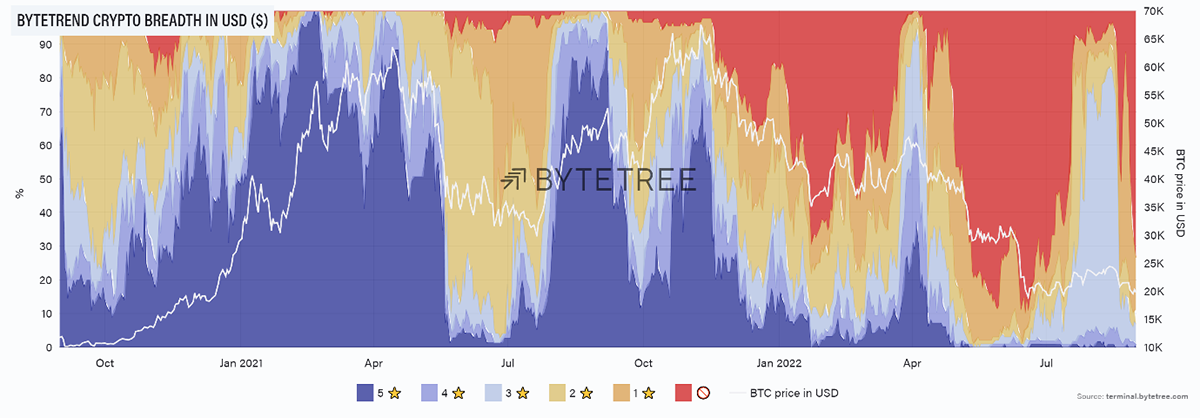
Source: ByteTree. ByteTrend crypto breadth chart, relative to USD, and BTC price in USD, since September 2020.
ByteTree’s ByteFolio publication looks at the leading cryptos with the aim of identifying projects that will beat bitcoin over time. From that perspective, the blue zone is growing, which means despite the technical weakness, there are real projects that are fighting the bear trend, as measured in BTC.
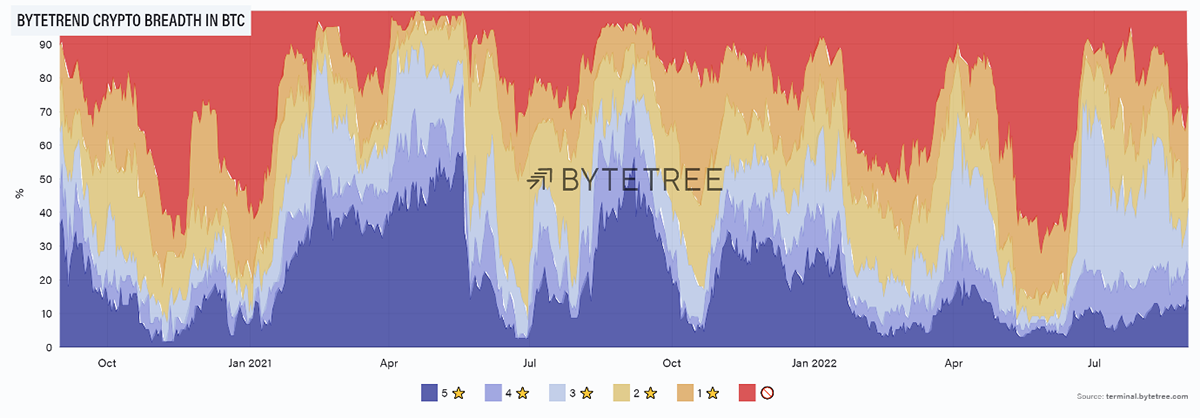
Source: ByteTree. ByteTrend crypto breadth chart, relative to BTC, since September 2020.
You could say it’s bad for bitcoin that certain tokens want to outperform, but I see it the other way around as it demonstrates this space is real and has great potential when the good times return.
On-chain
By: Charlie Erith
The ByteTree Network Demand Model, which measures the long-term cyclical strength of the Bitcoin Network, remains bearish on a score of 1/6. The model incorporates transaction values, fee levels, velocity of coins in the network and miner behaviour to establish whether we are in a bull or bear phase. When network activity picks up and the signals are all turned on, the model will tell us. At the moment, it’s telling us to remain cautious.
Not that the miners are taking any notice, mind you. Somewhat counter-intuitively, they appear to be opening the throttle and adding computing power to the security of the network. You can see this from the recent reduction in block times to less than 550 seconds (the target is 600 seconds).
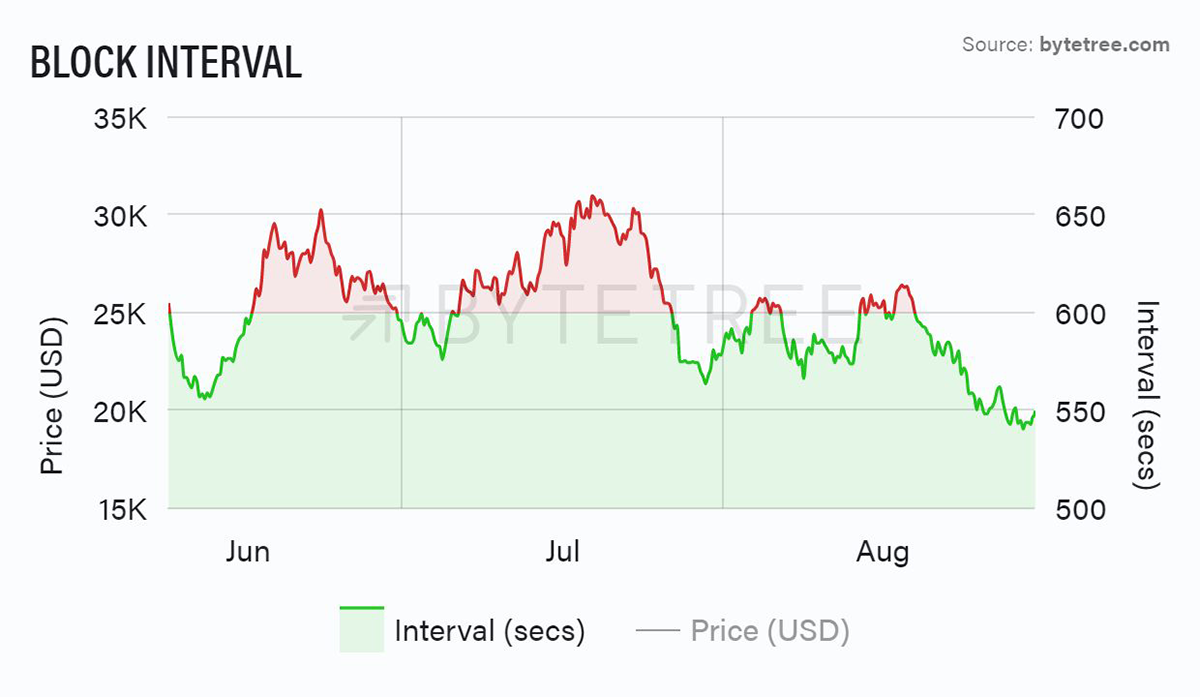
Source: ByteTree. Bitcoin Block Interval over the past 12 weeks.
This has resulted in a sharp increase in “blockchain difficulty” to bring the system back into equilibrium.
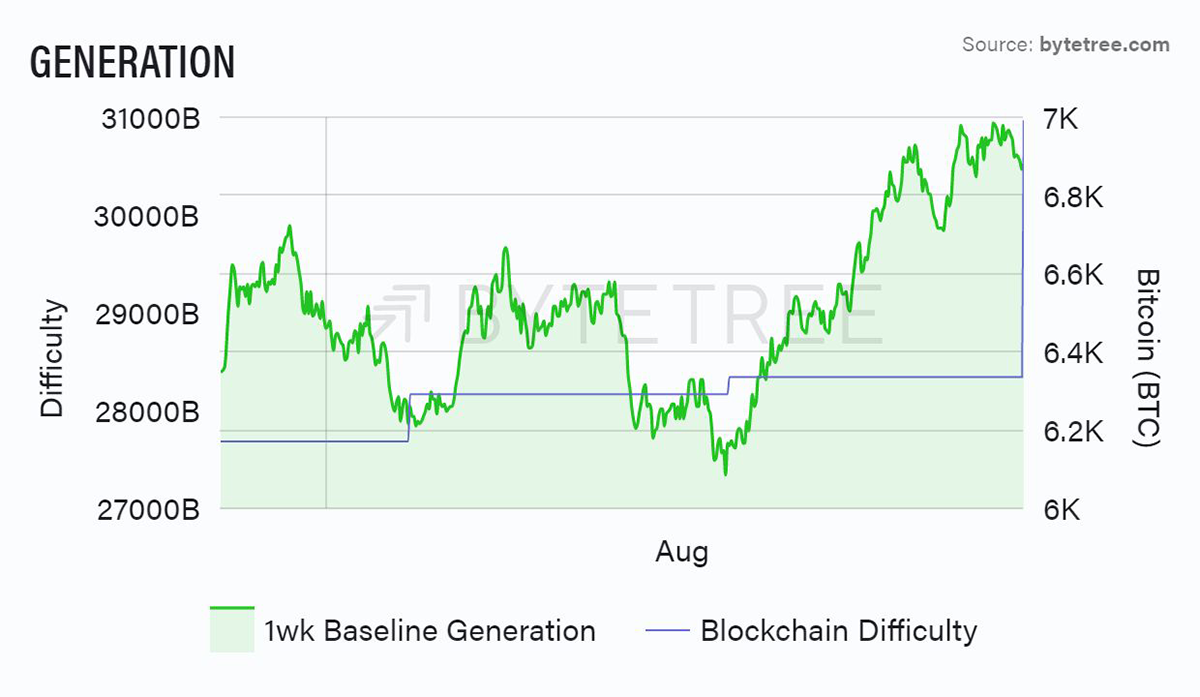
Source: ByteTree. Bitcoin Generation and difficulty over the past 5 weeks.
Furthermore, the number of “unspent” coins (those that have been minted but never transacted) has risen in the second half of August, suggesting that miners are in no hurry to sell at these levels, which is why we see inventory rising.
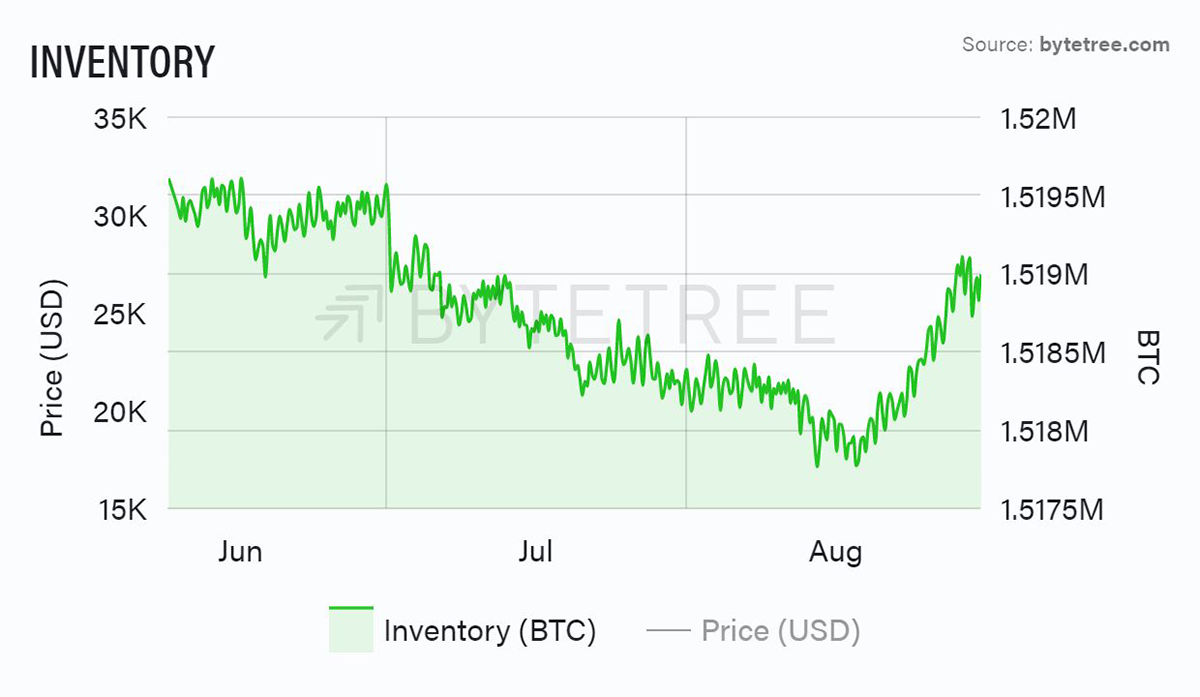
Source: ByteTree. Bitcoin (miner) Inventory over the past 12 weeks.
Interpretation of this behaviour is tricky. While it’s great to see the mining community demonstrating such faith in the network, they could be holding back sales because they’re worried the market doesn’t have the strength to absorb new stock. On the other hand, they could be taking a more constructive view and are building inventory in the belief that this is a good moment to be accumulating.
Ultimately, what we need is a recovery in demand. In this regard, the last few days have offered encouragement. Activity has notably picked up, as shown below. Perhaps it’s a “return-from-holiday” effect, but the August apathy appears to be over, and some sizeable blocks have been absorbed by the market at current levels (as shown on the Reference chart on the Terminal). You can follow the data on the site under the “Charts” heading.
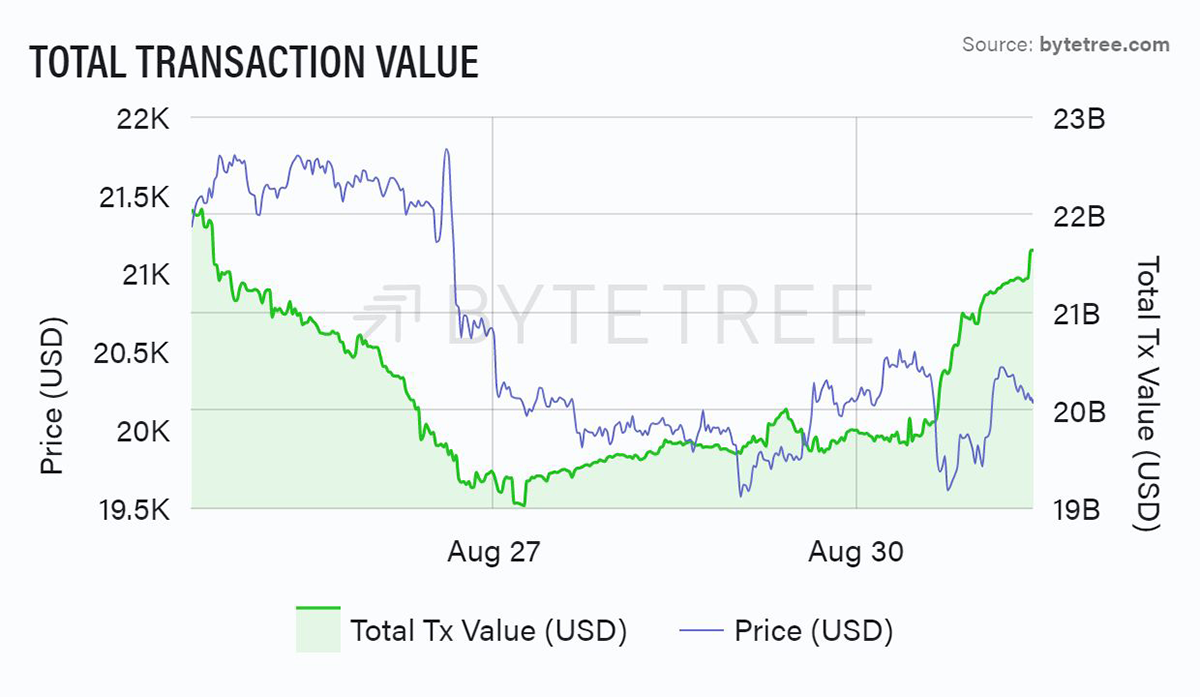
Source: ByteTree. Bitcoin Total Transaction Value over the past week.
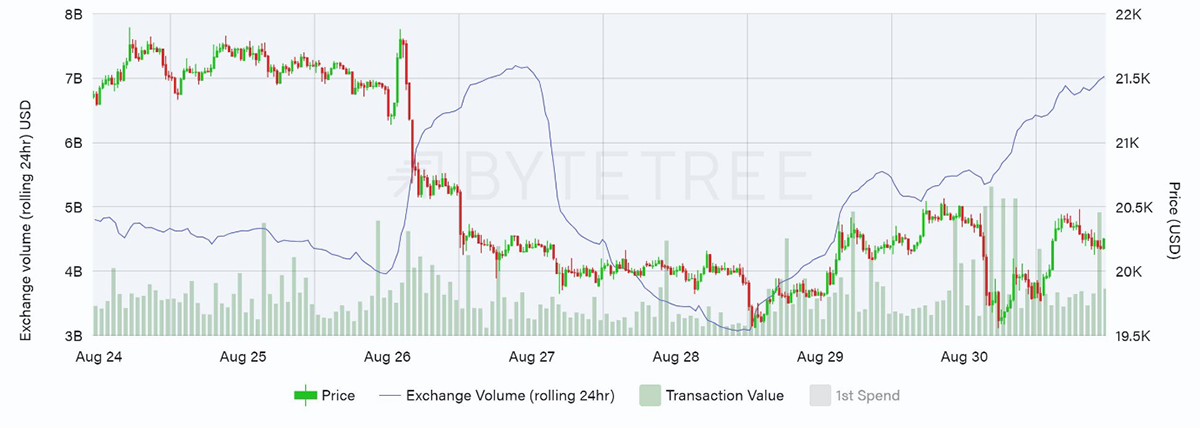
Source: ByteTree. Bitcoin exchange volume, transaction value and price in USD, over the past week.
On our longer-term valuation measures, bitcoin remains cheap. In the chart below, we compare today’s multiple-to-transaction volume (NVT) to the 2-year average, which shows that we are still at a substantial discount. However, once again, we need a pickup in transaction activity to spark a price recovery, or the fair value will continue to decline.
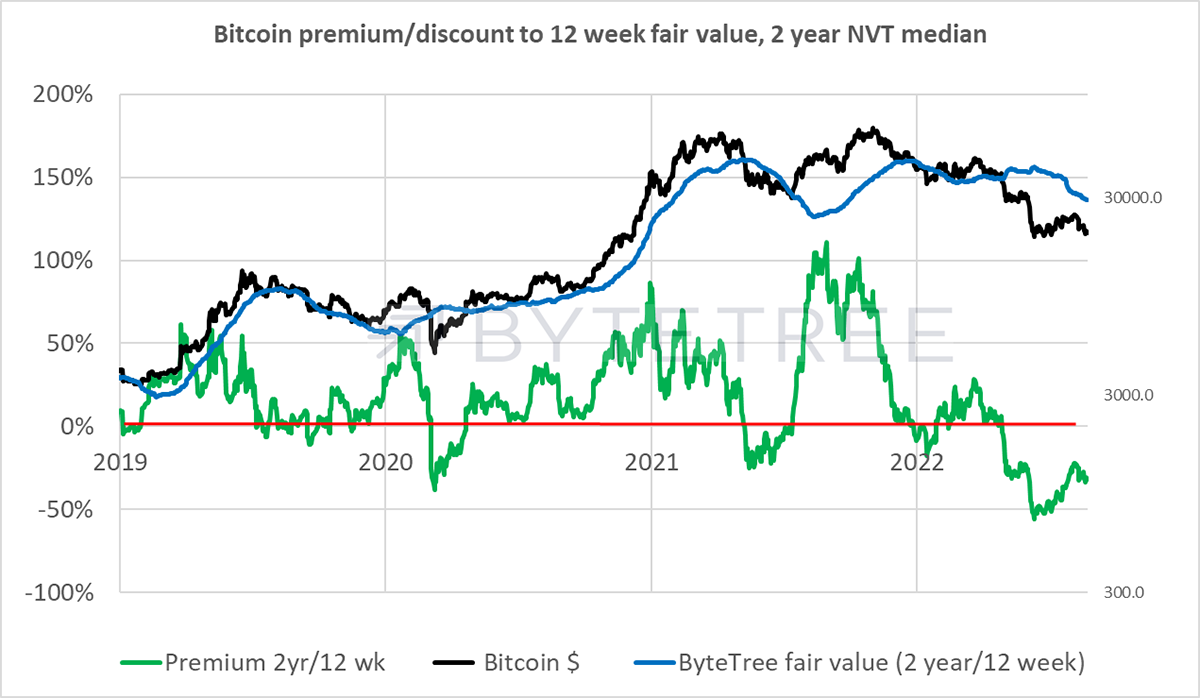
Source: ByteTree
Macro
By: Charlie Morris
The macro backdrop remains tough. Last Friday, the Fed Chair, Jerome Powell, in his annual Jackson Hole speech, reiterated his determination to fight inflation. It was a reminder that they would hike rates despite their negative impact on asset prices, which, so far, has been nothing less than brutal.
A sharp rise in real rates can be painful
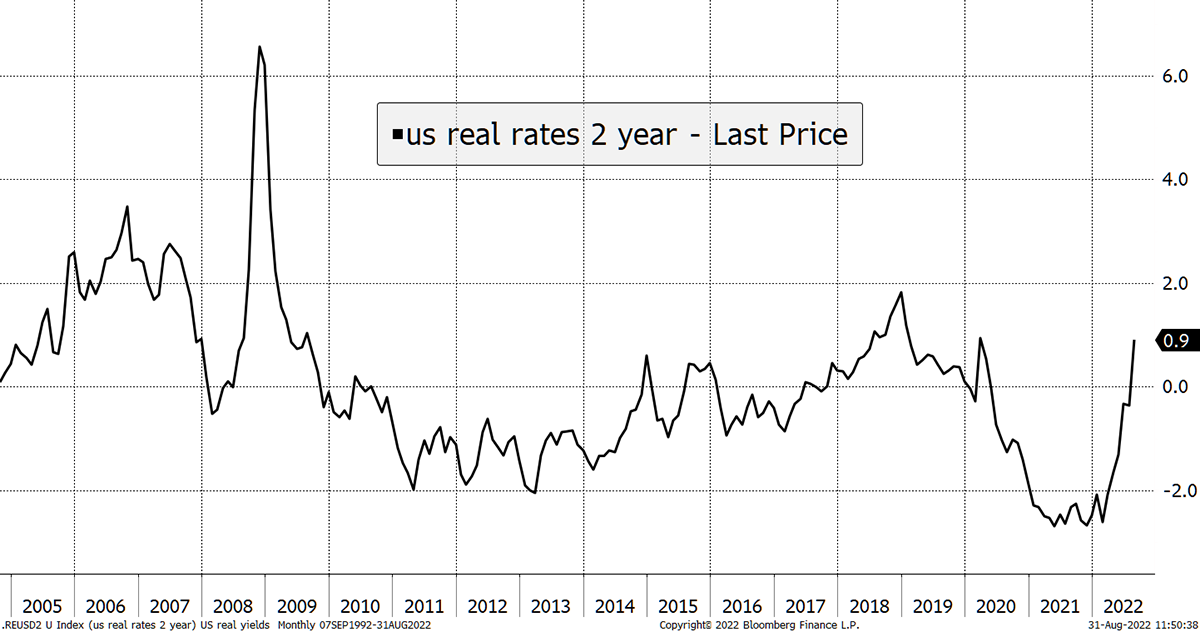
Source: Bloomberg
The 2008 crash saw a surge in US real rates (2-year bond yield less 2-year inflation expectations) as inflation went negative. Bitcoin wasn’t around then, but it would come along soon after.
Despite the norm of almighty rallies, bitcoin’s worst years came about in 2014, 2018 and 2022 - all times when real rates have surged.
You can read the spike in real rates as bad news or see the glass as half full. Assuming Powell isn’t trying to recreate 2008, most of the rise is surely behind us, as a 3% hike in real rates is huge by historic standards. It can’t be that long before the Fed’s job is done, or at least nearly done, although things can still get worse before they get better.
This impacts the dollar, and when it rises too aggressively, it puts downward pressure on the economy and asset prices.
Dollar peaks soon
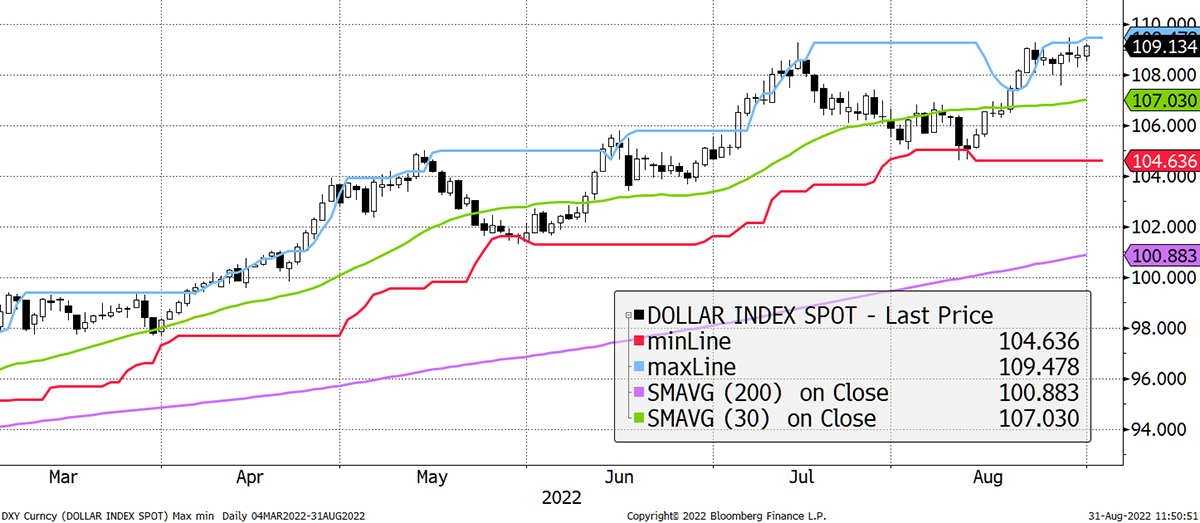
Source: Bloomberg
A few things could see the dollar soften. Higher interest rates in Europe are possible, but Cristine Laggard is no Jerome Powell. More likely, we see an easing of natural gas prices, which are crushing the economy. That would bring down inflation and see real rates in Europe move sharply higher, thus reducing the spread. The fact that politicians are now begging the oil companies to increase production, whereas a year ago they wanted to vilify them, is huge progress.
The mere sign of intent can move markets, and North Sea gas is already down 26% in two days simply because the conversation has begun. Long may it continue.
European gas prices are painful
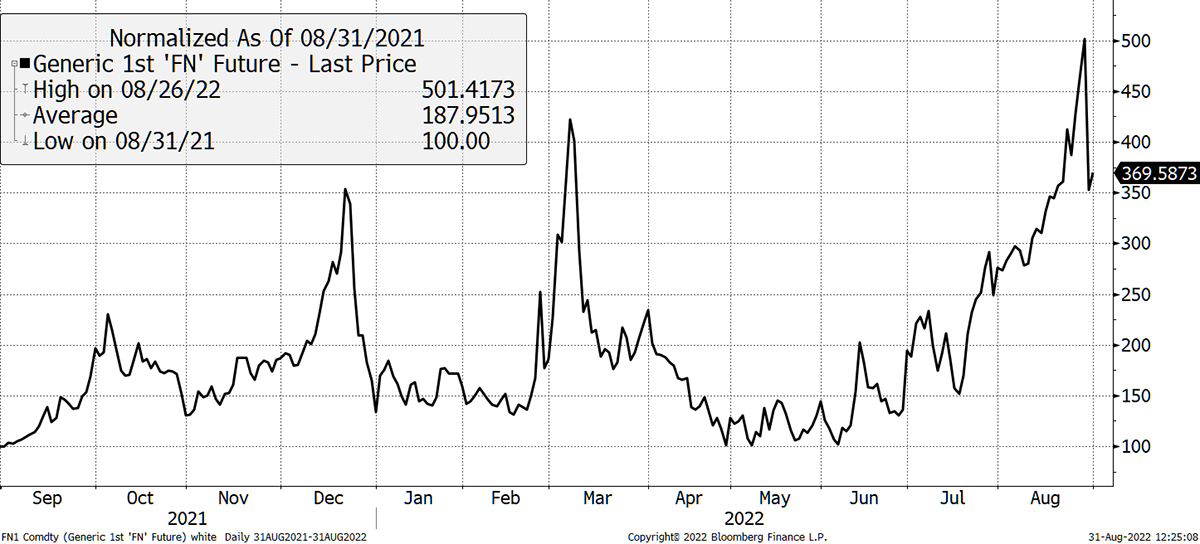
Source Bloomberg
Investment Flows
By: Charlie Erith
Bitcoin fund holdings remain steady, while Ethereum fund holdings seem to have belatedly reacted to the recent price correction, and we’ve seen recent small outflows.
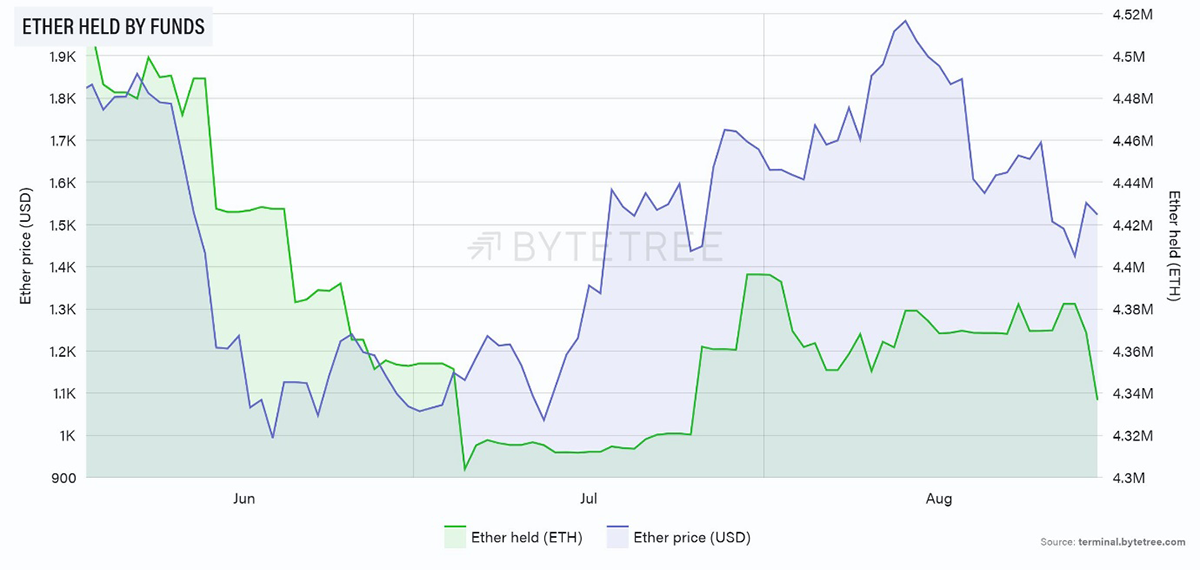
Source: ByteTree. ETH held by funds and price of ETH (USD) over the past 12 weeks.
The 2-year bitcoin flows chart is arguably useful as a contraryindicator. The last period when it dipped into the red was in August 2021, which marked a great trading opportunity, but in truth, it’s hard to make a buy case based on this alone because the data series is so short. In early 2021 outflows were a useful leading indicator that the bull market was running out of steam. We really need to see flows going positive to establish a more constructive case for bitcoin on this metric.
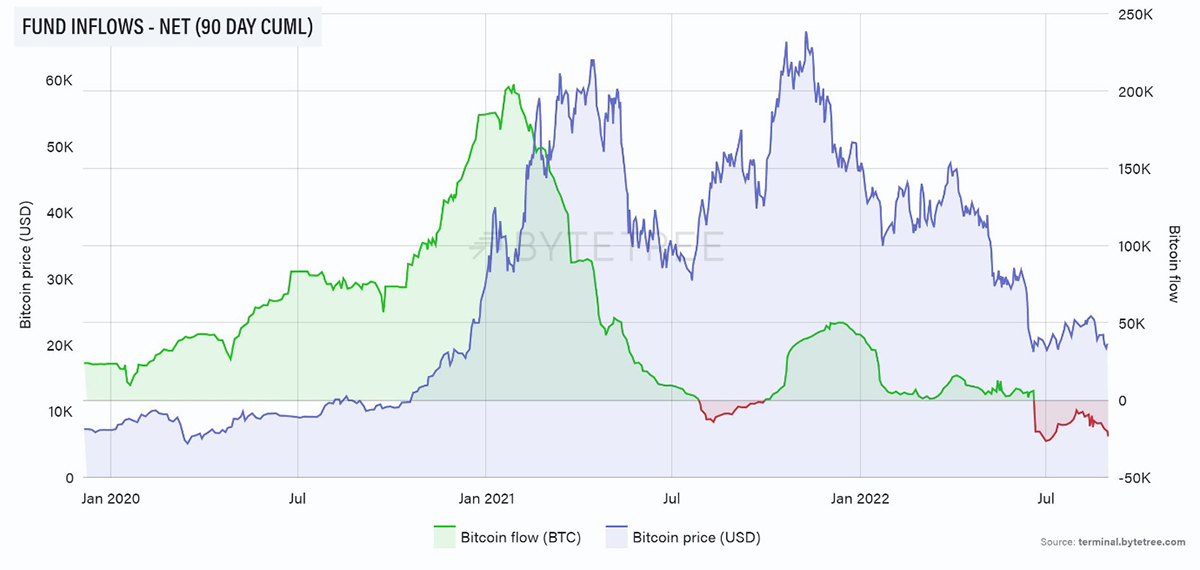
Source: ByteTree. Bitcoin net fund inflows (90-day cumulative) and the BTC price (USD), since January 2020.
Cryptonomy
By: Charlie Erith
We urge readers to acquaint themselves with the Lightning Network. This is a scaling solution for bitcoin, which has the ability to transform the utility and adoption of bitcoin.
We hear a lot about scaling solutions in the world of Decentralised Finance (Defi), particularly around Ethereum. But bitcoin is still widely interpreted as a form of “digital gold”, whose ultimate utility is as an option on a long-term store of value, and that’s it. While we would agree with this, the potential beyond that is colossal because the technology is being built to make it so.
To get into the weeds of this, grab a coffee and read this superb piece by Lyn Alden, “A Look at the Lightning Network”.
The first stage in Bitcoin’s evolution has been to gain widespread acceptance as a store of value, distinct from other assets, be they crypto or “real world”. This is a long journey, and it has to be slow because bitcoin has to demonstrate its consistency and reliability. It has to remain provably decentralised and unequivocally secure over a period of time to establish credibility. Issues around transaction speeds, block capacity, price volatility and so on are secondary to this primary goal.
Once established, the crypto universe will have a bearer asset that underpins it. For a genuinely decentralised financial system to succeed, this is an absolute prerequisite. But once established, the multiple transactional layers on top of it can be created. This is what the Lightning Network sets out to achieve.
In a sense, the Ethereum ecosystem has set out to be the acceptable face of crypto. It is clearly constructed to interact with traditional industries, financial or otherwise, and will have to embrace their rules. We know, for example, that Gary Gensler at the SEC sees all crypto assets apart from bitcoin as securities. But in so doing, it may compromise the principle of decentralisation that crypto, at its core, seeks to address. Bitcoin, by contrast, is building something of genuine independence, but like anything worthwhile, it cannot be achieved overnight.
The foundations that bitcoin is establishing - as a genuinely secure and decentralised store of value - are designed to be on rock and not sand. This means that layers built on top will ultimately grow and thrive in a way that is both secure and exponential. The Lightning Network provides clues into how that next step will happen. If you’re playing the long game in crypto, it’s worth finding out more.
Summary
At ByteTree, we believe bitcoin is underpinned at the $20,000 level but acknowledge that the trend is weak and the macro is harsh. What’s needed is peak macro carnage, which will ease correlations. At that point, bitcoin will be able to differentiate itself and find its own path.

