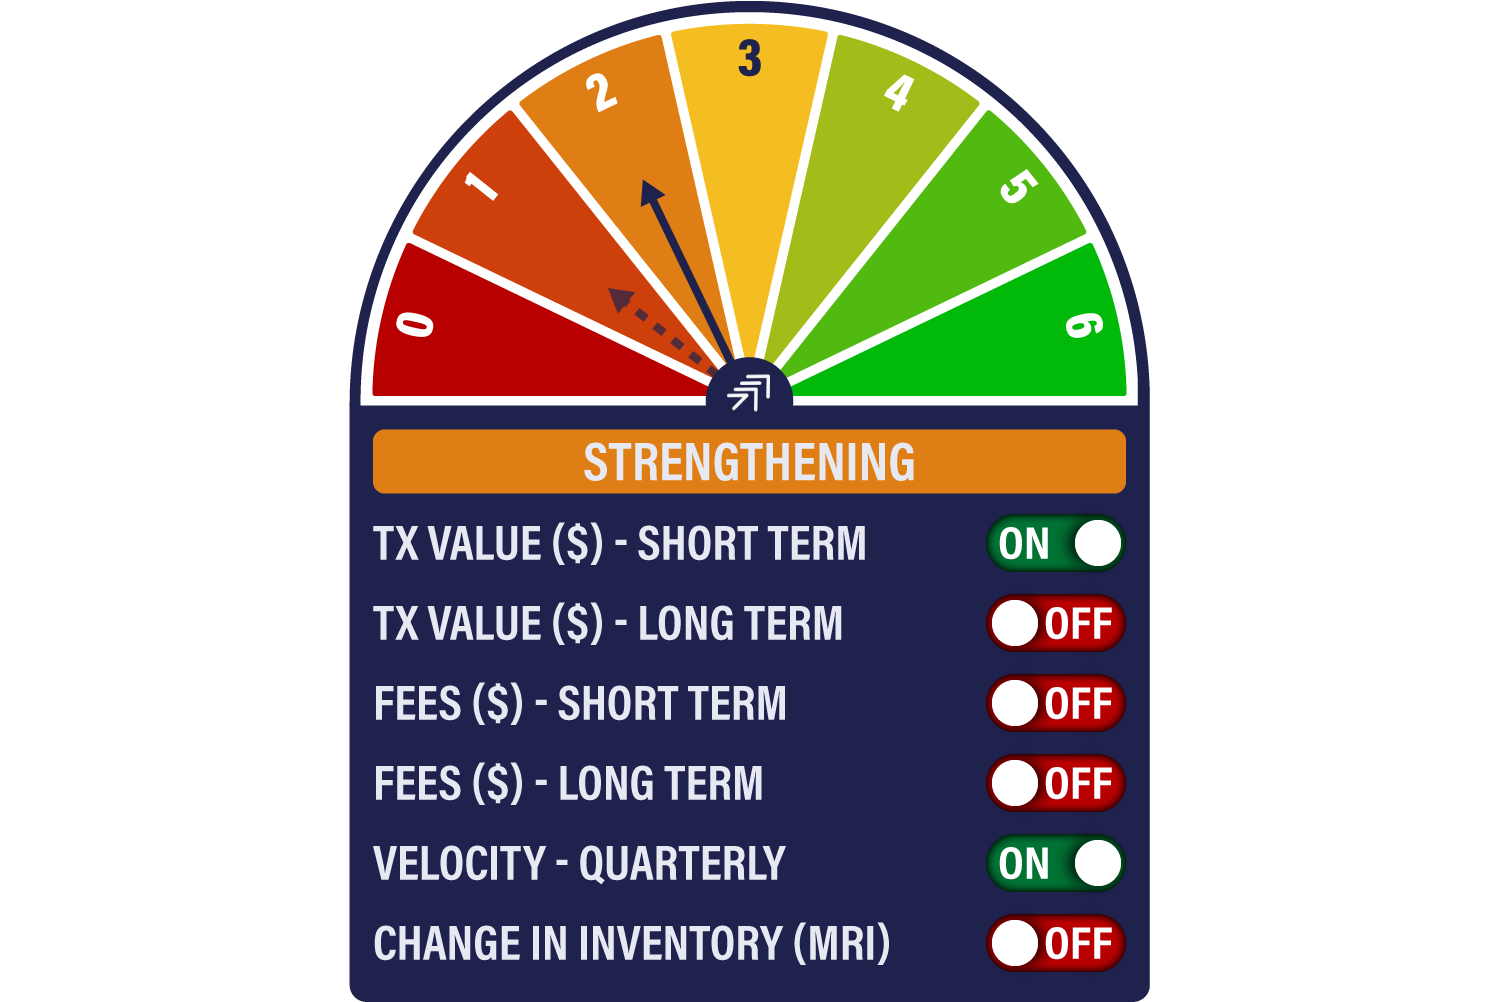
Bitcoin Network Demand Model
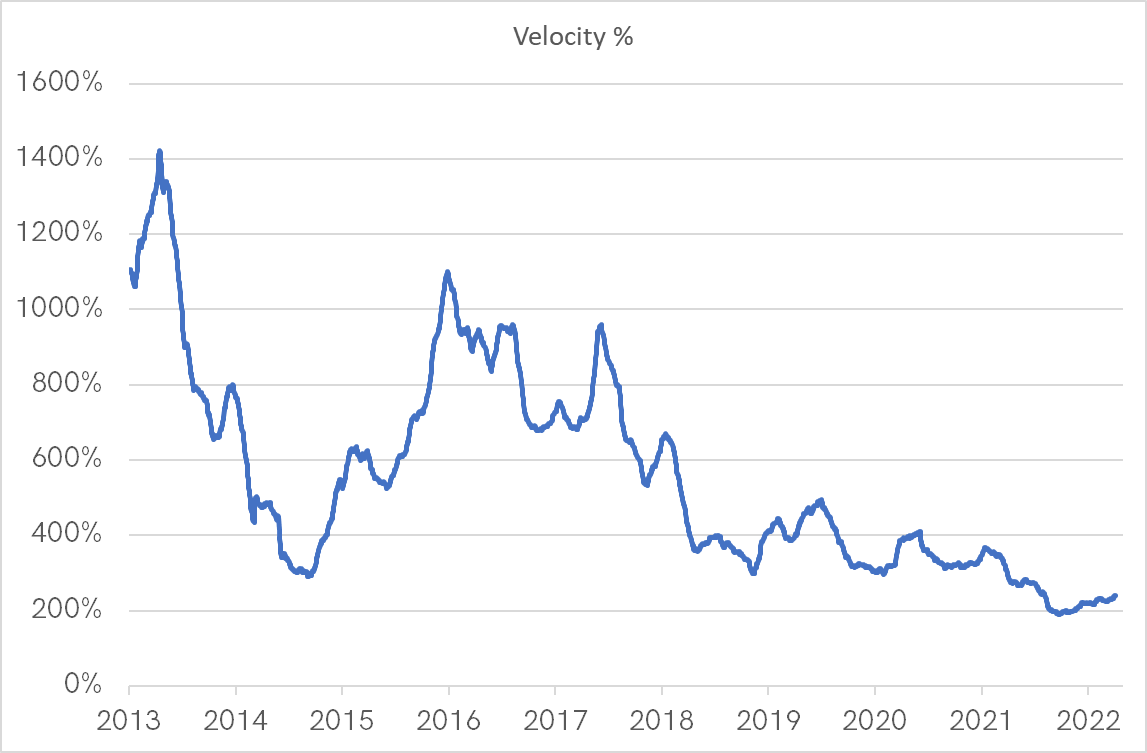
Another leap forward for the Bitcoin Network as the Network Demand Model rises from 1/6 last week to 2/6 this week. The new signal comes from a pickup in velocity, a non-price measure of network strength. A reading of 400% is basically telling you that an average bitcoin spins around the network four times a year. Of course, many coins don’t move at all, which means others are moving like grease lightening.
Sometimes, the price rises and velocity falls. At other times, the price falls and velocity rises. In both cases, the blockchain is adjusting so that the same amount of value can be transferred in response to the changes in price. In these cases, the network is neither growing nor declining but neutral.
The worst possible outcome is falling velocity with a falling price, which we saw in the great bear markets of 2014 and 2018. It is simply telling you that the network is in sharp decline, and you had better sell up while you still can.
The best signals were rising prices aligned with rising velocity, last seen in style back in 2015/6, with a hint in 2019. Velocity is picking up along with price, which is generally a very positive sign that the network is well underpinned.
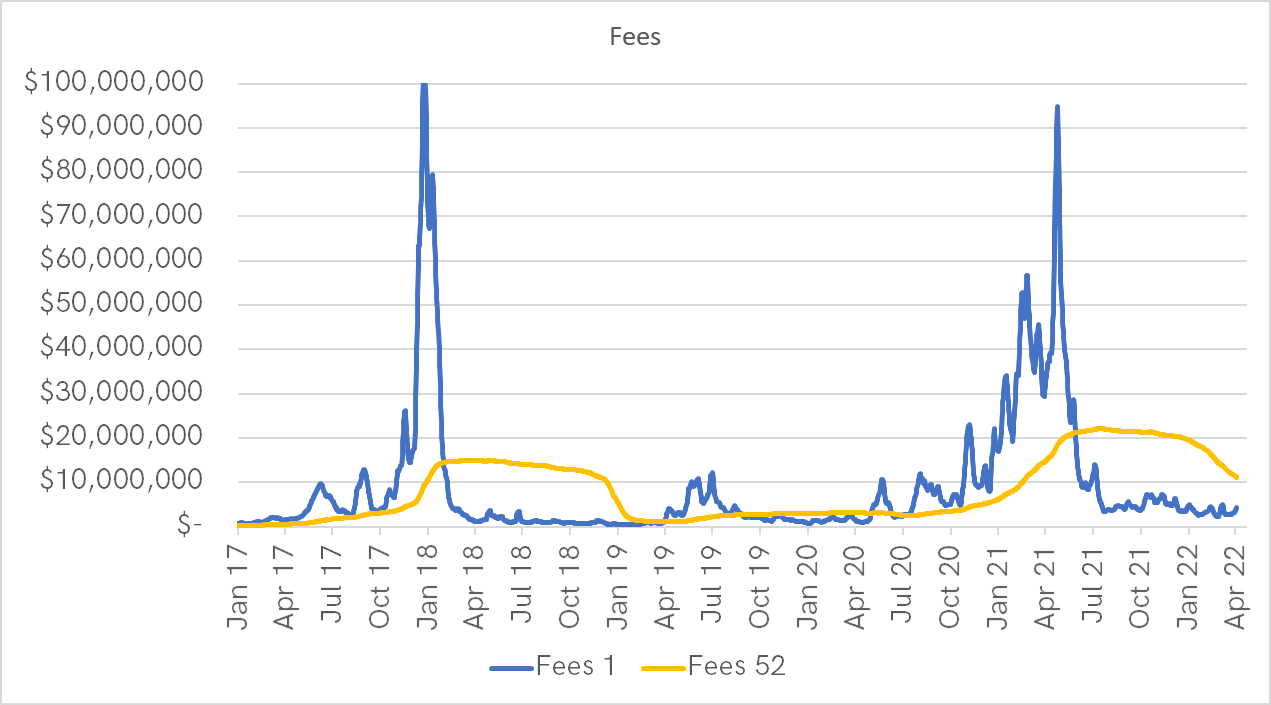
The Network Demand Model will improve over the coming weeks and months but has been caught out by the collapse in fees. In past cycles, this sort of collapse would have led to a price collapse. This time it didn’t. The damage caused by the Chinese mining ban, which came at a similar time to the SegWit implementation, led to increased blockchain efficiency.
The collapse in fees was so vast that it takes time for our 52-week moving average to readjust. With the Chinese mining ban nearly a year ago, it won’t be long, before our fee models will turn positive once again.