Bitcoin Network Demand Model
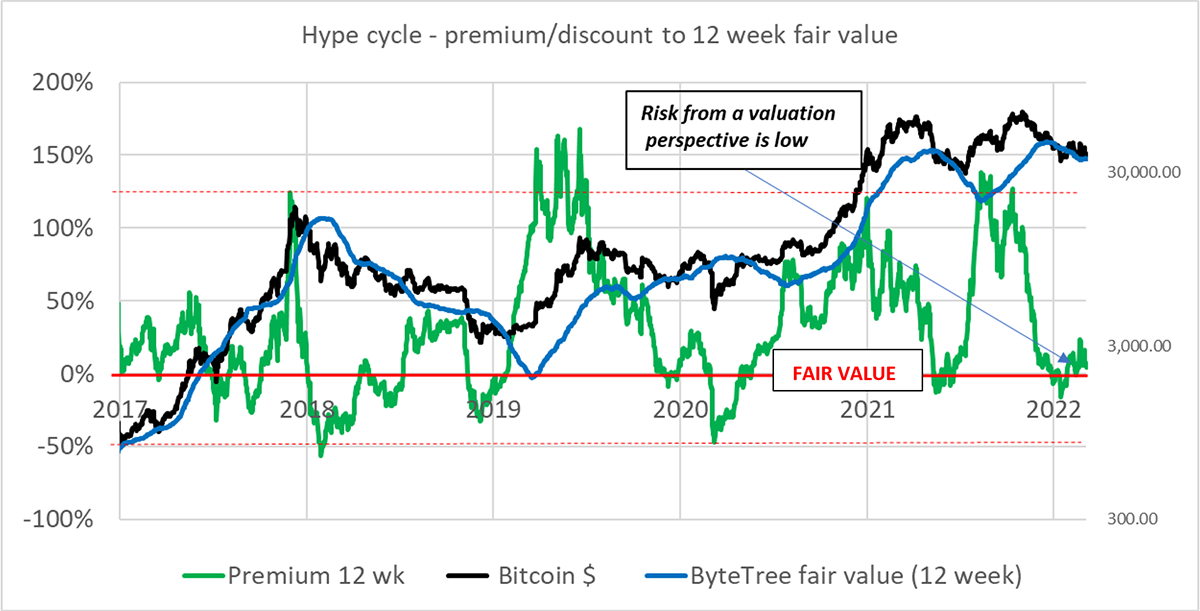
There is no change in the score this week and very little in the on-chain data that is out of the ordinary. With the price trading in a range, there are very few clues as to where the next big move is coming from. Velocity measures are subdued, but the patterns from last summer may give us some insight from a behavioural perspective. Miner selling is starting to look like a heartbeat monitor. Risk from a valuation perspective is low.
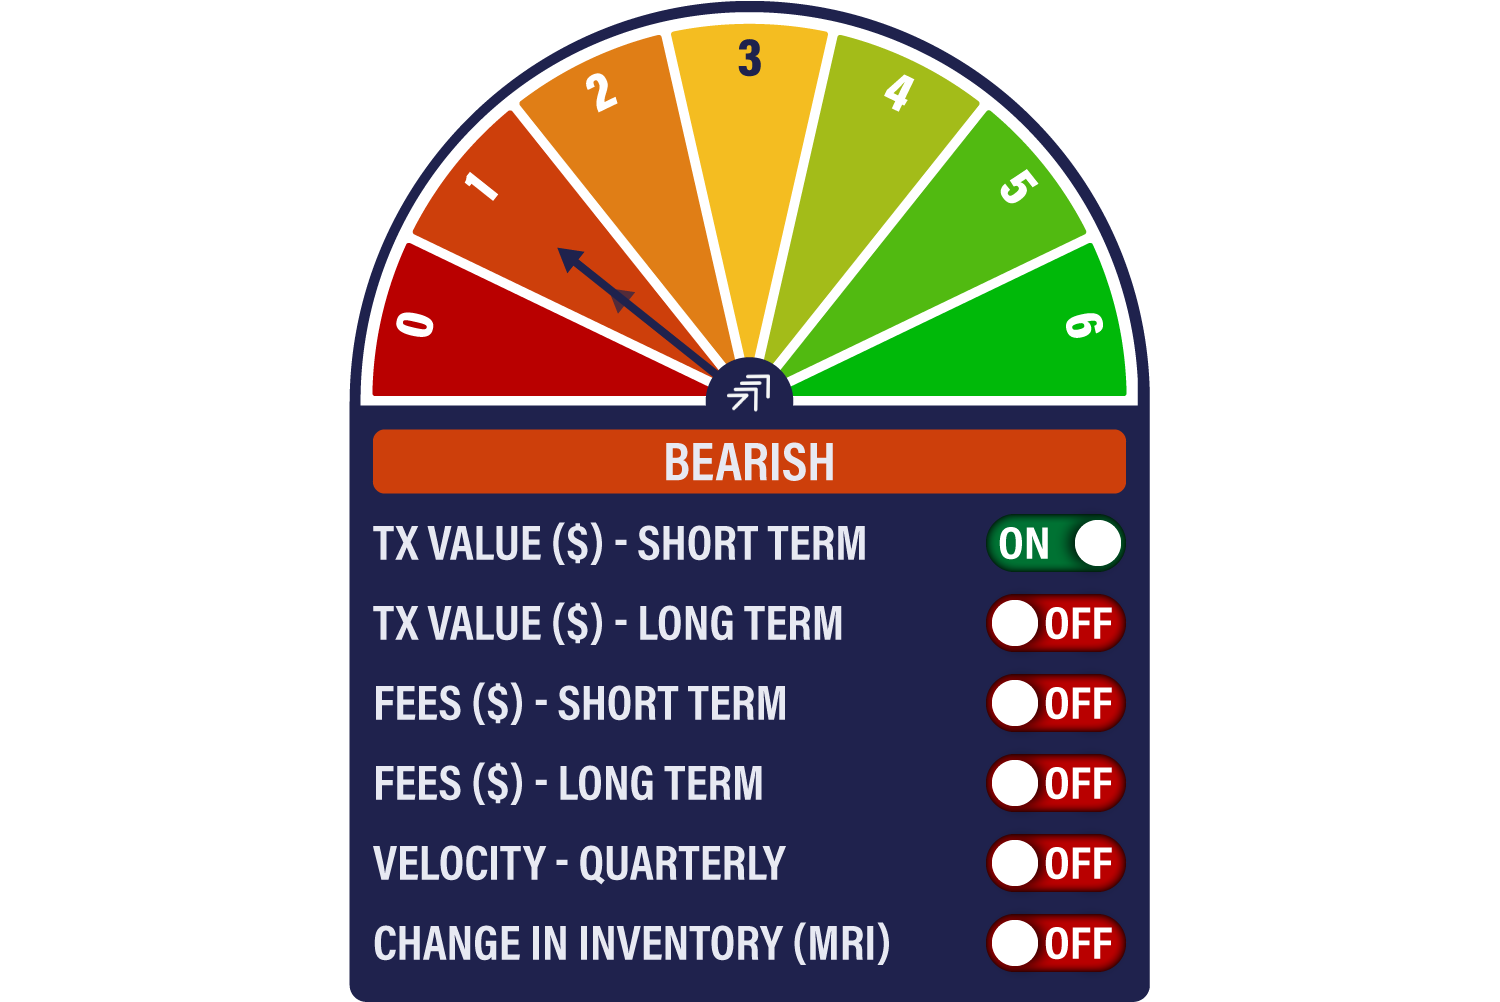
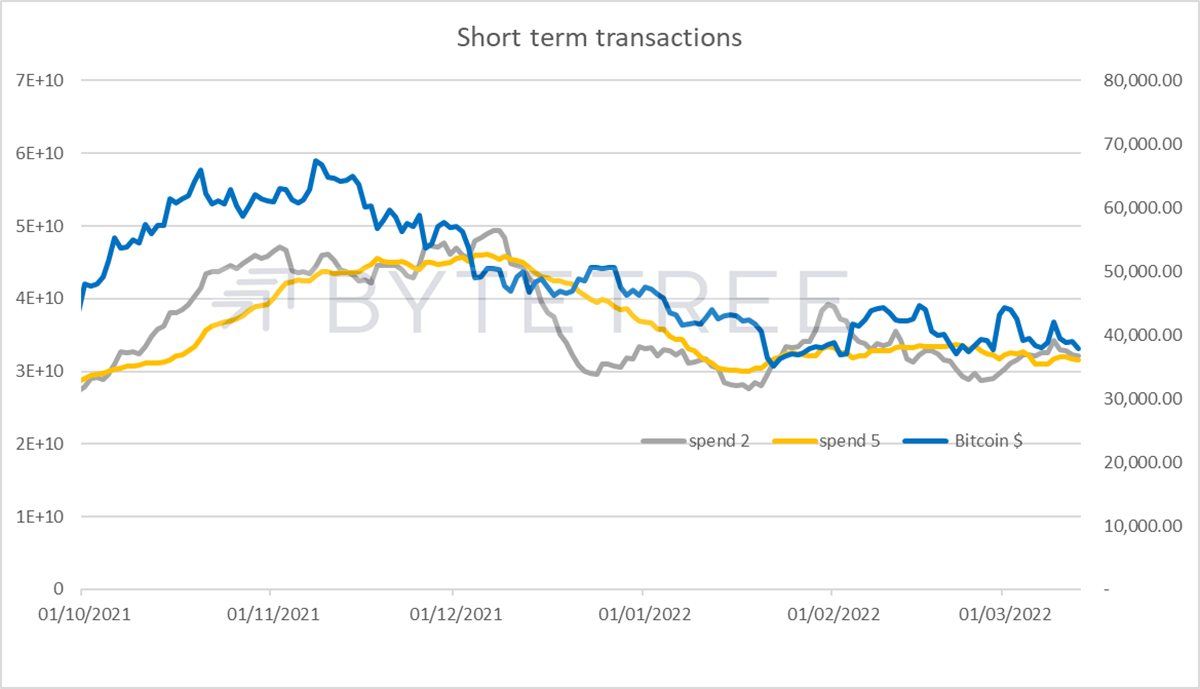
“Short term transactions” is the only signal that remains on this week. Although, without a recovery in activity, even that might not last too long. It’s not all doom and gloom. If we look at the 2- and 5-week transaction measures in the chart below, at least they have both been rangebound since the start of 2022. This is consistent with our valuation methodology and the price trading in its current range. There might not be much to shout about but it suggests the risk of owning bitcoin at these levels is low, as we’ll discuss later.
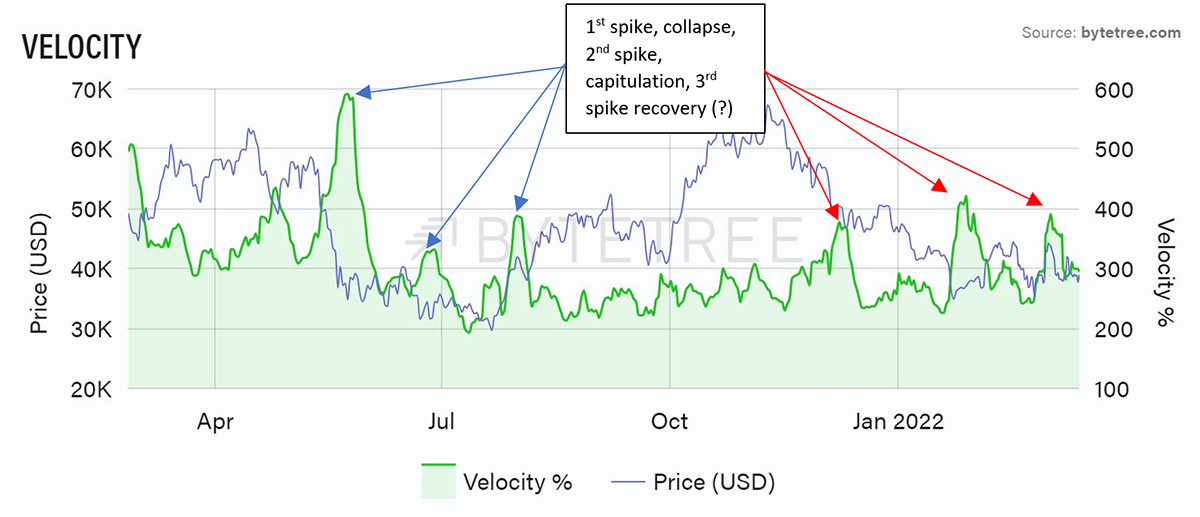
This is further reflected in the ByteTree velocity measures. Velocity is defined as the “speed in which a coin moves around the network”. Historically, this is a measure that has been a reasonable signal of climactic behaviour, either on the sell or buy side.
Last year saw two velocity spikes (which I’ve named “collapse” and “capitulation” in the chart below) during the April-June sell-off, followed by a velocity spike which marked the start of the autumn recovery. Could the pattern be repeating this time?
It is also worth reflecting that the Network Demand Model uses a long-term velocity calculation, which takes a 12-week measure and compares it to a 2-year median. Therefore, the huge post-halving levels of activity have a distorting effect on the number.
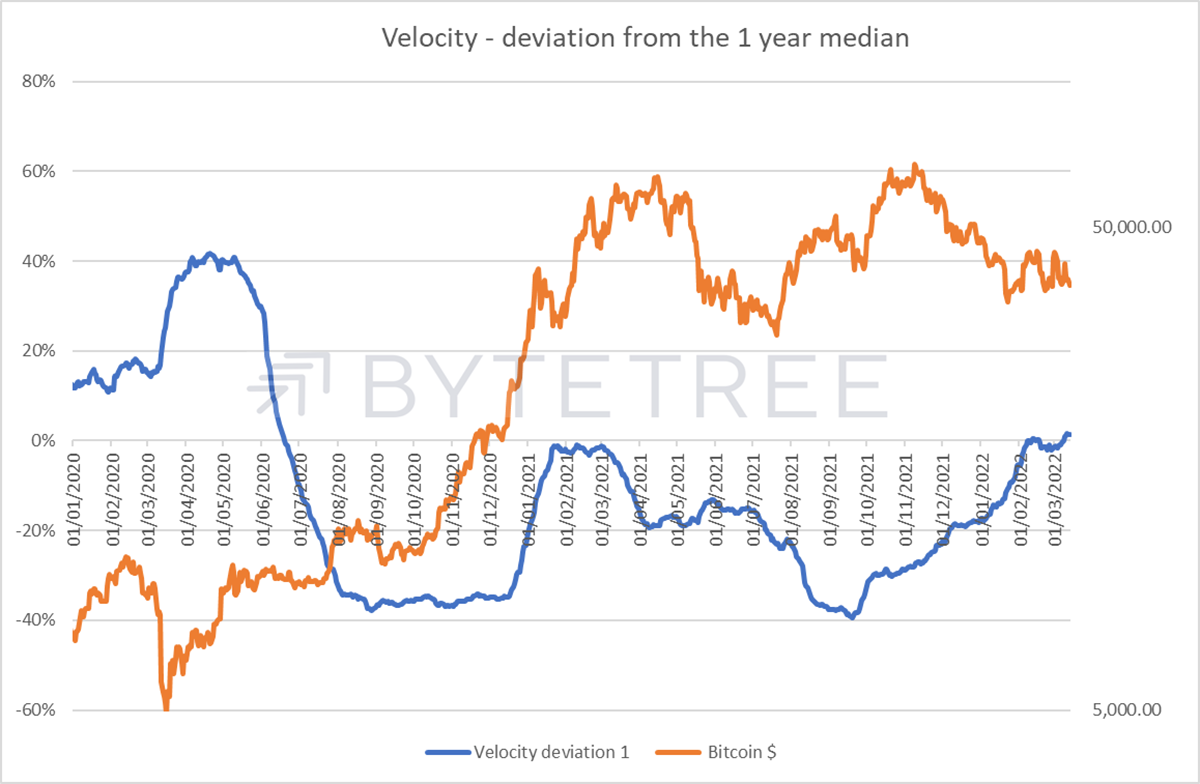
By way of a little cheeky experimentation, if we reduced the denominator to a 1-year median (see below), velocity would be trading bang in line with its recent history and at a level where the market consolidated in early 2021 before shooting higher. Arguably, the bitcoin universe has changed beyond all recognition over the last 18 months, so a more recent comparison set can be seen as legitimate.
This squares with our valuation work. As you can see in the following chart, if we look at the current activity and compare it with the 2-year median, we are in a comparatively low-risk environment, with bitcoin’s price trading at close to fair value. By the way, if we take a 1-year median, bitcoin would actually be at a discount to fair value.
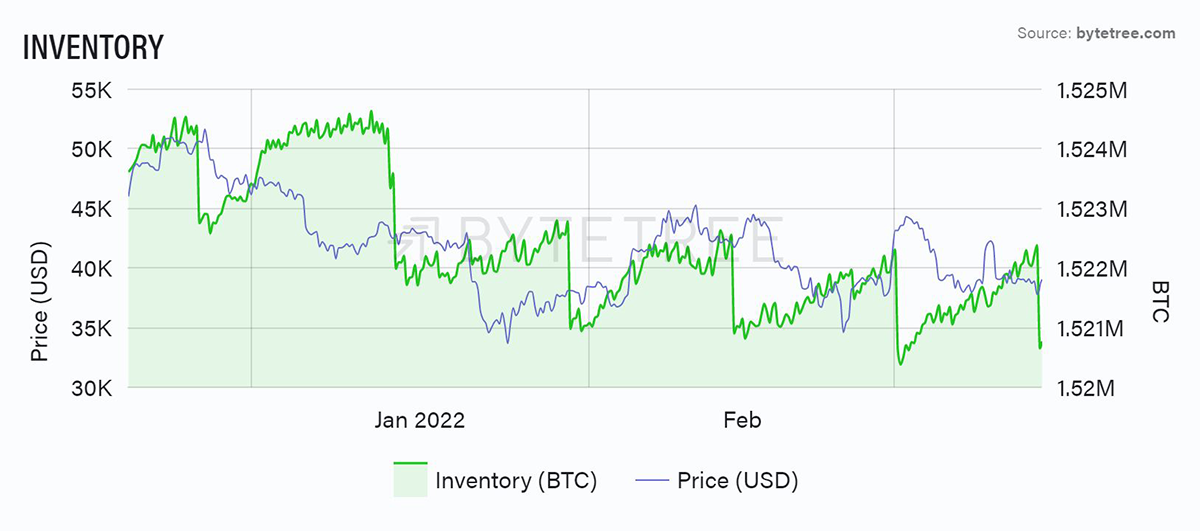
Finally, a note on miner selling. We identified a pattern of regular selling a while back. Initially, the market seemed to stutter every time a large block appeared, although with so much else going on it’s hard to say it was causal. Nonetheless, the pattern has become so regular it’s looking like a heart monitor. As a result, it’s probably reasonable to say the market is aware, and future spikes in miner selling are less likely to have a sustained price impact. However, we would be happy to see “unspent” inventory levels break to new lows. An overall supply squeeze would be bullish.