

ATOMIC 33
ETH has seen 2.5% of outflows from the collective investment funds in contrast to BTC, which has seen 1%. This reaffirms the simple idea that BTC benefits from a selloff, at least in relative terms, as investors would rather hold BTC during times of uncertainty.
ByteTree ATOMIC
Analysis of Technical, On-chain, Macro, Investment Flows and Crypto.

Highlights
| Technicals | Capitulation with some bullish signs |
| On-chain | Velocity spike |
| Investment Flows | Stable in BTC, outflows in ETH |
| Macro | Bullish but risk assets under pressure |
| Crypto | Sluggish |
Technical
In the whole crypto space, as shown by ByteTrend, there is just one token with a five-star trend, Secret (SCRT). Breadth has deteriorated, and in the top 15 tokens, there’s one three-star trend remaining, with 7 in downtrends (0/5). ETH has one star, which means the 200-day moving average is still rising, but that will not last for long unless the price firms up soon. Crypto is taking a well-deserved break.
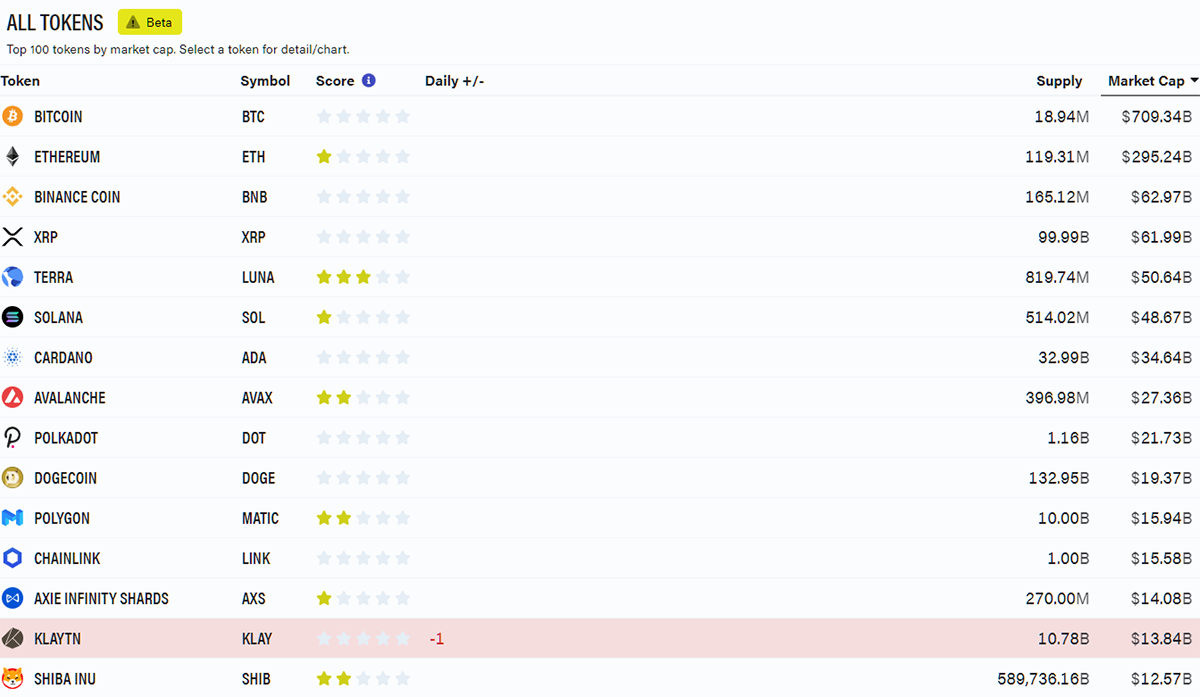
Source: ByteTrend
The purpose of ByteTrend is to identify the trends and the daily changes in trend. It saves time having to plough through hundreds of charts in search of something on the move. Moreover, seeing what is getting stronger and weaker helps investors look in the right places and provides an overall market view.
Currently, there are few positive crypto trends. The next time we see more upgrades than downgrades will help to confirm a new market rally is on the way. Better yet, the early upgrades will likely turn out to be some of the strongest moves in the subsequent bull run.
ByteTrend doesn’t show live prices because the analysis of the trend is over the prior year rather than the last 24 hours. It is not there to assist with trading but rather to help identify trends. This is an important point and hugely misunderstood in technical analysis.
Time zones
Another way of looking at trend is by time zone. I have split the world into Asia, Europe and the Americas by price performance. Since November, an investment during Asian hours has fared worst. During American hours, the price has held firmer but has still been lacklustre. European hours have been flat.
Bitcoin weak during Asian trading
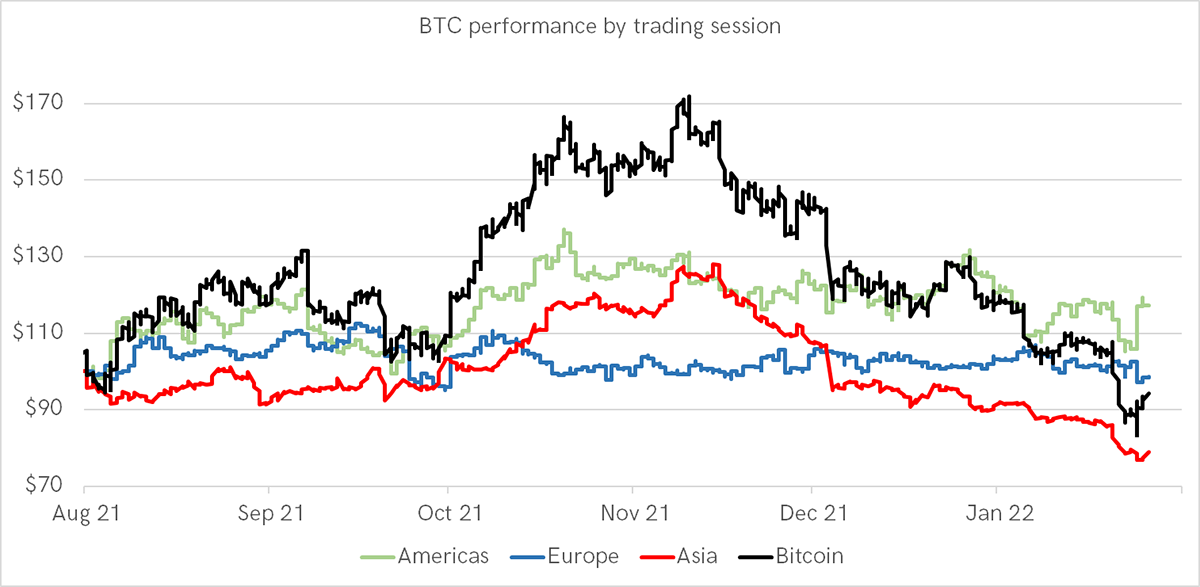
Source: Bloomberg. Bitcoin trend by time zone since Aug 2021.
I last published this in the May 2021 selloff. Once again, Asian hours had seen the dominant moves, which played host to the majority of the rally. For whatever reason, the price of Bitcoin seems to be heavily influenced by the Asian session.
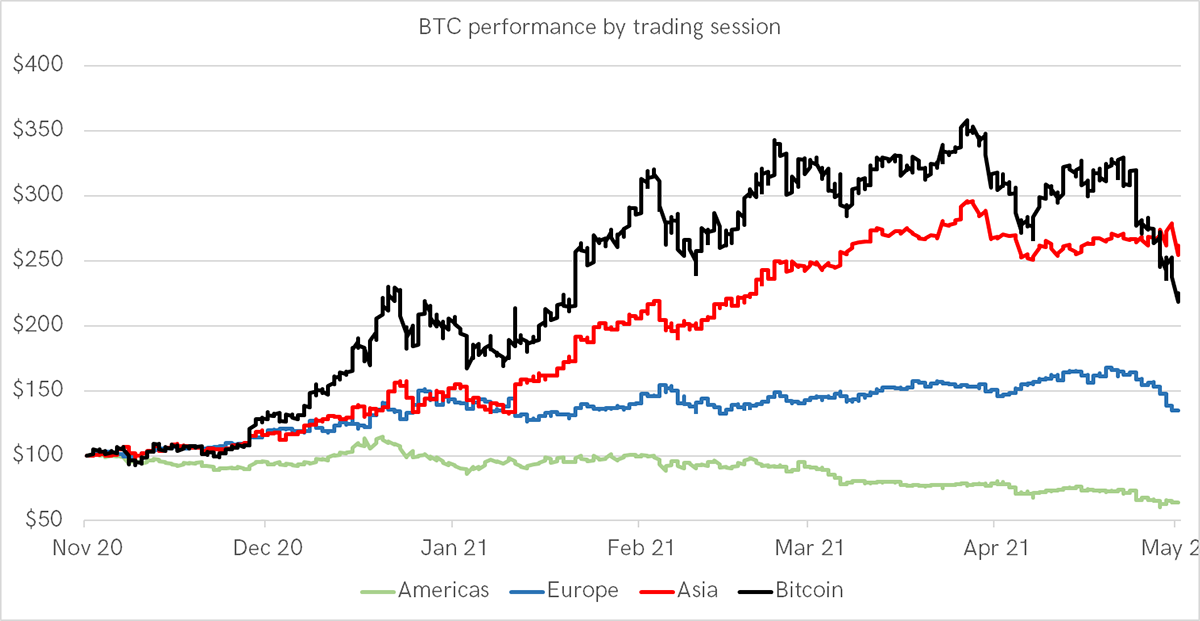
Source: Bloomberg. Bitcoin trend by time zone since Nov 2020 to May 2021.
Bitcoin is oversold
The price of BTC is 24% below the 200-day moving average, which is oversold. At the peak selloff yesterday (Monday), that was 32%. That is severe and ought to be enough to support a rally, or at the very least, a stall in the fall.
That’ll do
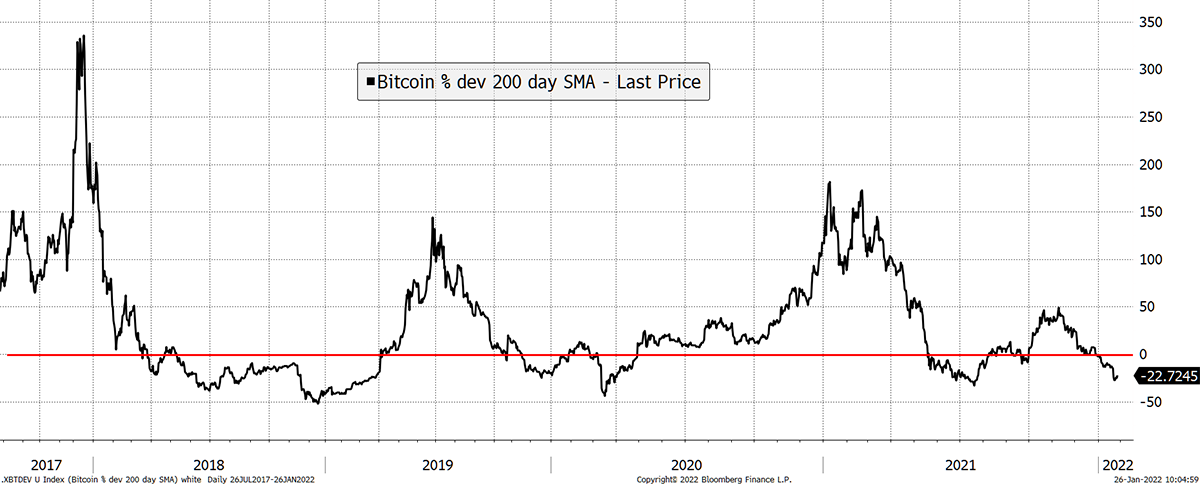
Source: Bloomberg. BTC deviation for the 200-day moving average since 2017.
Before you get too excited, in May, it took two months for an oversold bitcoin to turn and spring back to life. The good news here is that bitcoin is less risky today than it was in early December when the trend started to deteriorate.
ETH has turned down against BTC. The trend is now a 1/5, and we are seeing outflows from the funds.
ETH (priced in BTC) score 1/5
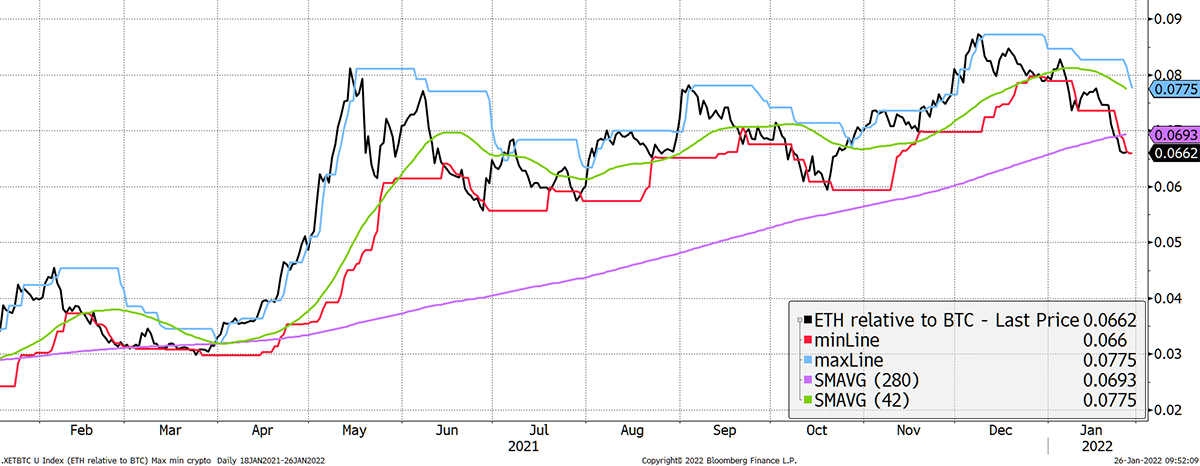
Source: Bloomberg. ETH in BTC with ByteTrend moving averages past year.
Investment flows
ETH has seen 2.5% of outflows from the collective investment funds in contrast to BTC, which has seen 1%. This reaffirms the simple idea that BTC benefits from a selloff, at least in relative terms, as investors would rather hold BTC during times of uncertainty.
ETH holdings 3-month low
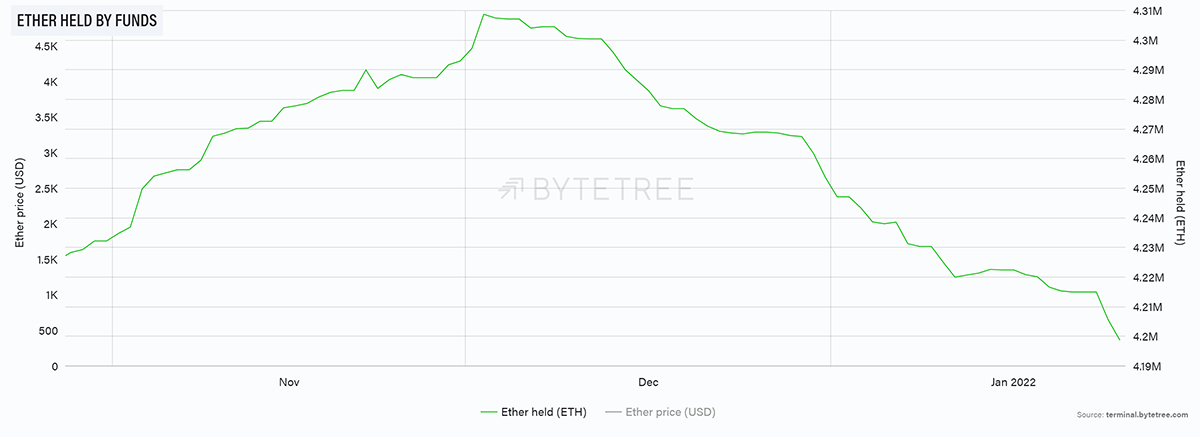
Source: ByteTree. Ether held by funds.
BTC holdings stabilised
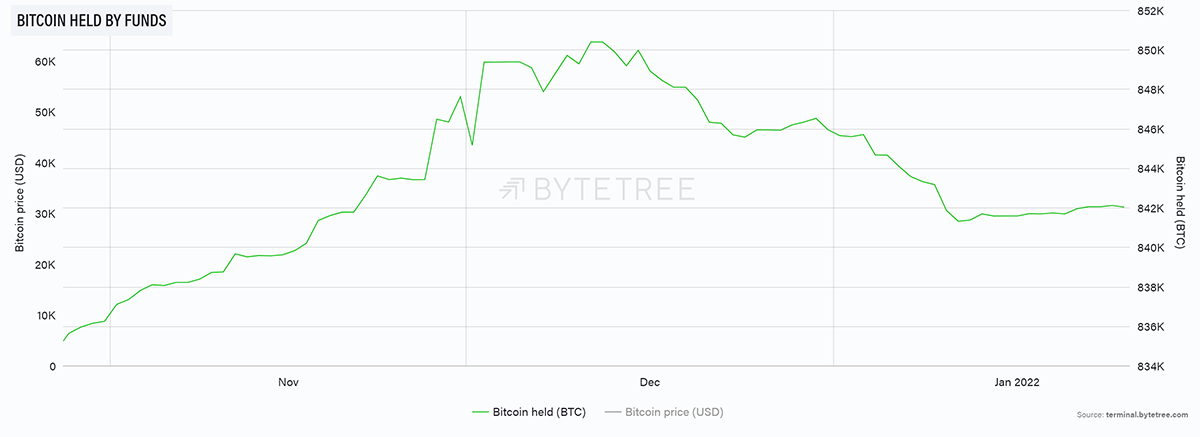
Source: ByteTree. Bitcoin held by funds.
On-chain
One bullish observation from the blockchain is the spike in velocity. Simply put, this means the number of BTC on the move is increasing to offset the fall in price. In other words, the level of economic activity is holding up despite the price drop. There was a good spike in May, which eventually led to a rally. So far, this velocity spike is encouraging, but it is still early days.
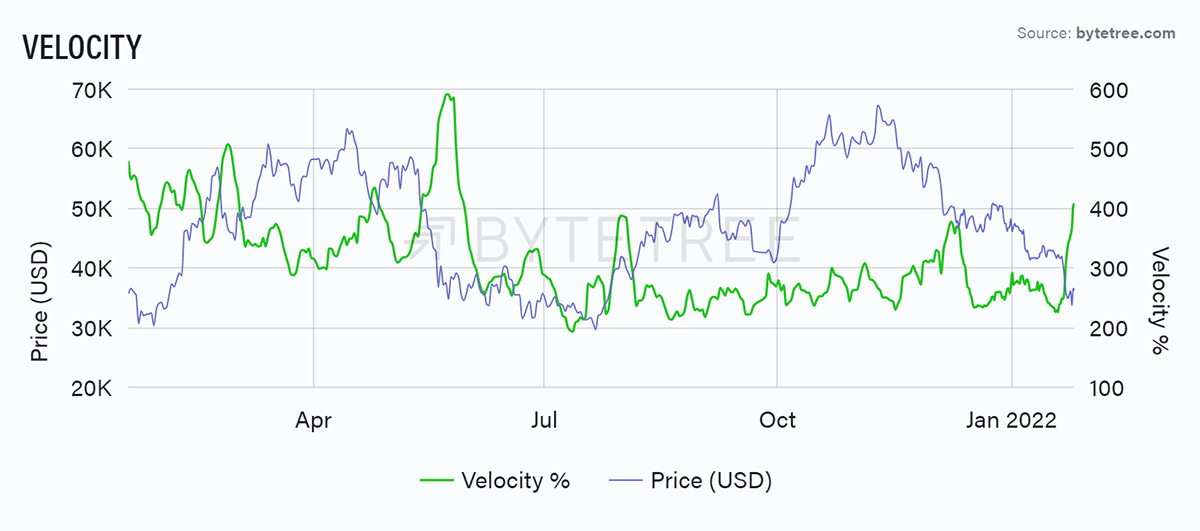
Source: ByteTree. Bitcoin on-chain velocity (%).
Another way to visualise that is using the Fair Value methodology. This version (of which there are potentially many) uses a two-year median as the “anchor” between price and network activity smoothed over 12 weeks. On this basis, bitcoin is currently under-priced.
Bitcoin below fair value
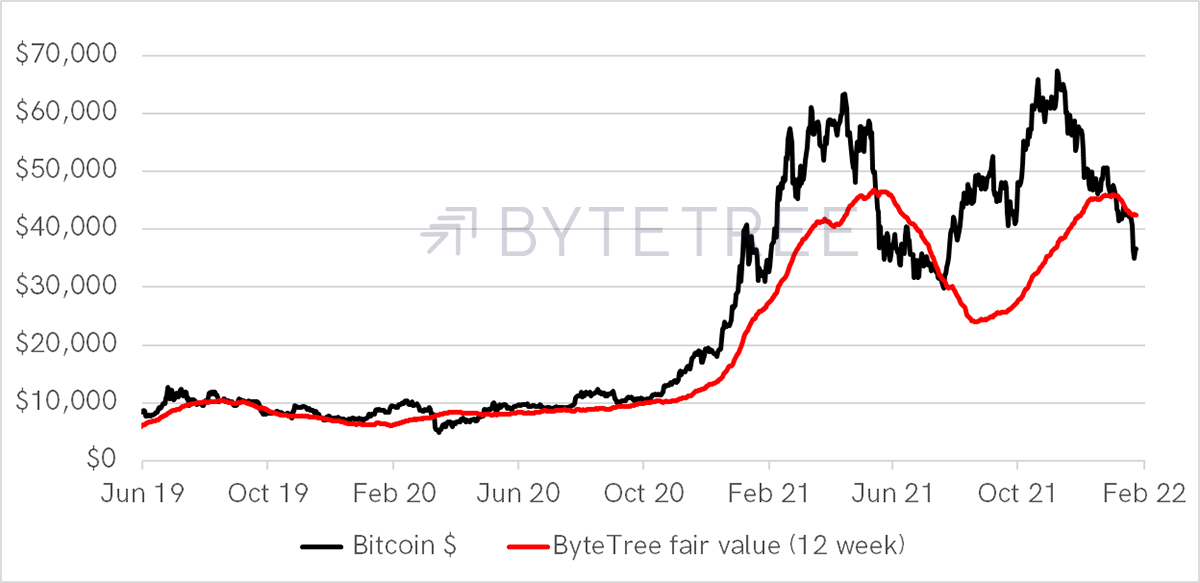
Source: ByteTree
This concept has generally been stronger at the lows than at the highs (2017 excepted).
Bitcoin is back to a discount
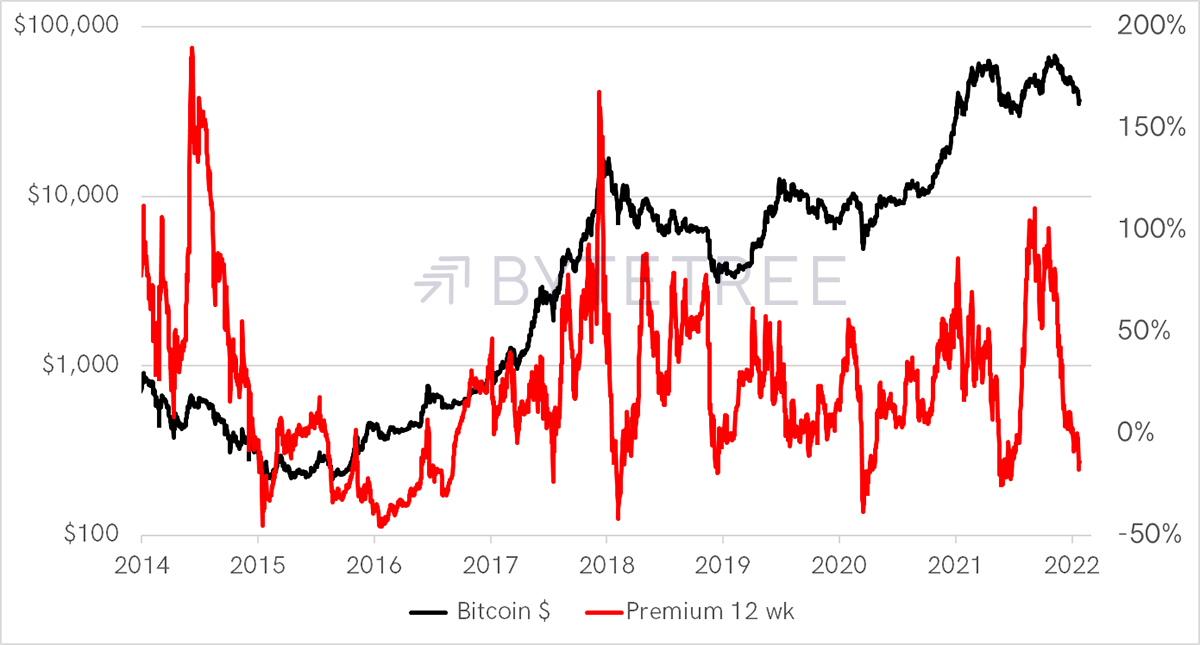
Source: ByteTree
The important point is that so long as the network is alive and kicking, then so is bitcoin. If the network stops, then the price truly can go to zero. Take comfort that it hasn’t.
Macro
Blame tech, rates or Russia as something’s up in 2022. One of my favourite risk indicators comes from the FINRA advance-decline data in bonds, most of which are corporate. We can see a deterioration so that more bonds are now falling than rising. Some of that will be related to rates, and some of it to credit. But it is happening, and markets don’t like it.
The last times were 2007/8, 2014/5 and 2018 - all of which put pressure on financial markets. No one likes a higher cost of borrowing.
Deterioration in bonds
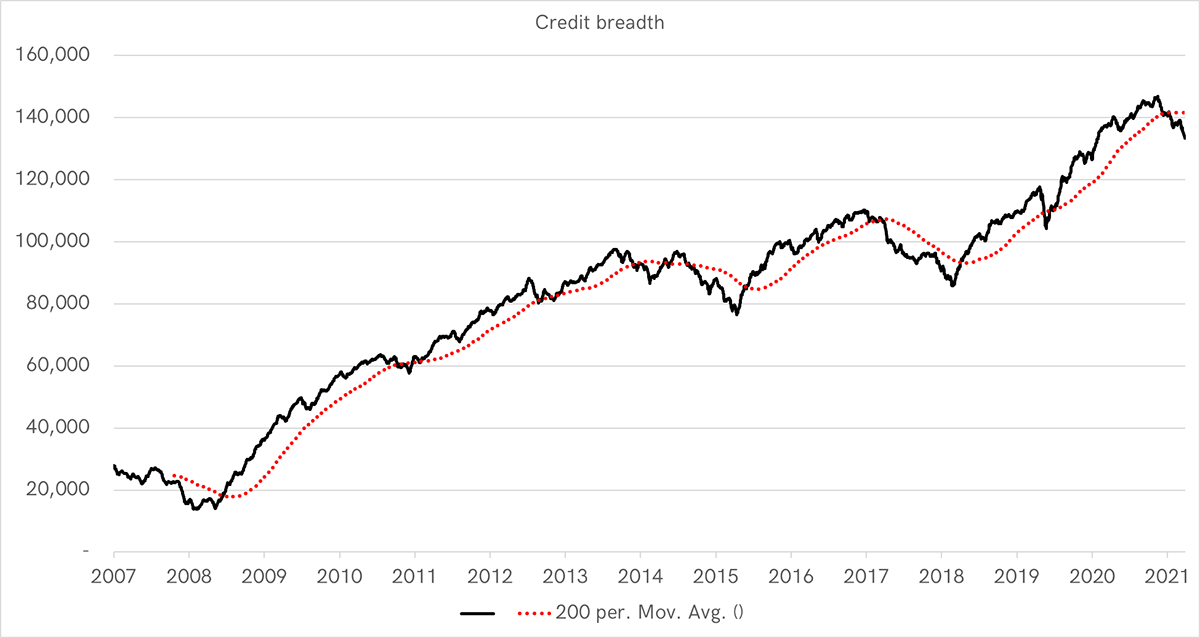
Source: FINRA. Bond breadth since 2007.
Otherwise, as I have said in recent weeks, the macro is upbeat. Bitcoin historically likes rising rates and inflation, which is the current trend. What it doesn’t like is a selloff in risk assets and a strong US dollar. Unfortunately, that is also with us.
US dollar 4/5
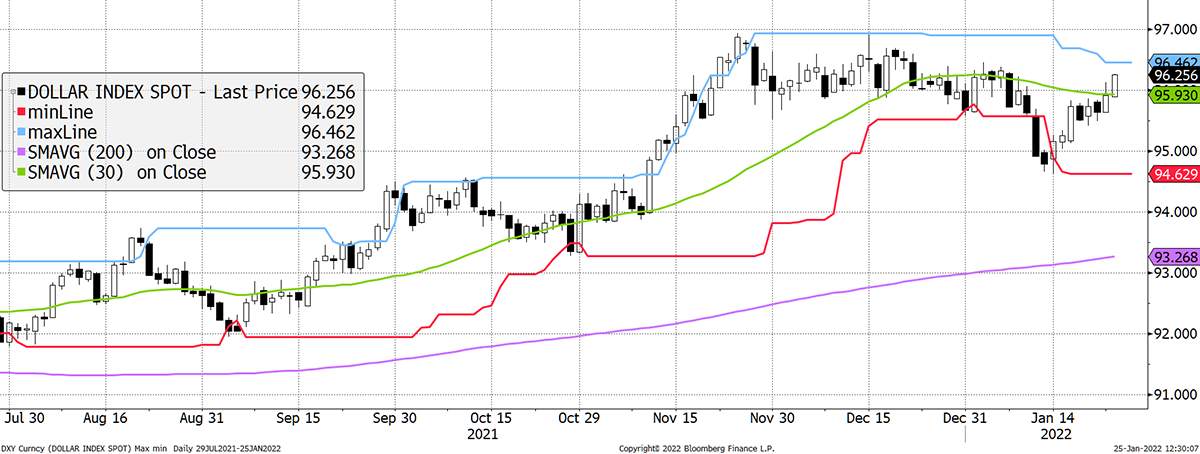
Source: Bloomberg. US dollar index past 6 months.
The Cryptonomy
As alluded to earlier, the bloodbath over the last week has resulted in the majority of the Cryptonomy scoring 0/5s on ByteTrend. The most impressive exception to the rule is Cosmos (ATOM), which continues to grow its ecosystem and transcend market sentiment. The increased utilisation of the Osmosis DEX, upcoming airdrops and implementation of its Polkadot bridge are likely causes of its impressive price action.
The beauty of these market sell-offs is that not only do they kick the tires off and really test investor conviction, but they also challenge the underlying technology of protocols in moments of havoc and network congestion.
Last week, I highlighted the outperformance of layer-1 protocols, or ETH-killers, such as NEAR and Fantom in light of their promises of scalability and high throughput. Indeed, Fantom now ranks third in Total Value Locked (TVL), having flipped the Binance Smart Chain.
However, what needs to be considered is that achieving scalability is not as easy as bull-markets may have people believe. This week, we have evidence that killing ETH is not as simple as crypto twitter hopes. On the one hand, we had Solana, one of the most promising ETH-killers out there, face a 48-hour shutdown; on the other, we had Cardano’s first DEX, Sundaeswap, suffer numerous failed transactions days after its launch date.
While Ethereum does get unreasonably expensive to operate on in moments of network congestion, at least it never stops working. The known risk of high gas fees is much more acceptable than the unknown risk of whether a blockchain ceases to function. It will be interesting to see if the ETH-killers will be better for it, but mud sticks, and what doesn’t kill Ethereum, makes it stronger.
Summary
There is plenty of evidence that bitcoin is oversold and further evidence that institutional investors are not fleeing this alternative asset. They prefer bitcoin to crypto and that will remain the case until things improve.
The price will hold the $30k to $60k range until there is a major catalyst to propel it otherwise. Right now, that break will eventually be upward assisted by inflation, wider acceptance, and eventually halving in 2024.

